Childcare Special Topic
Sihong
10/8/2020
Before COVID-19, Childcare Situations
Percentage of Families Using Out-of-Home Childcare
Total Responses
Out of the 1280 respondents, there were 49.77% of caregivers reporting using out-of-home childcare before COVID-19.
## # A tibble: 1 x 2
##       n Percent
##   <int>   <dbl>
## 1  1280    49.8
Breakdown by Race
Before COVID-19, there were 54.72% of Black caregivers, 49.73% of White caregivers, and 47.70% of Latinx caregivers reporting using out-of-home childcare. The differences across racial/ethnic groups were not statistically significant.
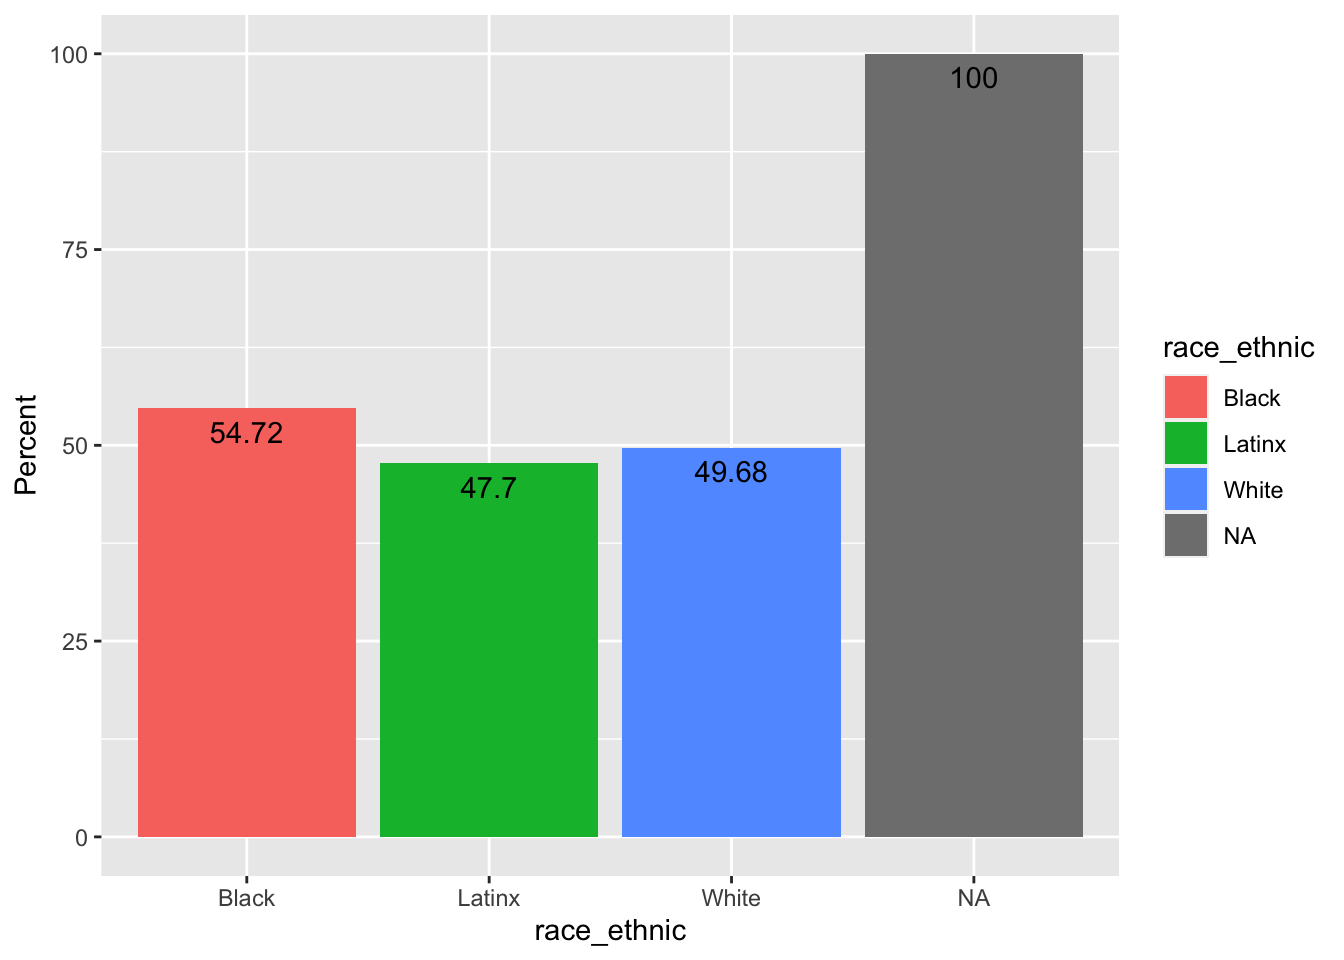
## Number of cases in table: 1279
## Number of factors: 2
## Test for independence of all factors:
##  Chisq = 1.4499, df = 2, p-value = 0.4843
Breakdown by Income
Before COVID-19, both low-income and high-income families reported similar percentage of using out-of-home childcare.
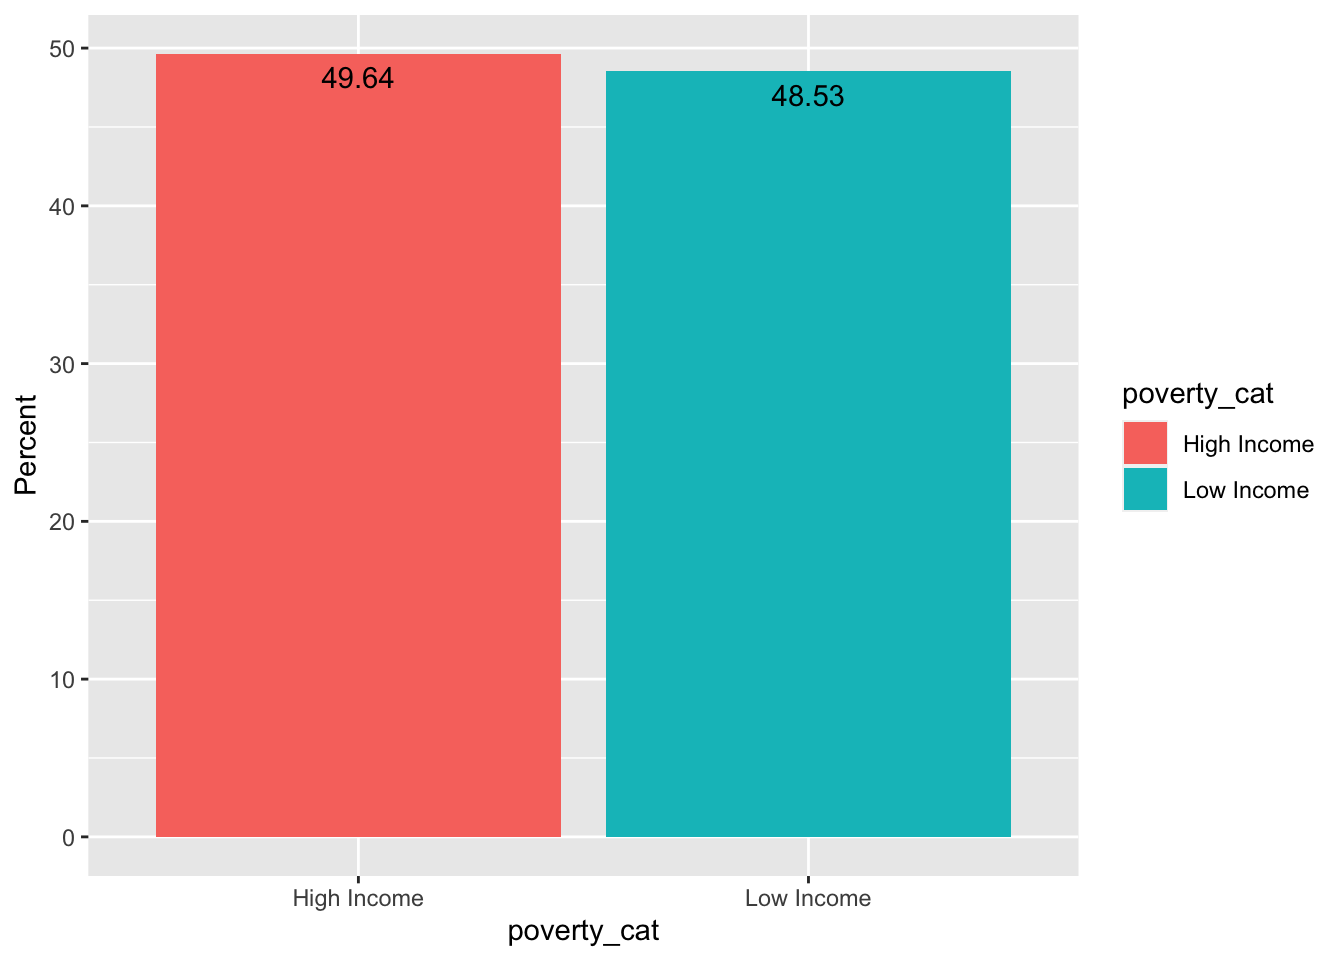
## Number of cases in table: 207
## Number of factors: 2
## Test for independence of all factors:
##  Chisq = 0.022544, df = 1, p-value = 0.8806
Breakdown by Single Parent Status
Before COVID-19, single parents reported slightly more usage of out-of-home childcare. However, the differences were not statistically significant.
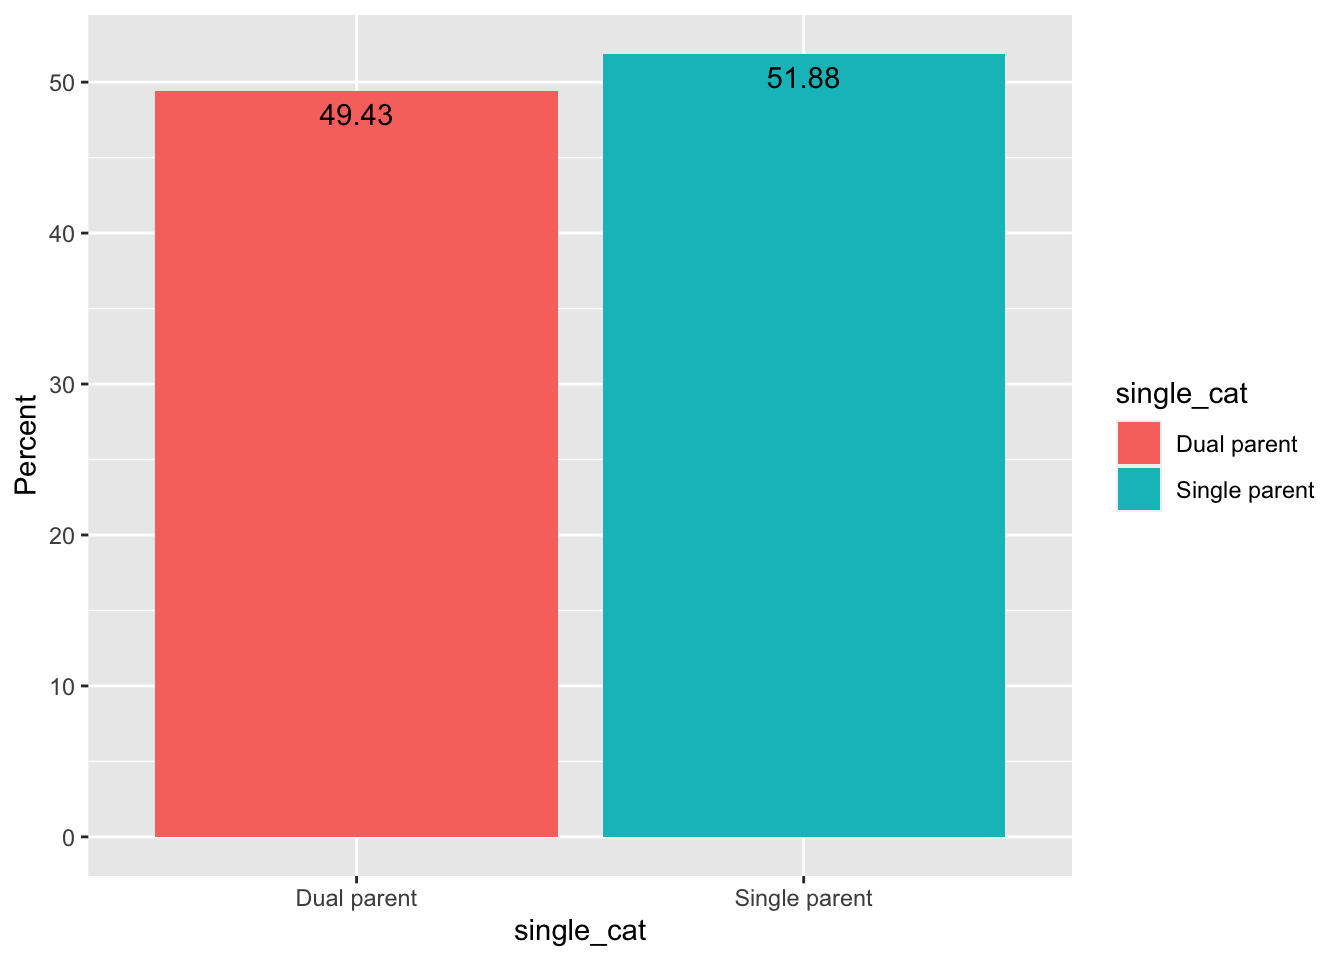
## Number of cases in table: 1278
## Number of factors: 2
## Test for independence of all factors:
##  Chisq = 0.2855, df = 1, p-value = 0.5931
Breakdown by Child Disability Status
Before COVID-19, parents of children with disability reported less usage of out-of-home childcare. However, the differences were not statistically significant.
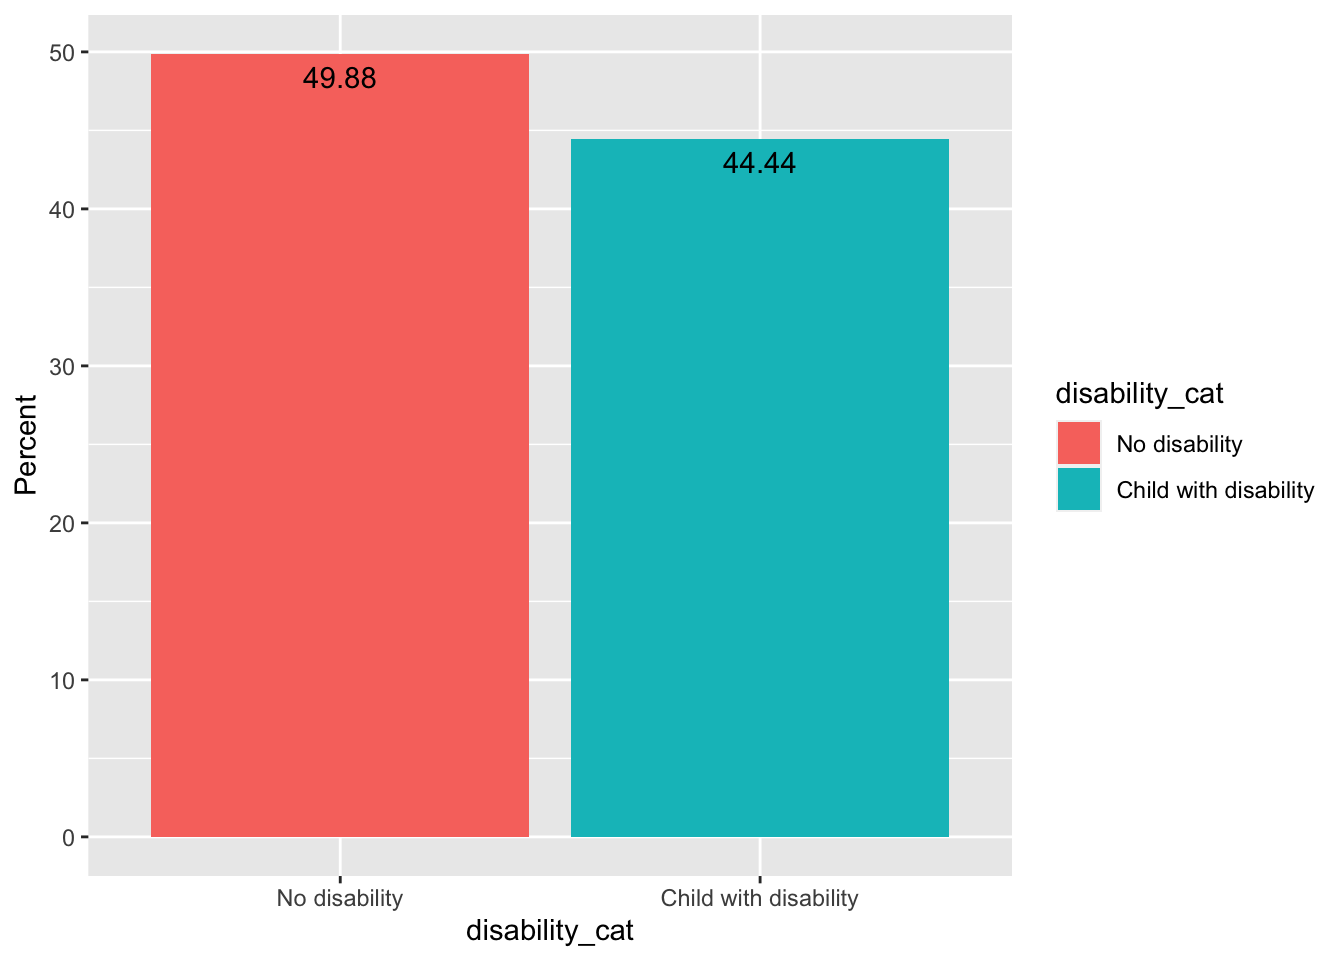
## Number of cases in table: 1280
## Number of factors: 2
## Test for independence of all factors:
##  Chisq = 0.3124, df = 1, p-value = 0.5762
Important Reasons Caregivers Selected Pre-COVID Childcare Arrangements
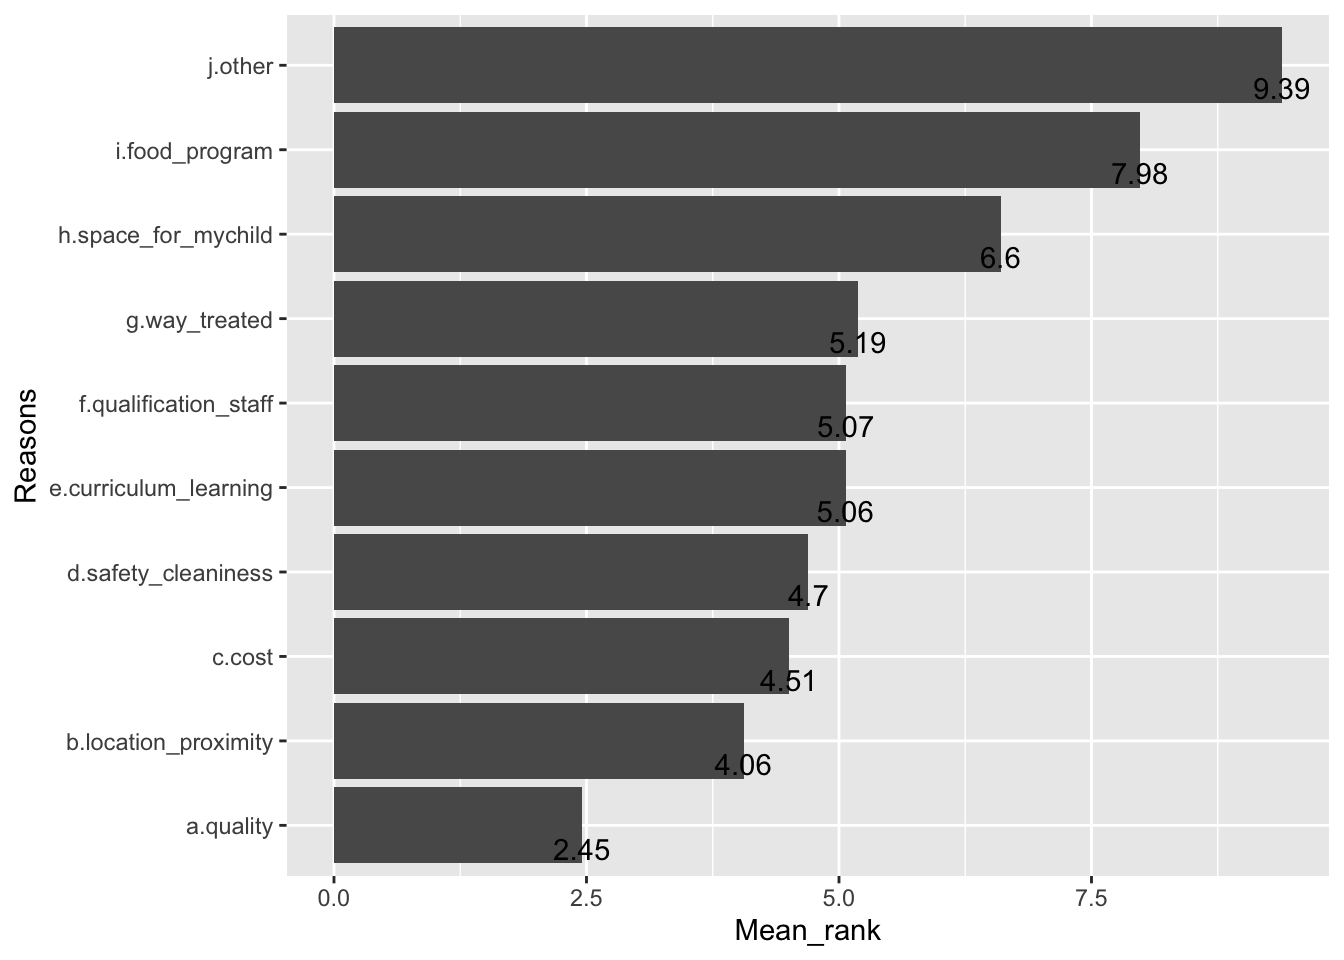
*Note. Lower mean rank scores indicates more important reasons for selecting childcare arrangements.
Important Itmes Caregivers Want to Improve in Pre-COVID Childcare Arrangements
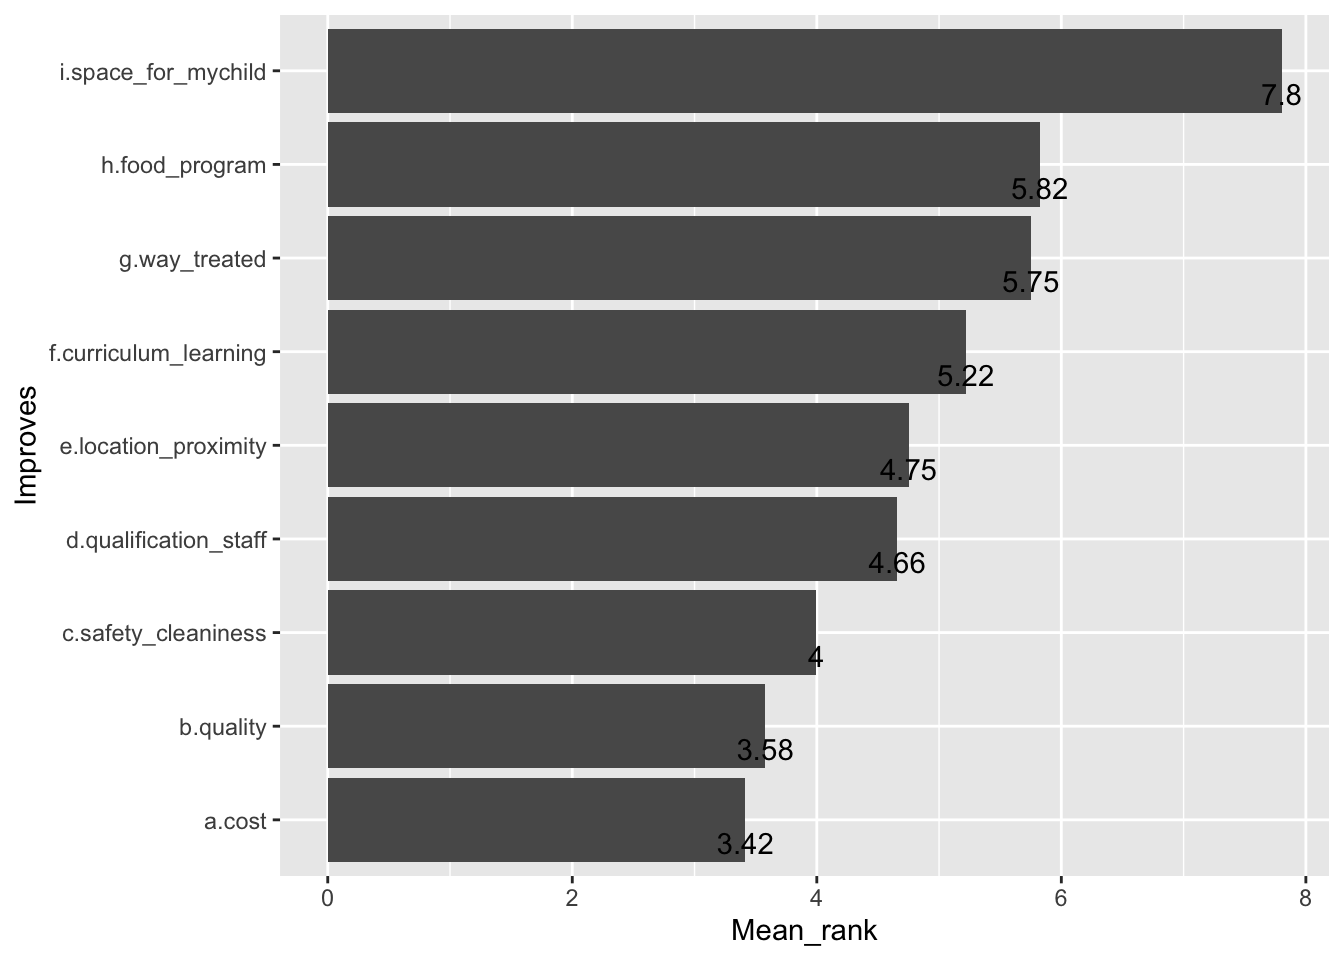
*Note. Lower mean rank scores indicates items that caregivers want to improve the most.
Childcare Situations After COVID-19
Caregivers Looking for Childcare Currently
Total Responses
Out of the 1280 respondents, there were 14.61% of caregivers looking for childcare currently.
## # A tibble: 1 x 2
##       n Percent
##   <int>   <dbl>
## 1  1280    14.6
Breakdown by Race
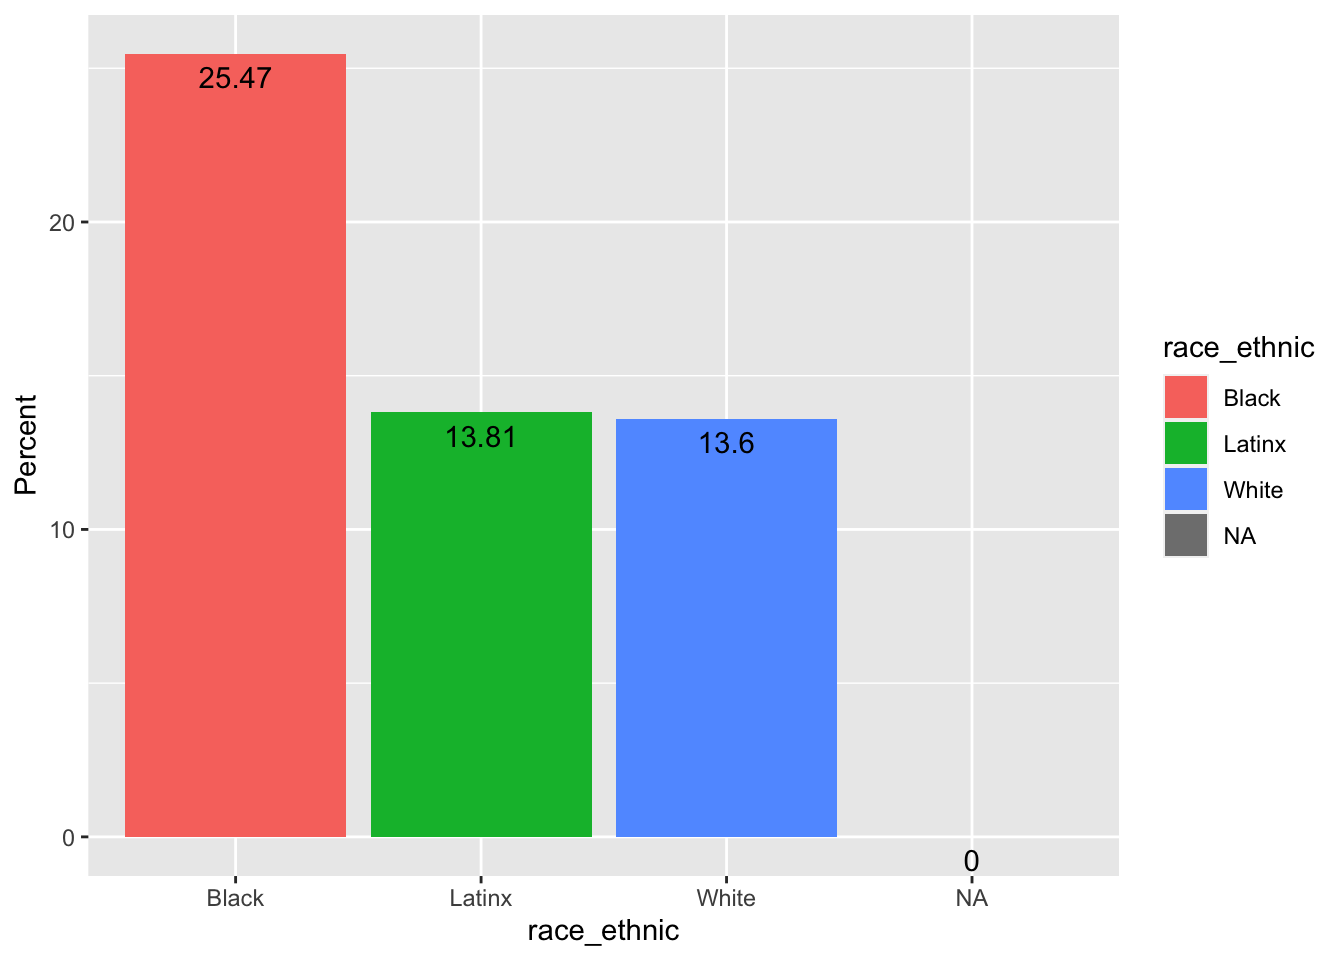
There were 25.47% of Black caregivers, 13.58% of White caregivers, and 13.81% of Latinx caregivers reporting currently looking for childcare. The differences across racial/ethnic groups were statistically significant.
## Number of cases in table: 1278
## Number of factors: 2
## Test for independence of all factors:
##  Chisq = 10.883, df = 2, p-value = 0.004333
Breakdown by Income
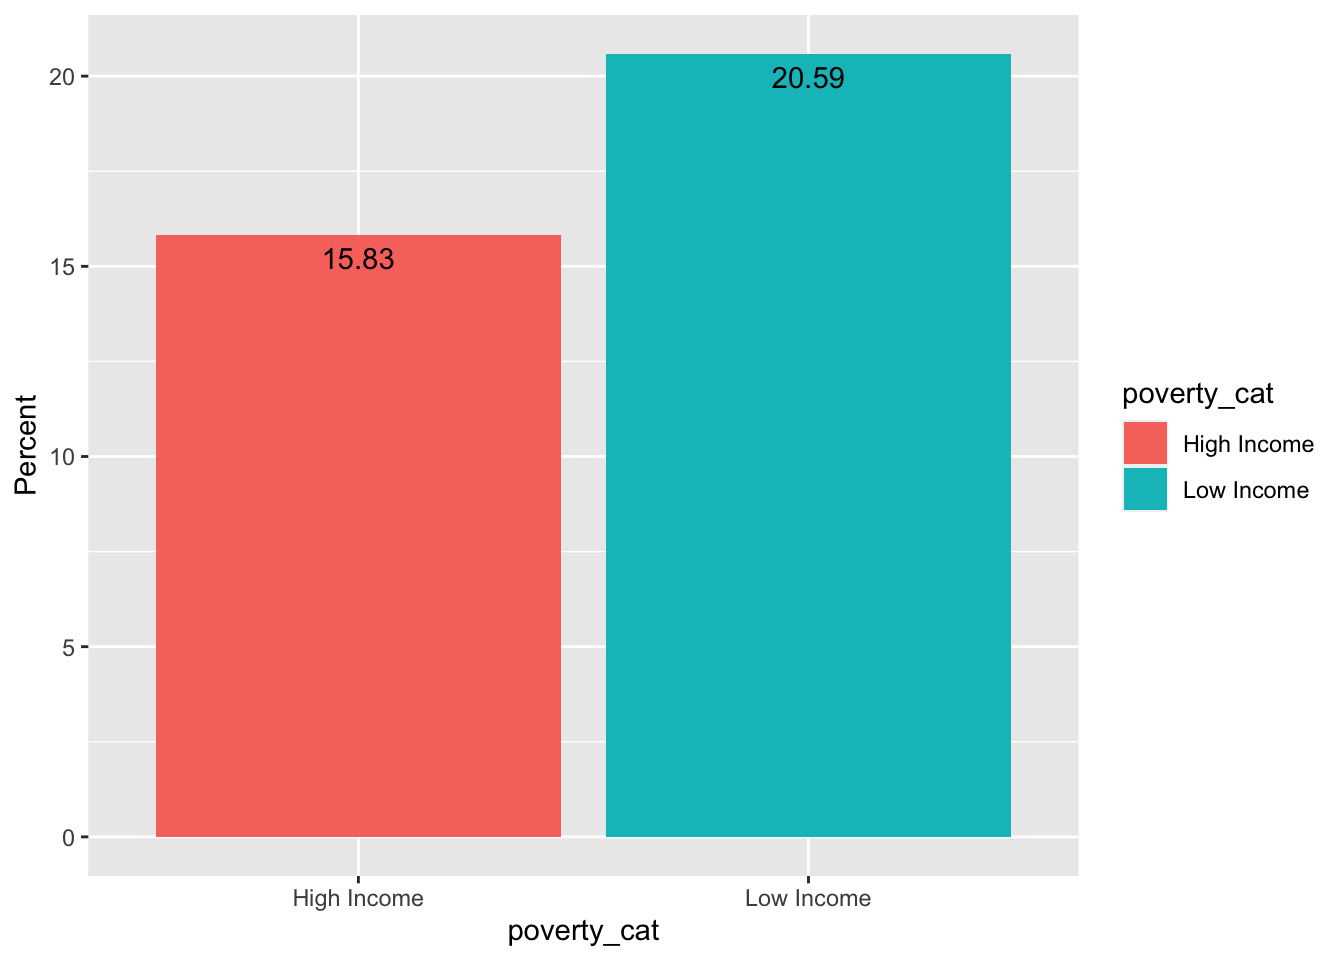
There were 20.59% of low-income caregivers and 15.83% of high-income caregivers reporting currently looking for childcare. However, the differences across the two income groups were not statistically significant.
## Number of cases in table: 207
## Number of factors: 2
## Test for independence of all factors:
##  Chisq = 0.7204, df = 1, p-value = 0.396
Breakdown by Single Parent Status
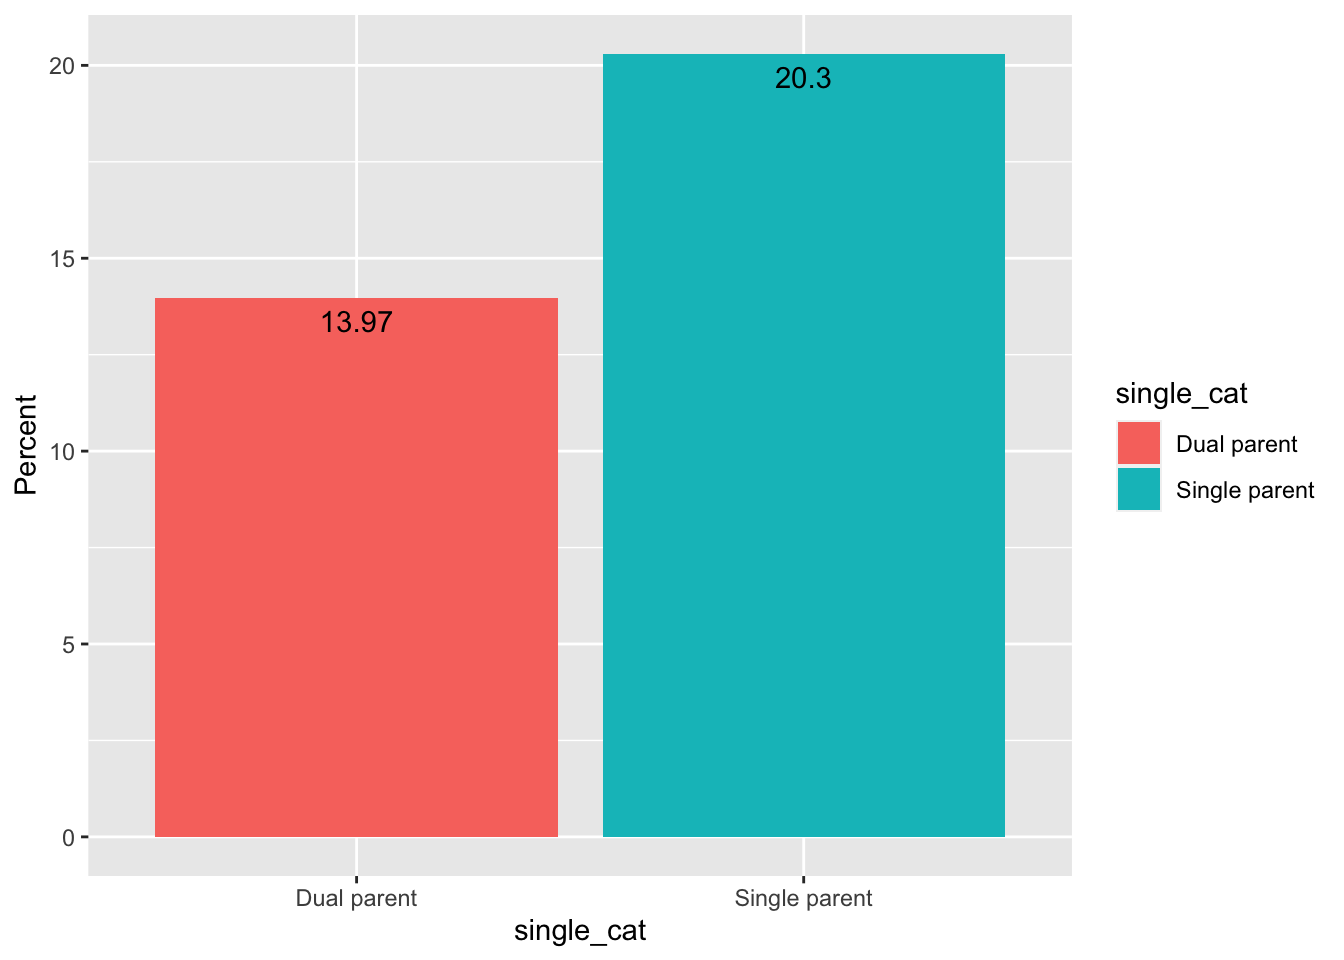
There were 20.30% of single-parent caregivers and 13.97% of non-single-parent caregivers reporting currently looking for childcare. The differences across the two groups was marginally statistically significant.
## Number of cases in table: 1277
## Number of factors: 2
## Test for independence of all factors:
##  Chisq = 3.801, df = 1, p-value = 0.05122
Breakdown by Child Disability Status
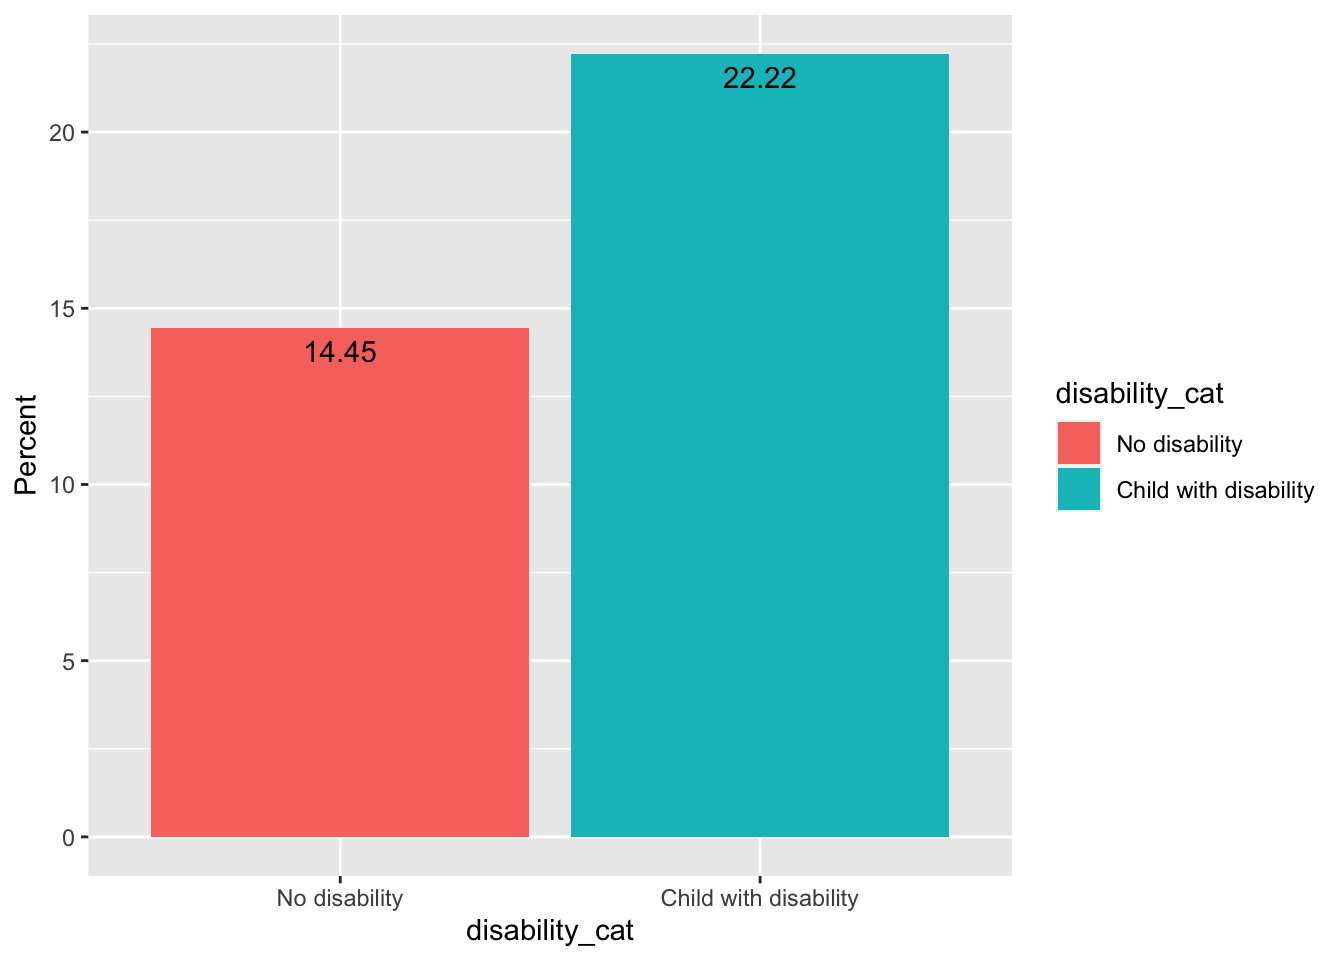
There were 22.2% of caregivers of children with disability and 14.45% of caregivers of children without disability reporting currently looking for childcare. However, The differences across the two groups not statistically significant.
##
##  Fisher's Exact Test for Count Data
##
## data:  table(ccare$post_lfcc, ccare$disability_cat)
## p-value = 0.2677
## alternative hypothesis: true odds ratio is not equal to 1
## 95 percent confidence interval:
##  0.5503895 4.4049228
## sample estimates:
## odds ratio
##    1.68978
*Note. Small sample of children with disability (n = 27)
Among Caregivers Currently Looking for Childcare, Challenges Caregivers are Experiences with Childcare
*Note.
1) This section only included respondents who reported currently looking for childcare (n = 187)
2) With relatively small sample size, results need to be interpreted cautiously
Challenges Finding Childcare
Total Responses
Out of the 187 respondents, there were 88.24% of caregivers reporting experiencing challenges finding childcare.
## # A tibble: 1 x 2
##       n Percent
##   <int>   <dbl>
## 1   187    88.2
Breakdown by Race
There were 81.84% of Black caregivers, 87.40% of White caregivers, and 96.97% of Latinx caregivers reporting currently experiencing challenges finding childcare. The differences across racial/ethnic groups were not statistically significant. 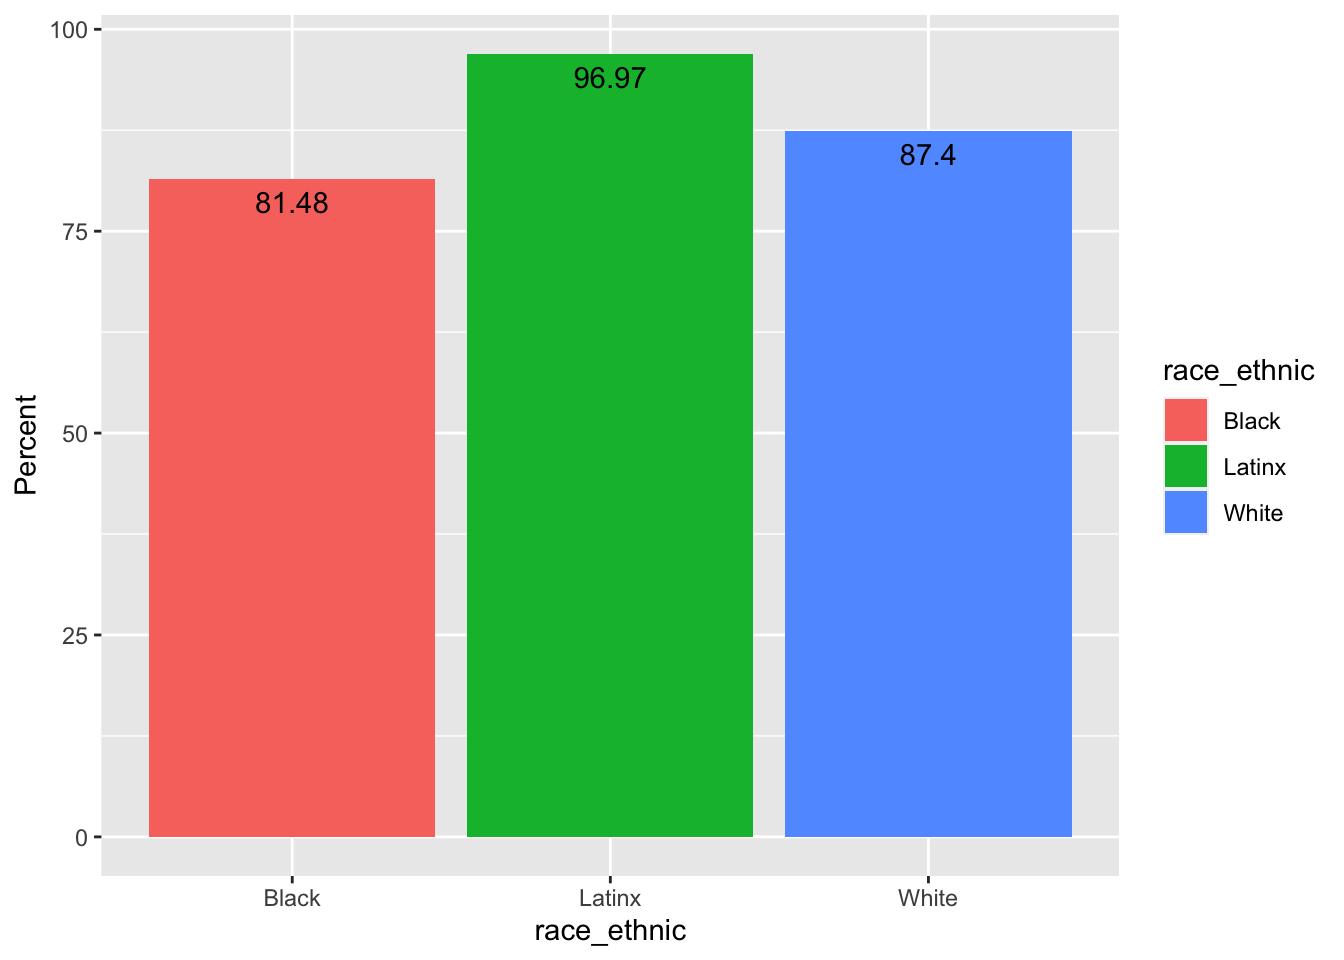
##
##  Fisher's Exact Test for Count Data
##
## data:  table(ccare_cg$post_cg_fd, ccare_cg$race_ethnic)
## p-value = 0.1412
## alternative hypothesis: two.sided
Breakdown by Income
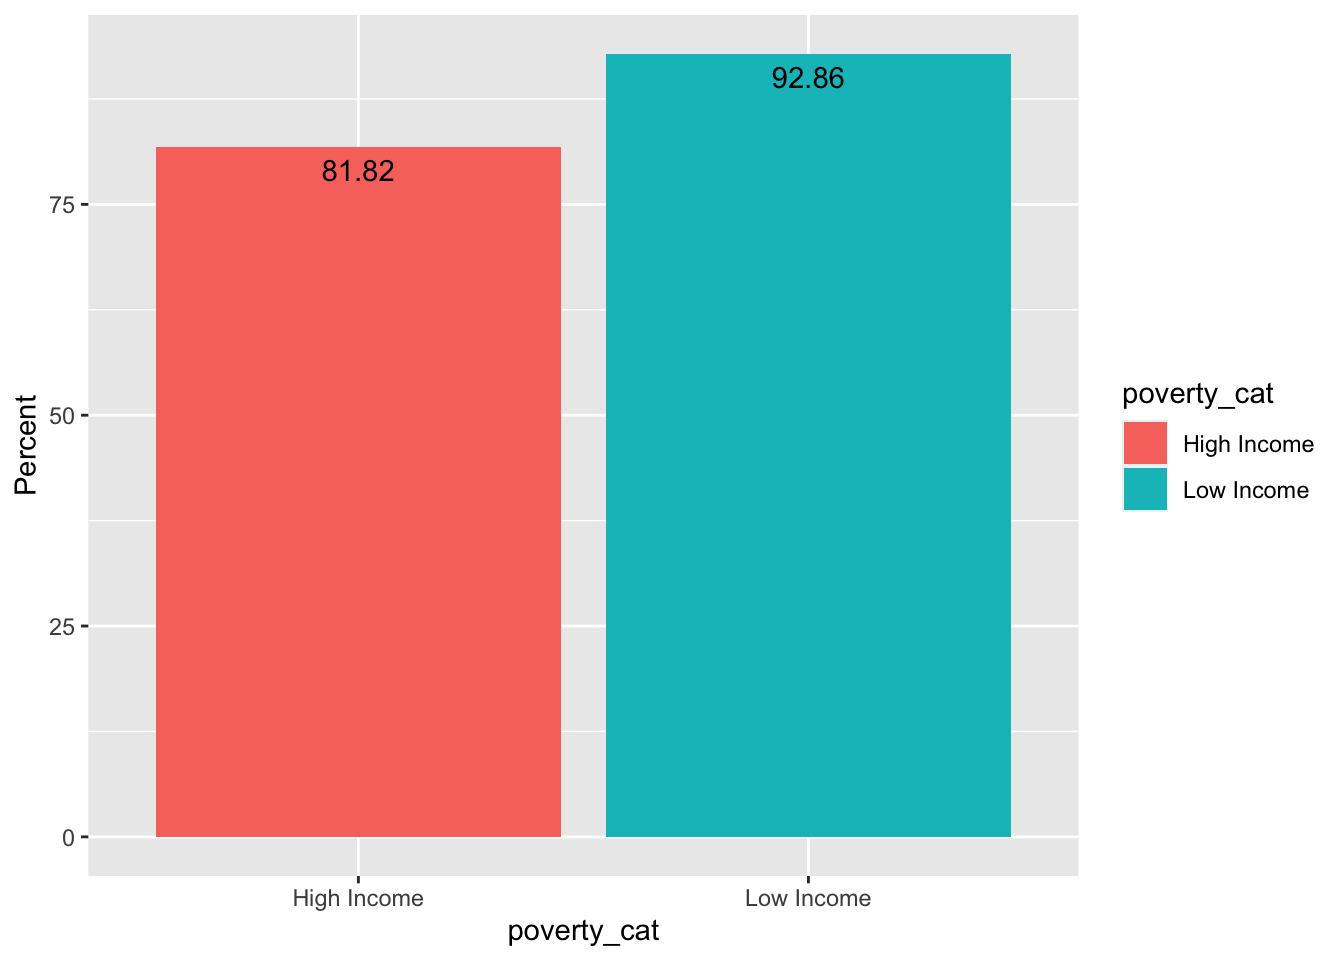
There were 92.86% of low-income caregivers and 81.82% of high-income caregivers currently experiencing challenges finding childcare. The differences across the two groups were not statistically significant.
##
##  Fisher's Exact Test for Count Data
##
## data:  table(ccare_cg$post_cg_fd, ccare_cg$poverty_cat)
## p-value = 0.6283
## alternative hypothesis: true odds ratio is not equal to 1
## 95 percent confidence interval:
##    0.2399918 152.9008536
## sample estimates:
## odds ratio
##   2.814317
*Note. Very small sample size.
Breakdown by Single Parent Status
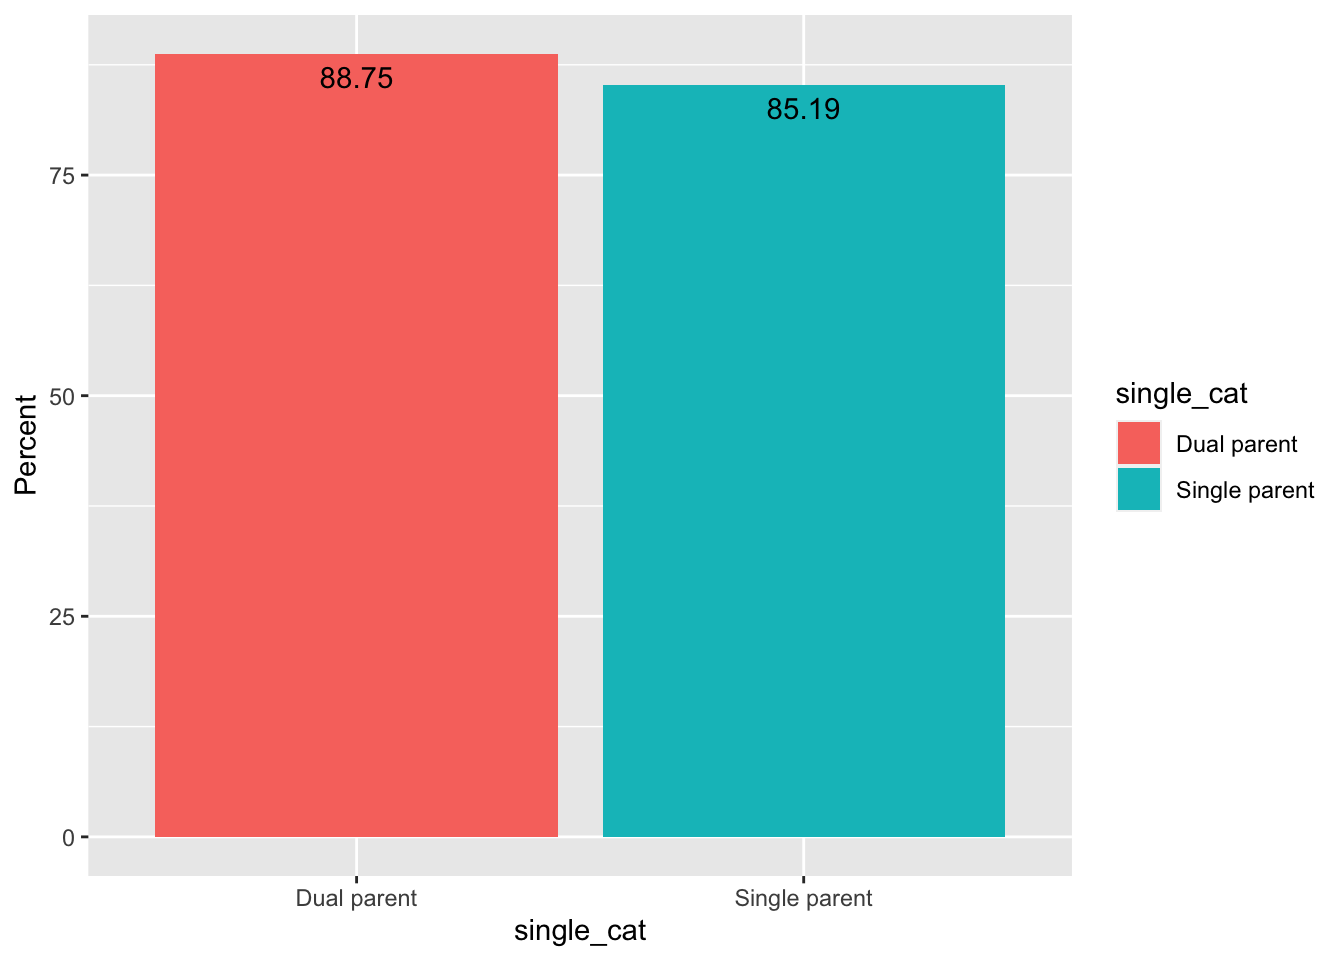
There were 85.19% of single-parent caregivers and 88.75% of non-single-parent caregivers currently experiencing challenges finding childcare. The differences across the two groups were not statistically significant.
##
##  Fisher's Exact Test for Count Data
##
## data:  table(ccare_cg$post_cg_fd, ccare_cg$single_cat)
## p-value = 0.5312
## alternative hypothesis: true odds ratio is not equal to 1
## 95 percent confidence interval:
##  0.2129193 3.2306045
## sample estimates:
## odds ratio
##  0.7302162
Breakdown by Child Disability Status
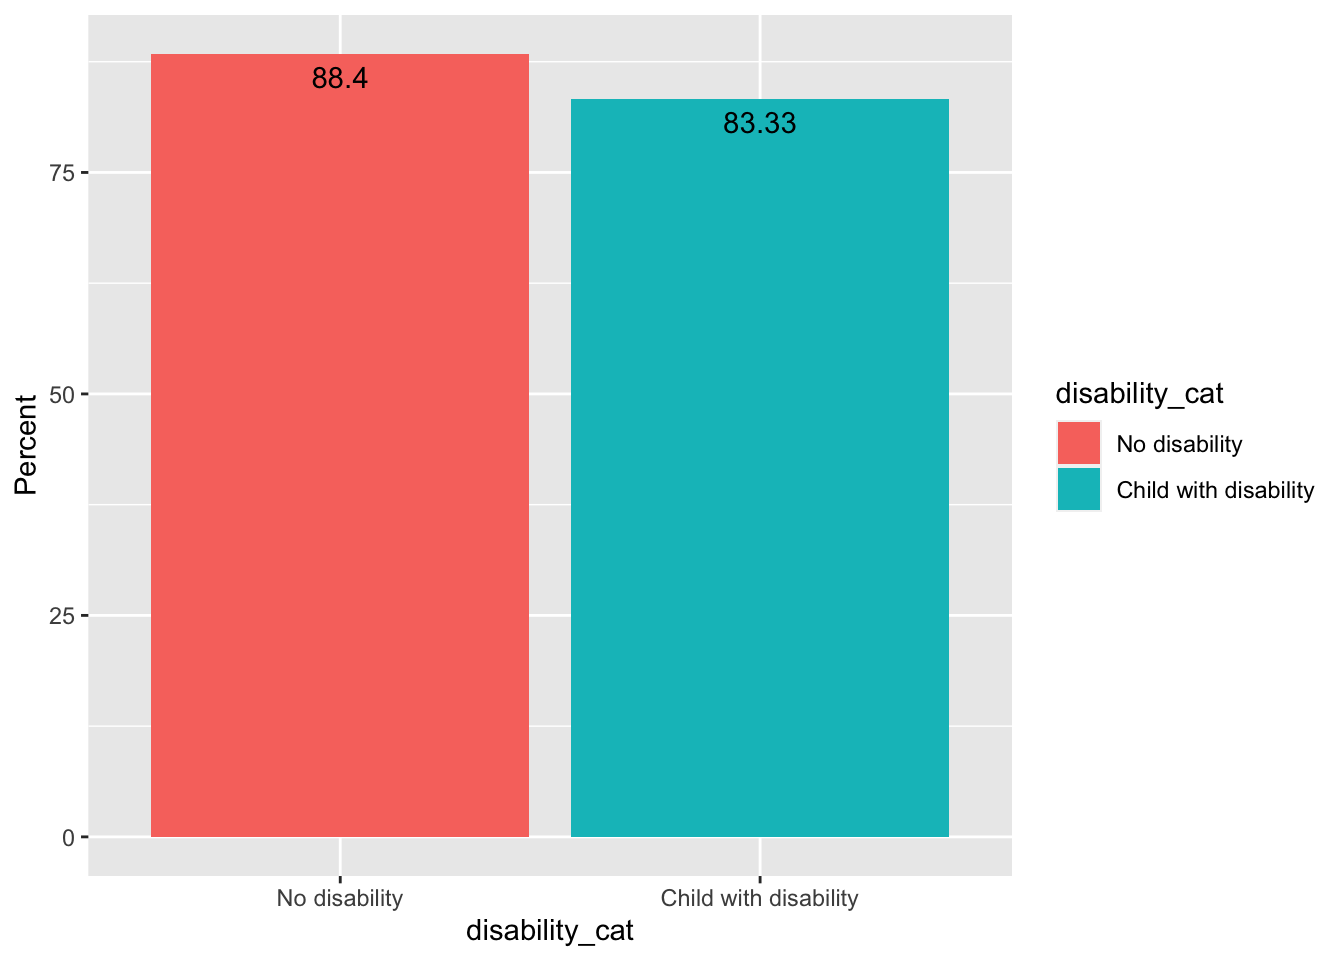
There were 83.33% of caregivers of children with disability and 88.4% of caregivers of children without disability currently experiencing challenges finding childcare. The differences across the two groups were not statistically significant.
##
##  Fisher's Exact Test for Count Data
##
## data:  table(ccare_cg$post_cg_fd, ccare_cg$disability_cat)
## p-value = 0.5332
## alternative hypothesis: true odds ratio is not equal to 1
## 95 percent confidence interval:
##   0.06863057 32.49950916
## sample estimates:
## odds ratio
##  0.6579698
*Note. Small sample size of children with disability (n = 27).
Challenges Affording Childcare Among Caregivers Currently Looking for Childcare
*Note. This section has small numbers of respondents (n = 187). Interpret results with causion
Total Responses
Out of the 187 respondents who are currently looking for childcare, there were 68.45% of caregivers reporting experiencing challenges affording childcare.
## # A tibble: 1 x 2
##       n Percent
##   <int>   <dbl>
## 1   187    68.4
Breakdown by Race
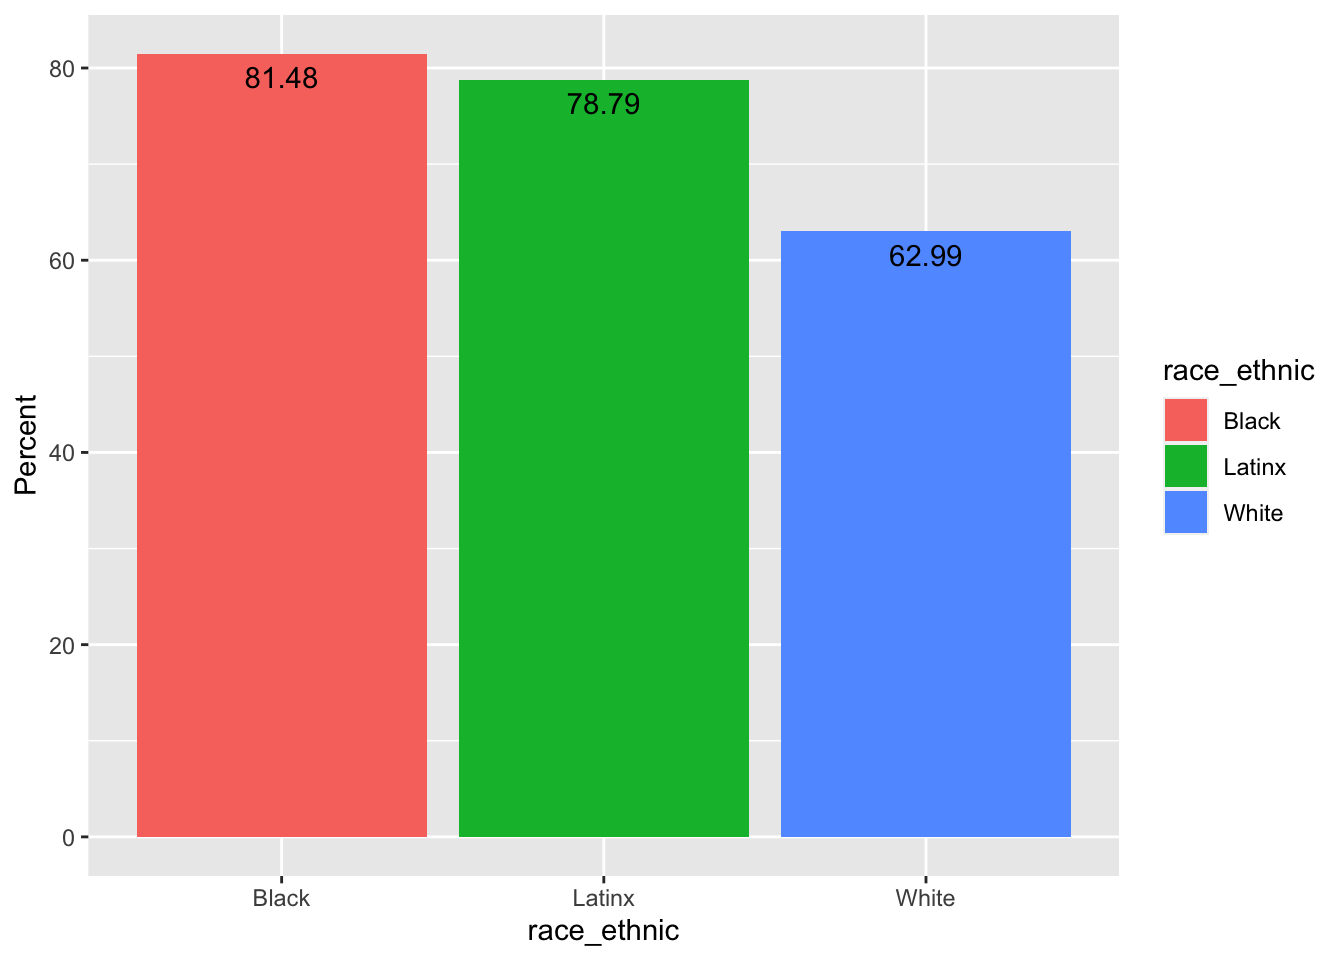
There were 81.48% of Black caregivers, 62.99% of White caregivers, and 78.79% of Latinx caregivers reporting currently experiencing challenges affording childcare. The differences across racial/ethnic groups were marginally statistically significant.
## Number of cases in table: 187
## Number of factors: 2
## Test for independence of all factors:
##  Chisq = 5.508, df = 2, p-value = 0.06368
Breakdown by Income
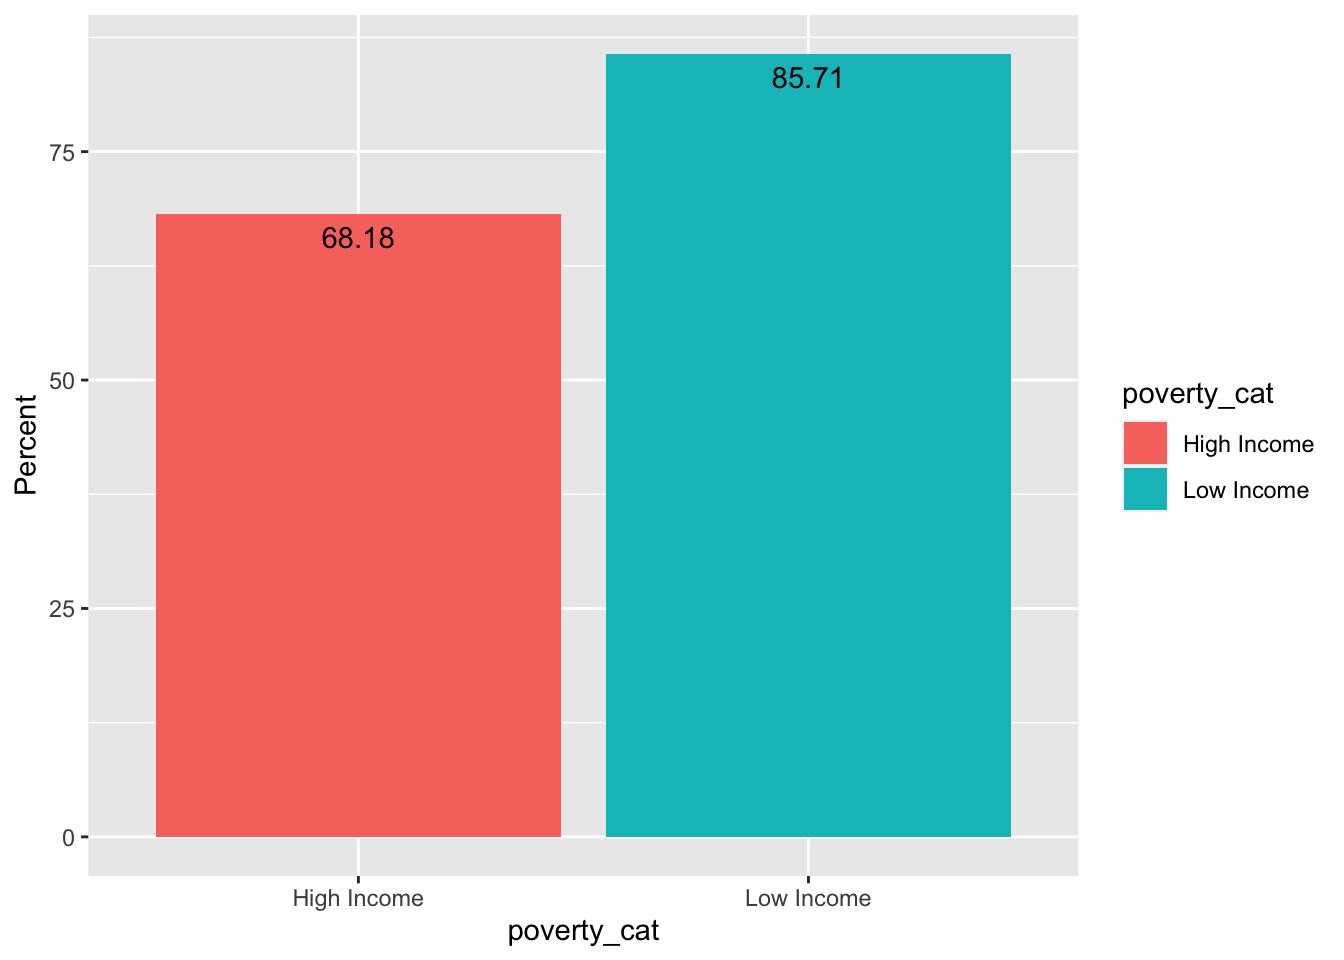
There were 85.71% of low-income caregivers and 68.18% of high-income caregivers currently experiencing challenges affording childcare. The differences across the two groups were not statistically significant (becuase of the small sample size).
##
##  Fisher's Exact Test for Count Data
##
## data:  table(ccare_cg$post_cg_af, ccare_cg$poverty_cat)
## p-value = 0.4315
## alternative hypothesis: true odds ratio is not equal to 1
## 95 percent confidence interval:
##   0.410463 31.642472
## sample estimates:
## odds ratio
##   2.725649
*Note: Very small sample size.
Breakdown by Single Parent Status
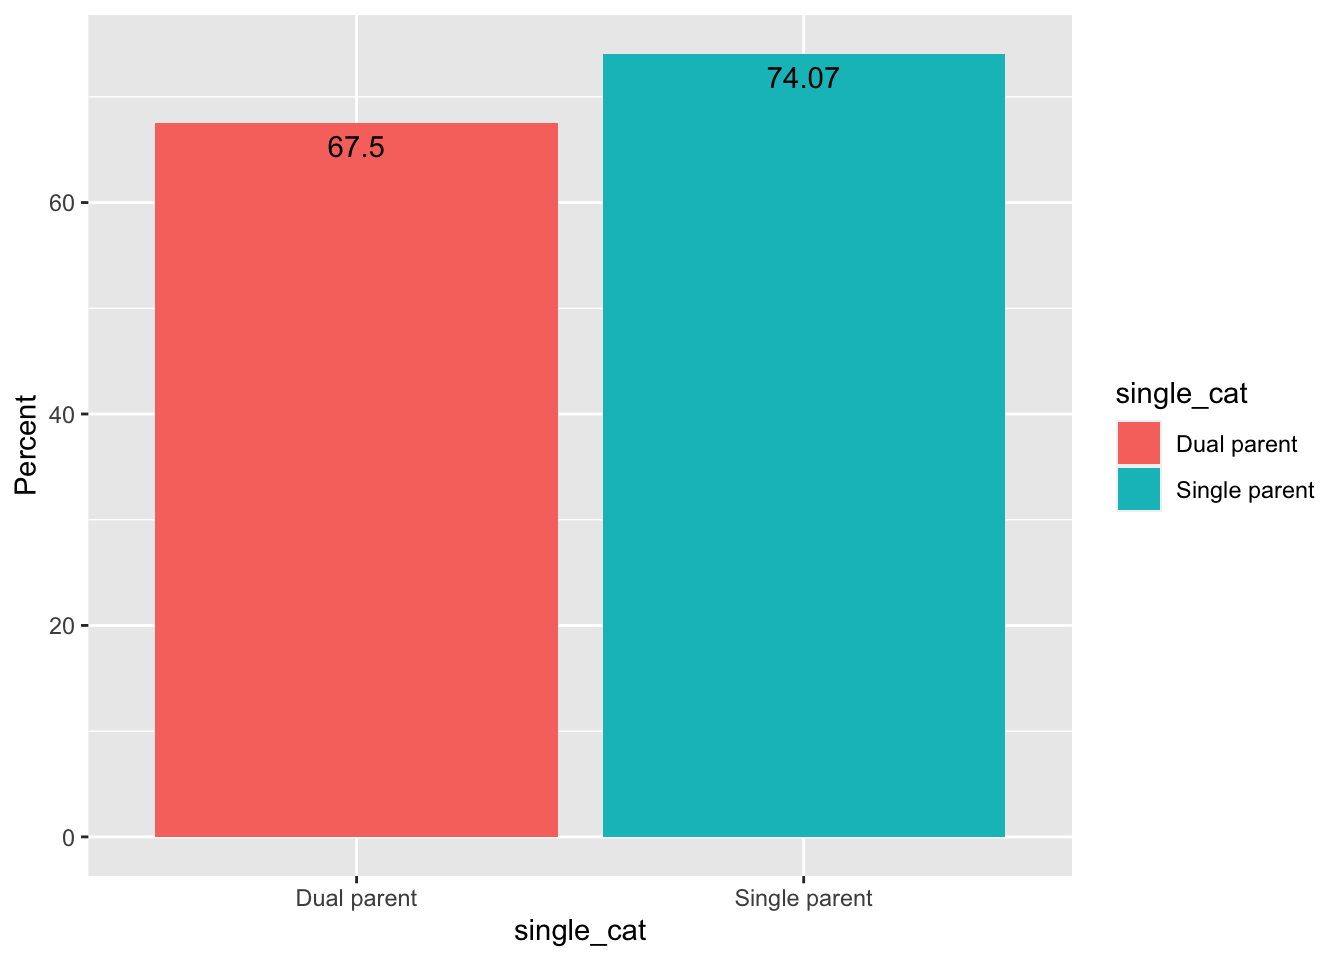
There were 74.07% of single-parent caregivers and 67.50% of non-single-parent caregivers currently experiencing challenges affording childcare. The differences across the two groups were not statistically significant.
## Number of cases in table: 187
## Number of factors: 2
## Test for independence of all factors:
##  Chisq = 0.4623, df = 1, p-value = 0.4965
Breakdown by Child Disability Status
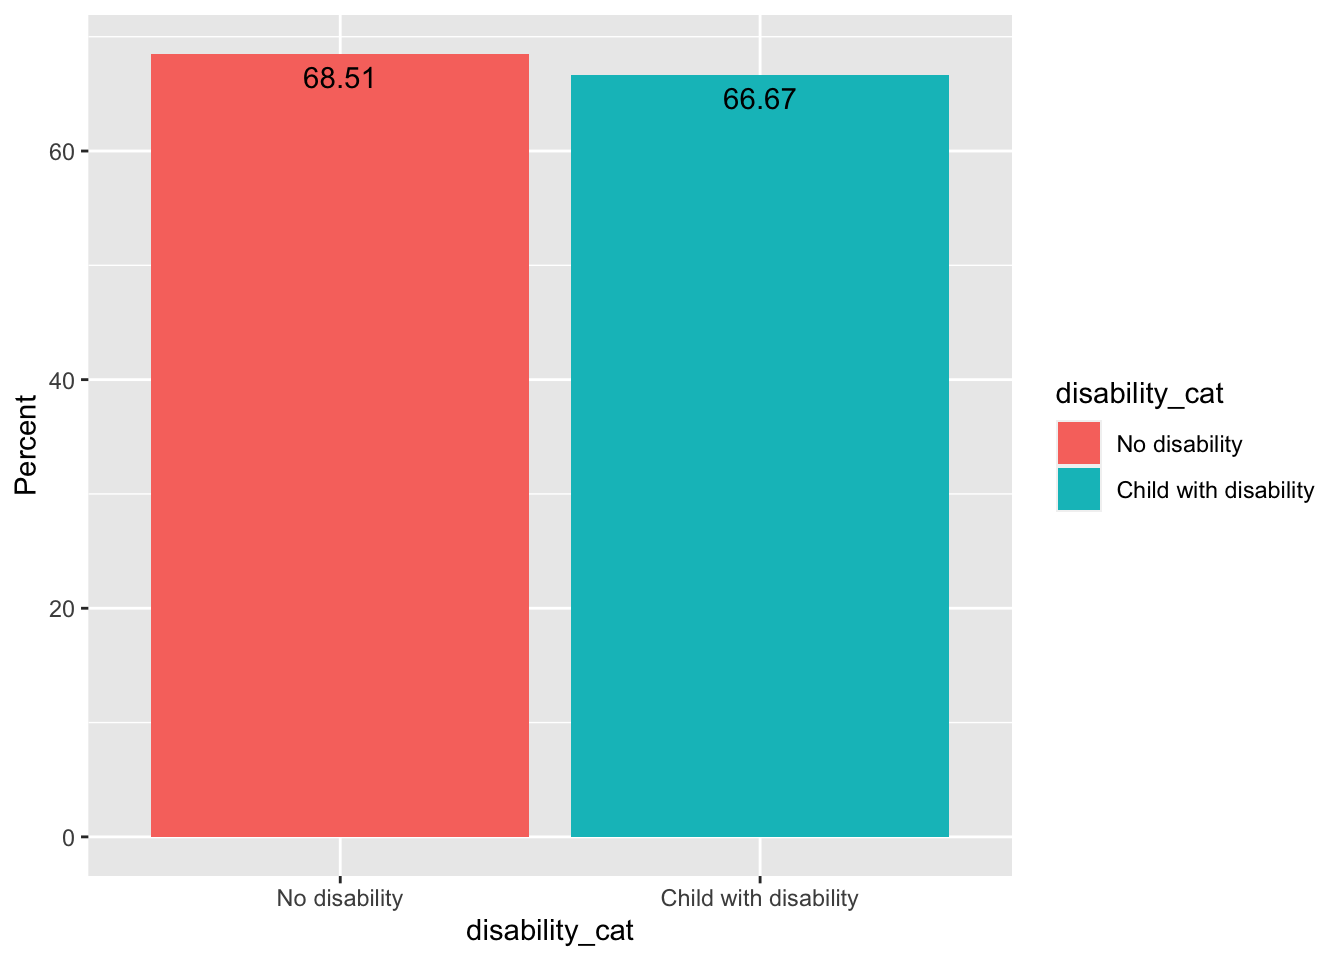
There were 66.67% of caregivers of children with disability and 68.51% of caregivers of children without disability currently experiencing challenges affording childcare. The differences across the two groups were not statistically significant.
## Number of cases in table: 187
## Number of factors: 2
## Test for independence of all factors:
## Chisq = 0.00912, df = 1, p-value = 0.9239
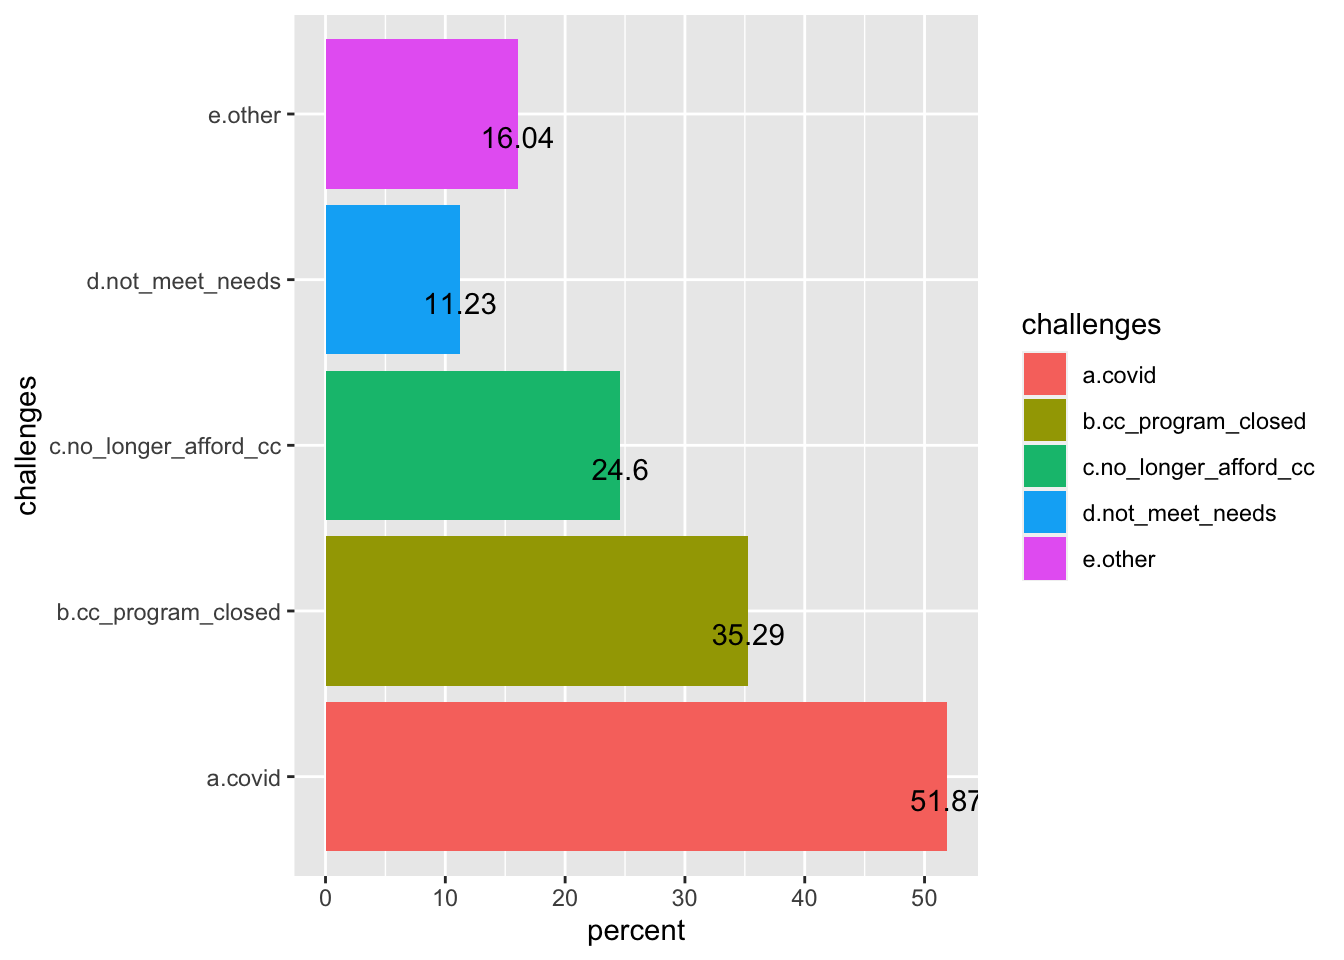
## Chi-squared approximation may be incorrectChallenges in Childcare that Caregivers are Facing
Among all the caregivers currently looking for childcare, the main challenges they face include:
1) can’t find a child care arrangement where they can be confident their child will not be exposed to COVID-19 (51.87%)
2) regular childcare program was closed (35.29%)
3) no longer be able to afford childcare (24.60%)
4) regular childcare program was open but no longer meet needs (11.23%)
5) other reasons.
Caregivers’ Perception About Government’s Actions to Support Childcare
Caregivers’ Reports on Whether the Government is Doing Enough to Support Childcare
Total Responses
There were 50.7% of caregivers thinking the government should do a lot more to support childcare; 23.44% reporting the government should do somewhat more, and only 8.20% of caregivers thinking the government has done enough to support childcare.
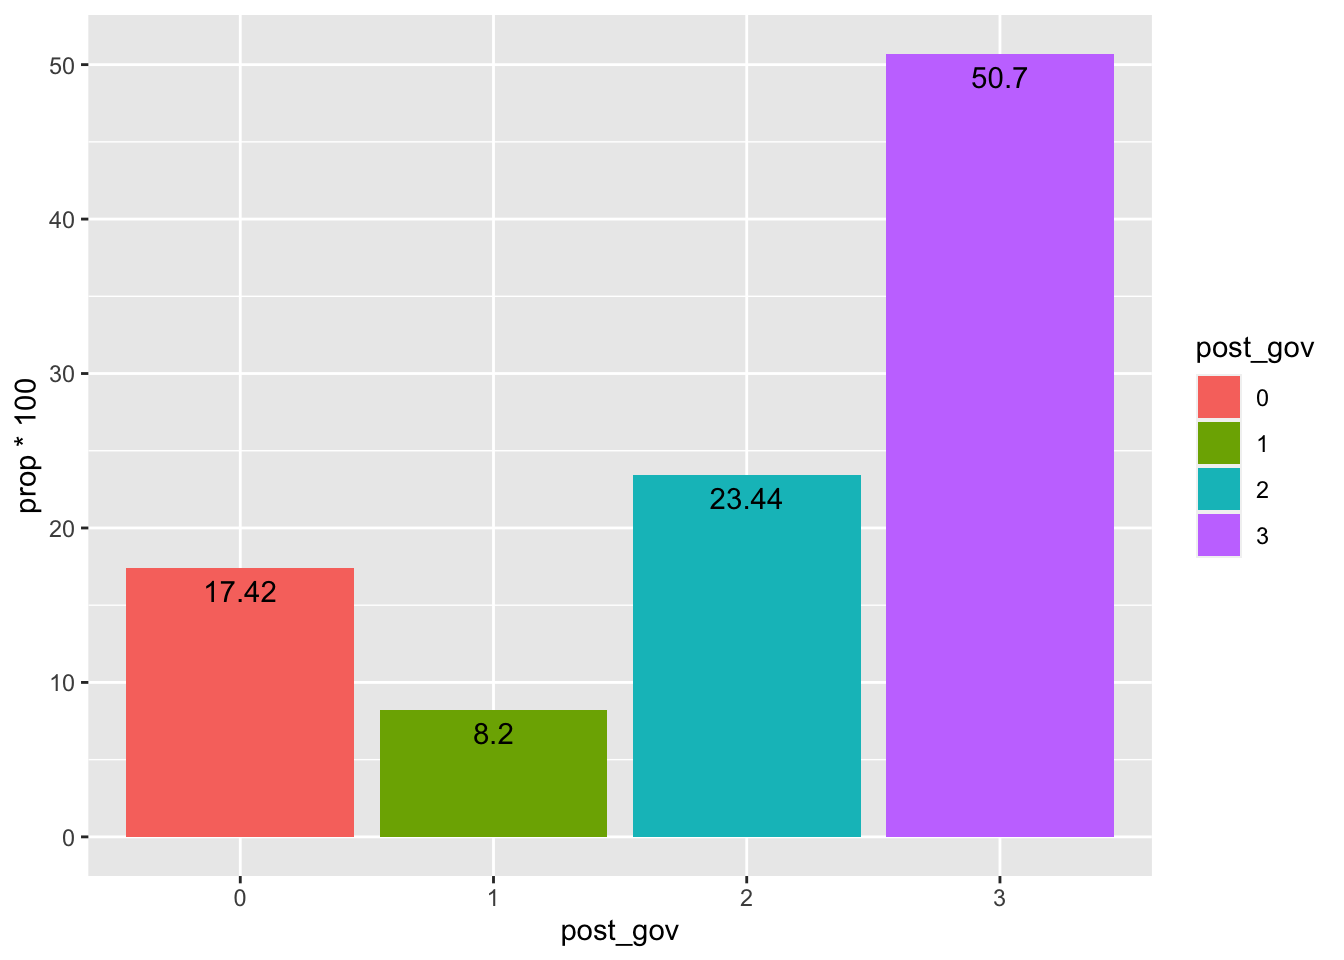
Note. 0 = not sure, 1 = doing enough, 2 = should do somewhat more, 3 = should do a lot more.
Comparison Across Race/Ethnicity Groups
The average satisfaction about government’s actions to support childcare in Black, Latinx, and White caregivers were 2.21, 2.02, and 2.08, respectively (with higher score indicating reduced satisfaction). ANOVA suggested that the differences across the three groups were not statistically significant.
## # A tibble: 4 x 2
##   race_ethnic post_gov_mn
##   <chr>             <dbl>
## 1 Black              2.21
## 2 Latinx             2.02
## 3 White              2.08
## 4 <NA>               1
## Analysis of Variance Table
##
## Response: post_gov
## Df Sum Sq Mean Sq F value Pr(>F)
## race_ethnic 2 2.55 1.2761 0.9937 0.3705
## Residuals 1273 1634.77 1.2842##
## Pairwise comparisons using t tests with pooled SD
##
## data: ccare_10$post_gov and ccare_10$race_ethnic
##
## Black Latinx
## Latinx 0.48 -
## White 0.52 0.52
##
## P value adjustment method: holmComparison Across Income Groups
The average satisfaction about government’s actions to support childcare in high- and low-income caregivers were 2.02 and 1.87, respectively (with higher score indicating reduced satisfaction). t test suggested that the differences across the two groups were not statistically significant.
##
##  Welch Two Sample t-test
##
## data:  ccare_10$post_gov by ccare_10$poverty_cat
## t = 0.85861, df = 124.3, p-value = 0.3922
## alternative hypothesis: true difference in means is not equal to 0
## 95 percent confidence interval:
##  -0.2034878  0.5153100
## sample estimates:
## mean in group High Income  mean in group Low Income
##                  2.021583                  1.865672
Comparison Across Single Parent Status
The average satisfaction about government’s actions to support childcare in single- and non-single caregivers were 2.28 and 2.06, respectively (with higher score indicating reduced satisfaction). t test suggested that the differences across the two groups were statistically significant (p < .05). Single parents were less satisfied with the government’s childcare actions.
##
##  Welch Two Sample t-test
##
## data:  ccare_10$post_gov by ccare_10$single_cat
## t = -2.3749, df = 173.93, p-value = 0.01864
## alternative hypothesis: true difference in means is not equal to 0
## 95 percent confidence interval:
##  -0.40837990 -0.03767832
## sample estimates:
##   mean in group Dual parent mean in group Single parent
##                    2.055166                    2.278195
Comparison Across Child Disability Status
The average satisfaction about government’s actions to support childcare in caregivers of children with and without disability were 1.73 and 2.08, respectively (with higher score indicating reduced satisfaction). t test suggested that the differences across the two groups were not statistically significant.
##
##  Welch Two Sample t-test
##
## data:  ccare_10$post_gov by ccare_10$disability_cat
## t = 1.3608, df = 25.773, p-value = 0.1853
## alternative hypothesis: true difference in means is not equal to 0
## 95 percent confidence interval:
##  -0.1805116  0.8868388
## sample estimates:
##         mean in group No disability mean in group Child with disability
##                            2.083933                            1.730769
Brightspots Caregivers Perceived in Government’s Actions to Support Childcare
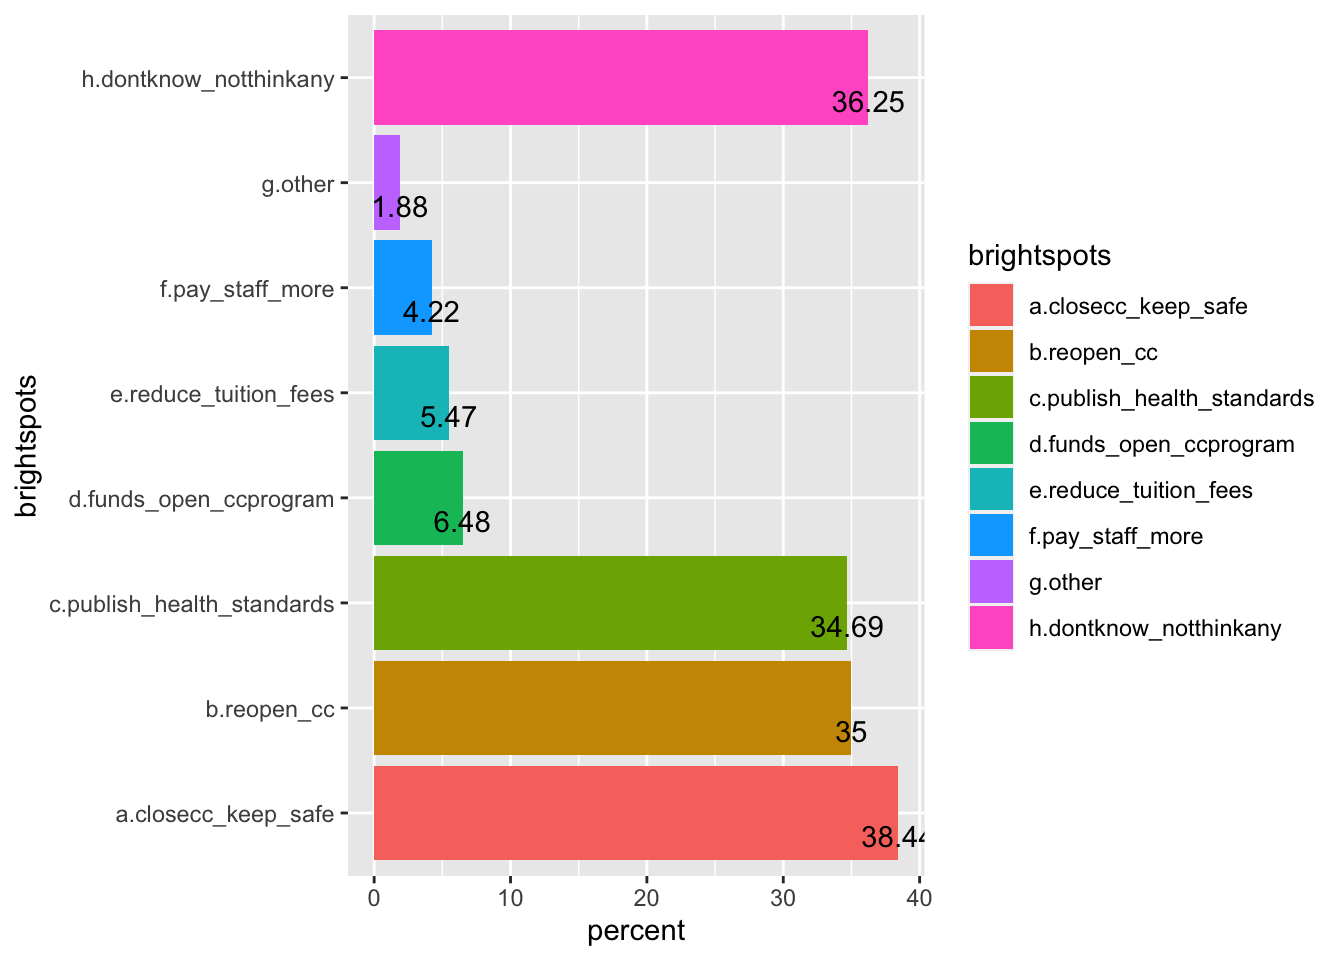
Some caregivers perceived the “bright spots” in government’s actions to support childcare as below:
1) Close childcare center to keep kids safe(38.44%)
2) Reopening childcare to allow essential workers and others go to work (35.00%)
3) Publish health standards to keep kids safe (34.69%)
Only few caregivers perceived government’s actions in providing funds to keep childcare open, paying staff more, reducing or eliminating tuition and fees to make childcare more affordable as bright spots.
Additionally, 36.25% of caregivers responded “don’t know/can’t think of any bright spots”.
Caregivers’ Perception on What are Still Needed to Address Current Concerns in Childcare
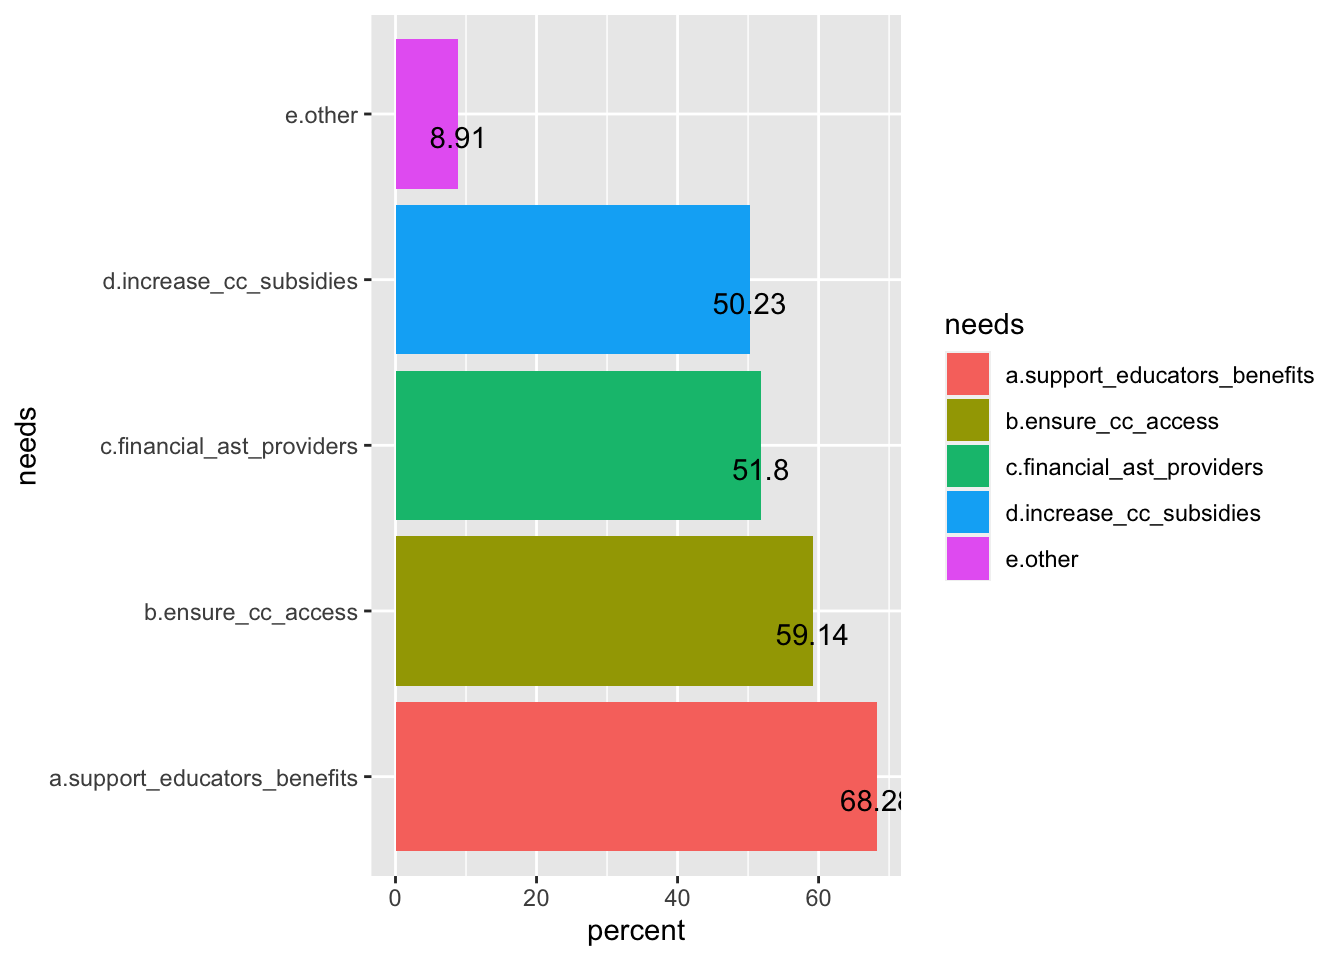
Caregivers reported that actions by government below were still needed to support childcare and address current concerns:
1) Support the well-being of early childhood educators by ensuring that they have sufficient compensation and benefits (68.28%)
2) Ensure more parents have access to child care by making more parents eligible for child care subsidies/assistance (59.14%)
3) Stabilize and maintain the supply of child care programs by providing financial assistance to providers (51.80%)
4) Increasing the amount of child care subsidies do parents don’t have to pay as much (50.23%)
What Would Make Caregivers Feel They Have a Better Childcare Plan for Next Month
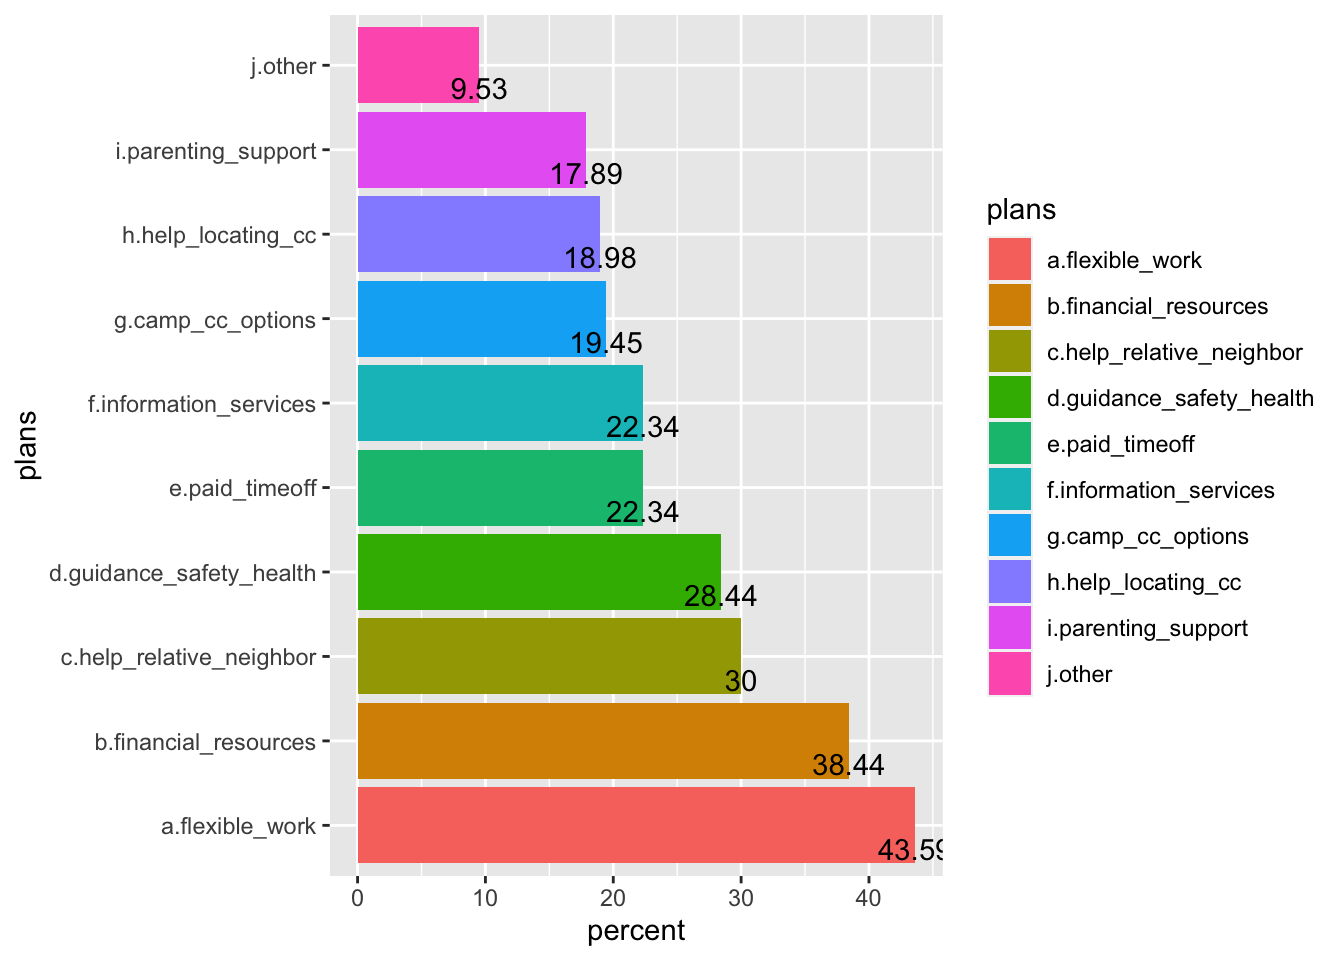
Caregivers reported that below actions will make them feel that they have a better childcare plan for next month:
1) Flexible work arrangement (43.59%)
2) Financial resources for child care or other expenses (38.44%)
3) Help from relatives and neighbors (30.00%)
4) More guidance on children’s health & safety in child care or camp (28.44%)
5) Paid timeoff from employer (22.34%)
5) More information or services from your local school system or government (22.34%)
6) Camp or child care options from your local school system or government (19.45%)
7) Help locating available child care (18.98%)
8) Parent support groups or parenting resources (17.89%)
What Caregivers Consider as Affordable Childcare for All Their Children
Majority of caregivers reported that childcare expenses accounting for 10%-20% of household income (36.8%) or 5-9% of household income (36.25%) as affordable childcare.
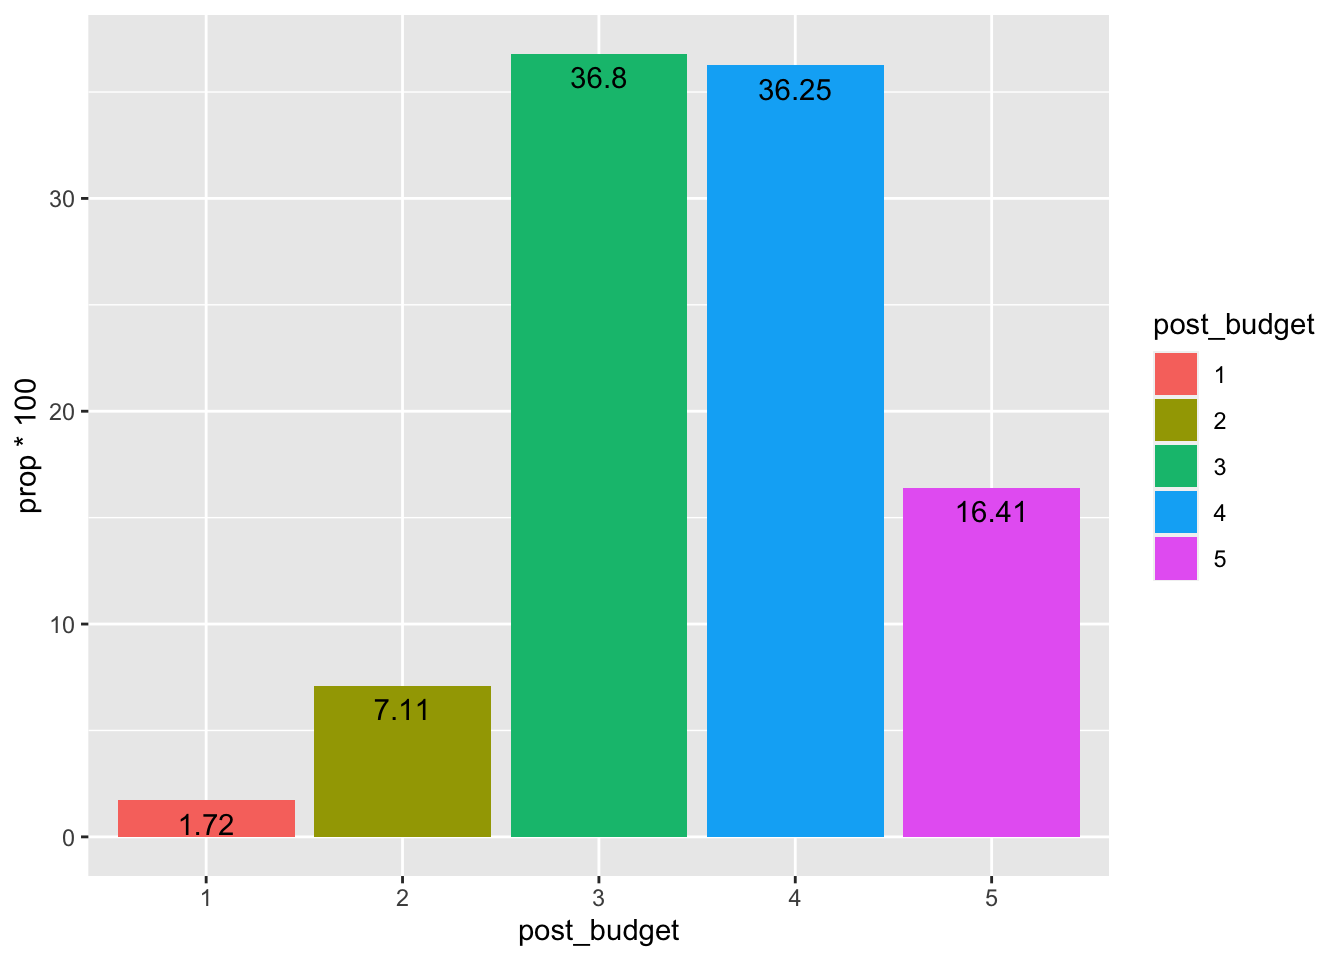
Note. 1 = >30% of household income, 2 = 20%-30% of household income, 3 = 10%-20% of household income, 4 = 5-9% of household income, 5 = 1-4% of household income.