Childcare Variables Descriptives
Sihong
10/2/2020
Methods Families Chose for Childcare
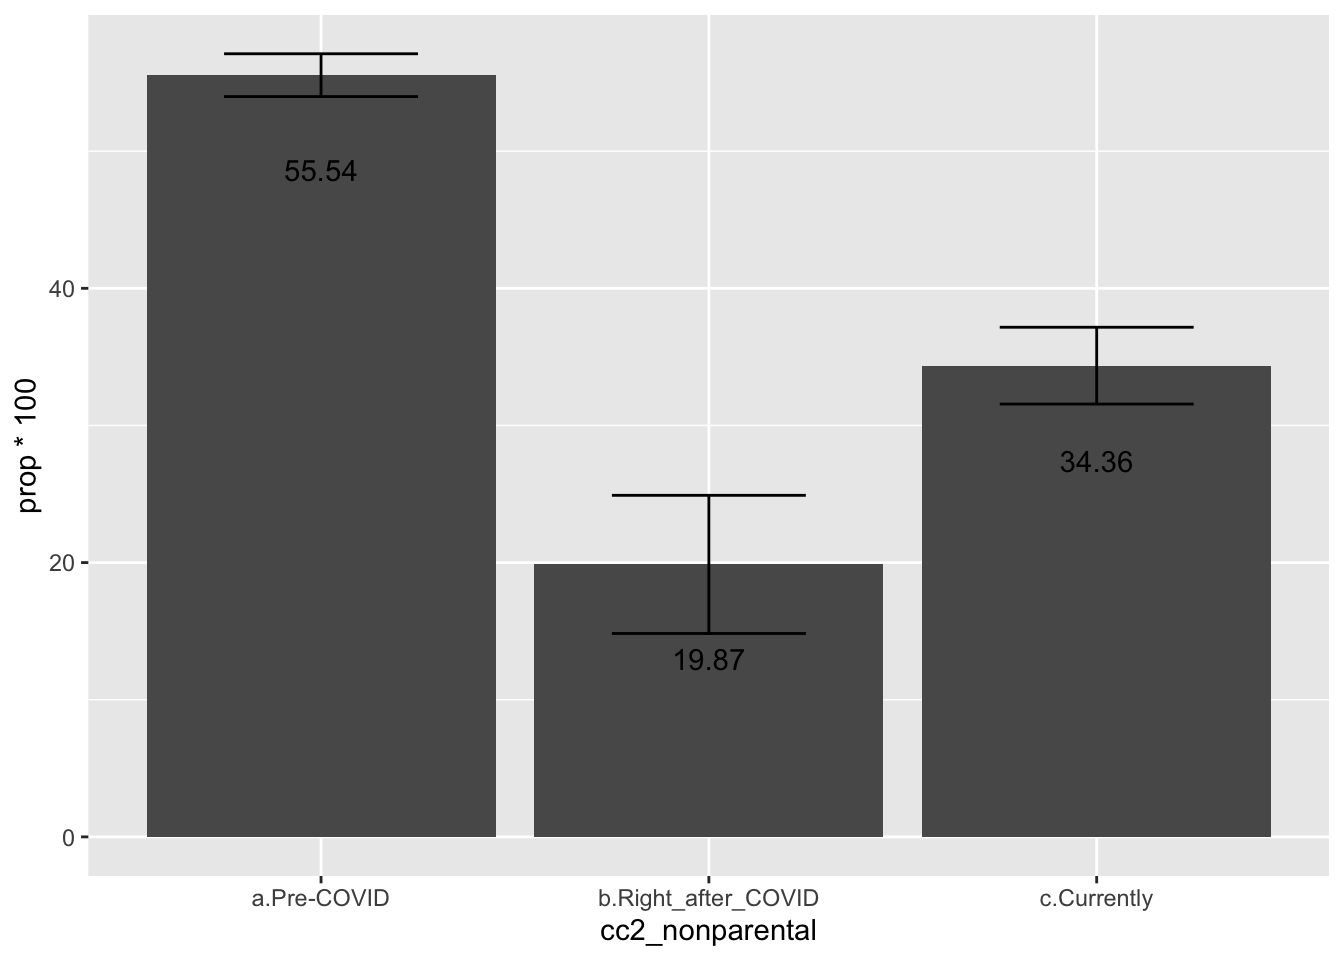
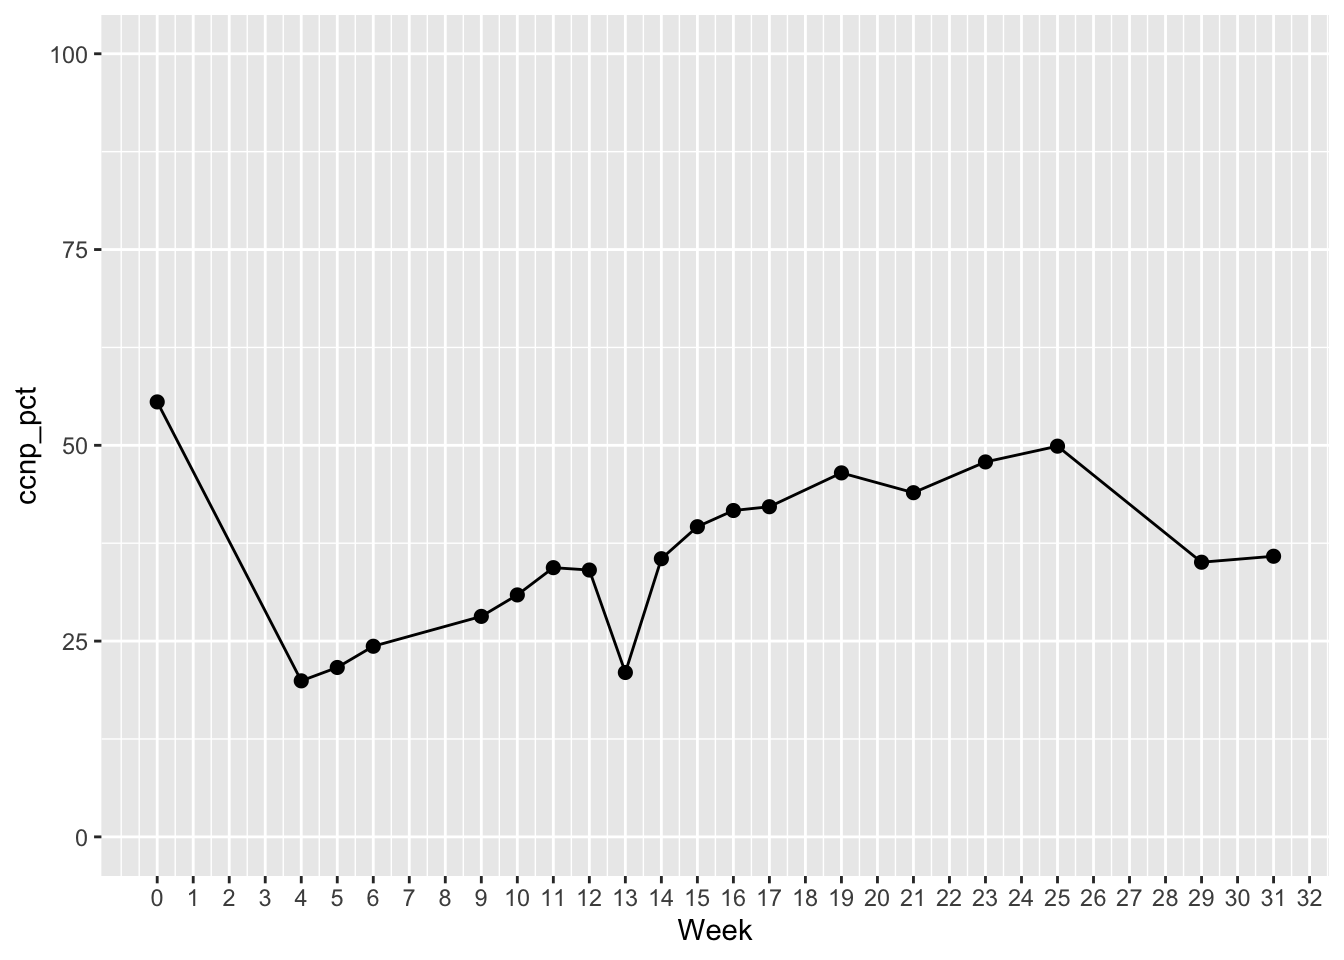
Percentage of Non-Parental Childcare
*Note. 1. Data of weeks 17 & 18, 19 & 20, 21 & 22, and 23 & 24 were merged to increase sample size and reduce the fluctuation 2. Data on this question were not collected on weeks 1, 2, 3, 7, 8.
Total Responses
Results showed that before COVID-19, 55.54% of caregivers uses some type of non-parental childcare. This rate dropped to 21.61% right after COVID-19 (May of 2020, selected caregivers’ earliest responses during Week 4, 5, 6) and then increased back to 38.84% for current respondents (i.e., caregivers’ latest responses that are later than Week 6). All three bars were statistically different from each other.
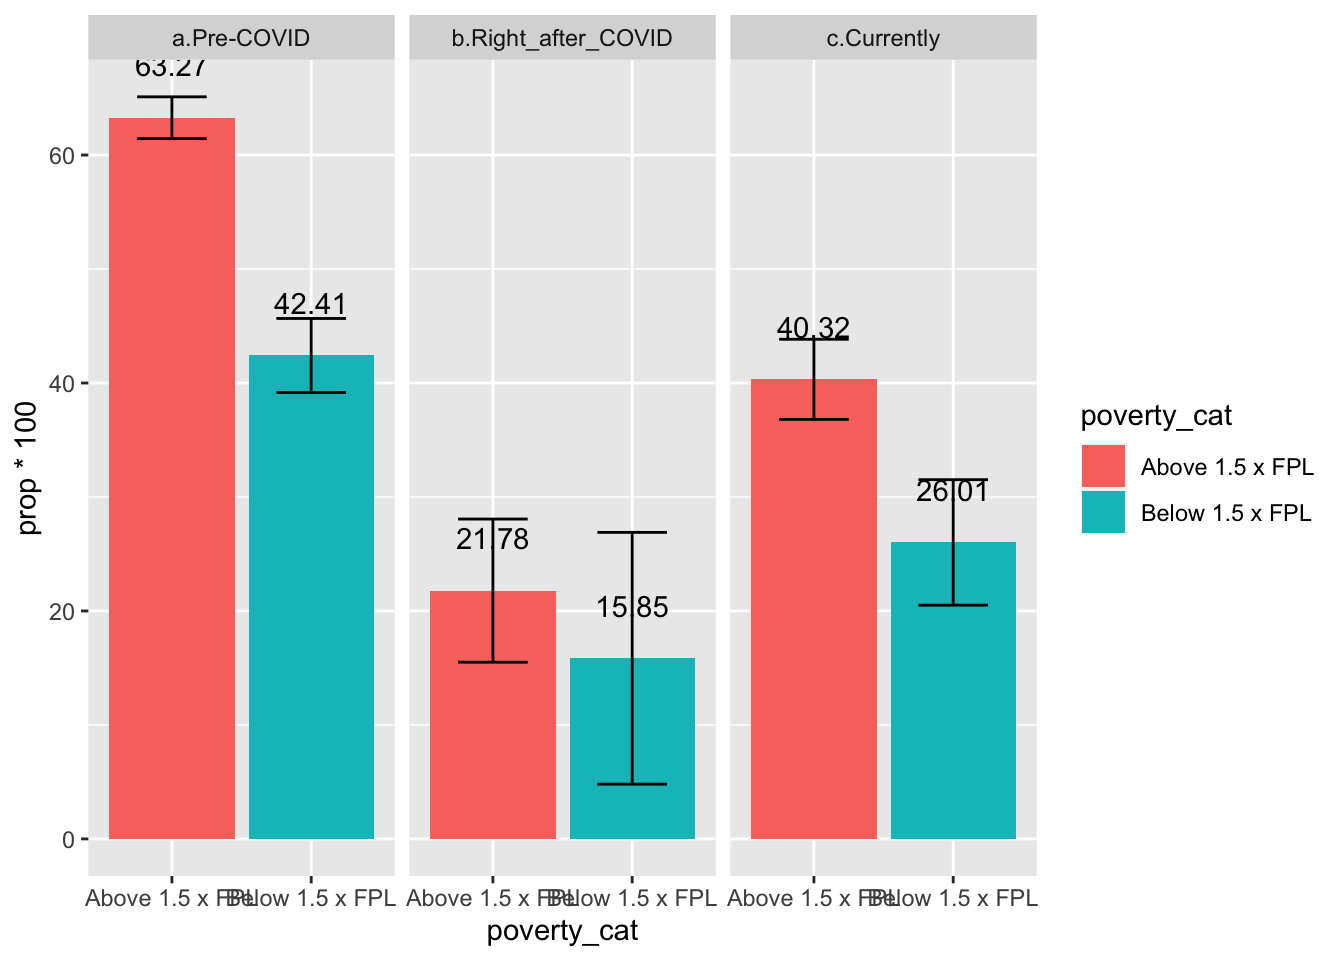
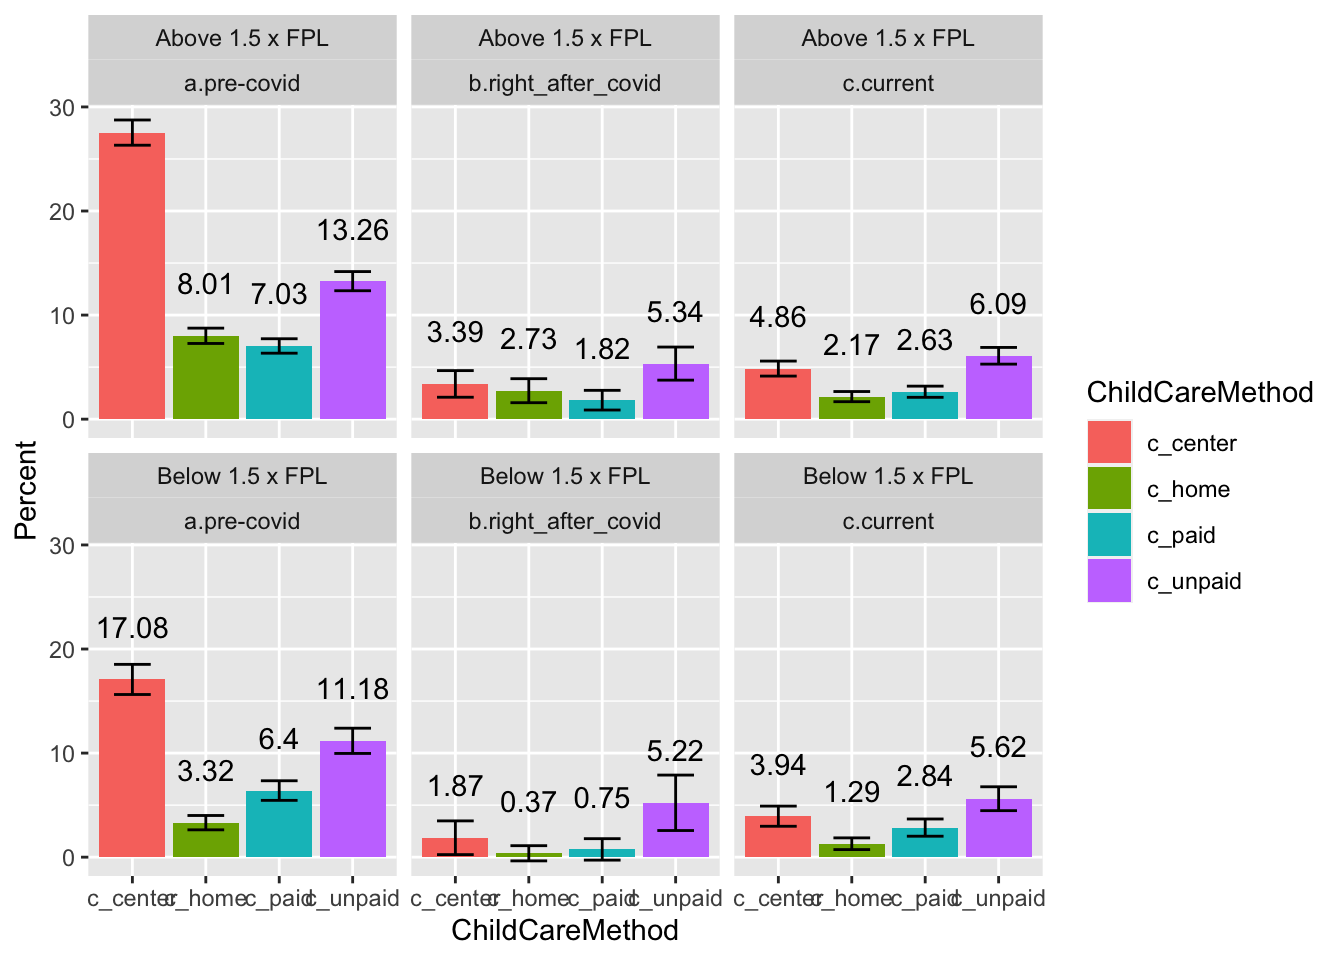
by Income
- Findings description: Results showed that for both low- and high-income families, the percentage of using nonparental childcare dropped from pre- to right after COVID19, and then increased overtime recently. during all three time-points, high-income families used more nonparental childcare than low-income families.
- Statistical test results:
- During all three different time-points, the differences across high- and low-income groups were statistically significant.
- For both groups, the differences between any two time-points were also all statistically significant.
- During all three different time-points, the differences across high- and low-income groups were statistically significant.
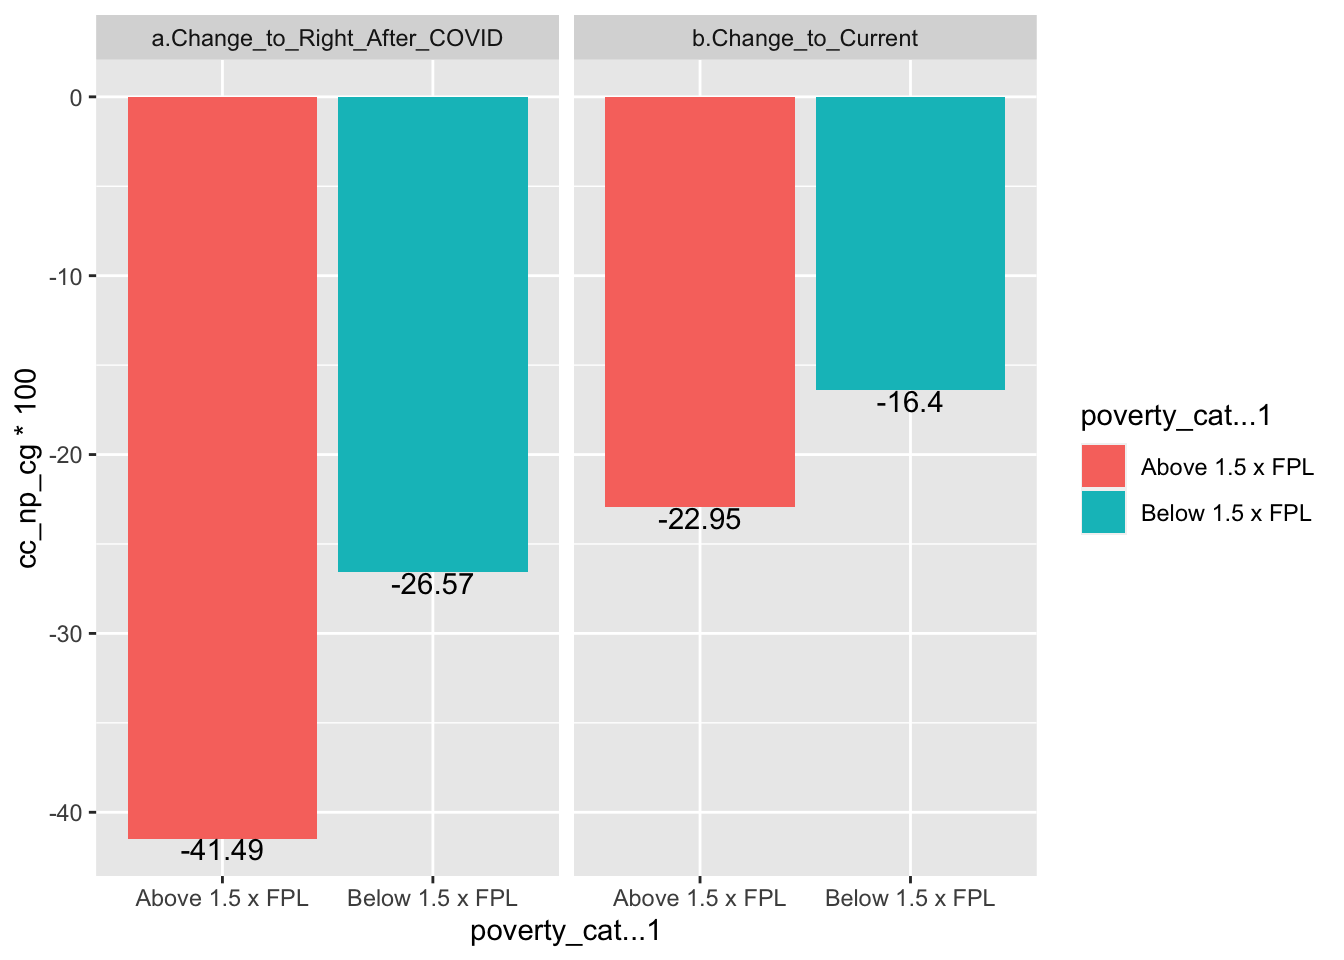
Changes from Pre- to Right after COVID & Current - Breakdown by Income
by Race/Ethnicity
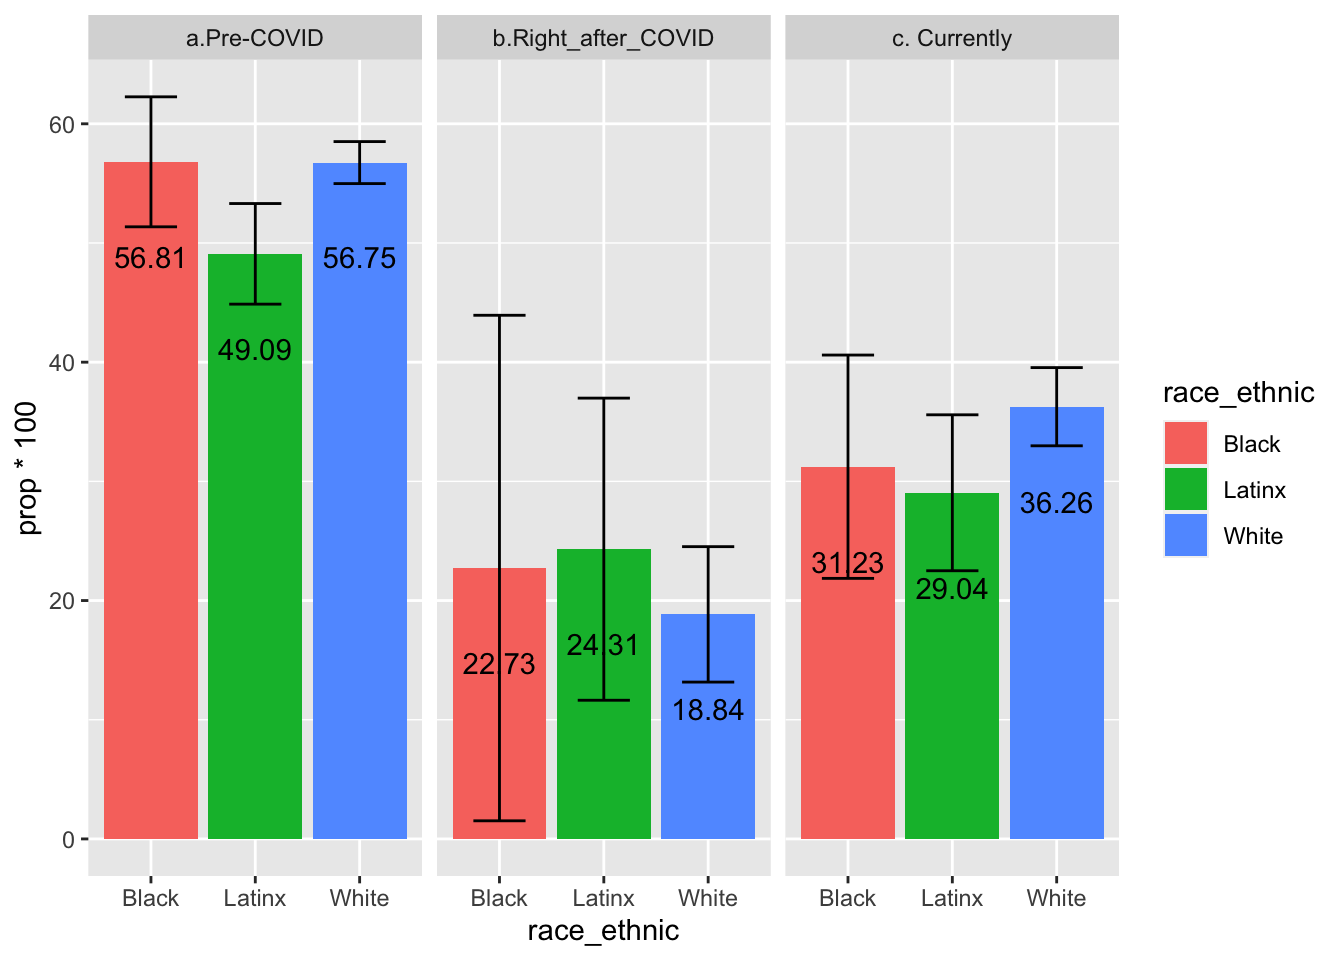
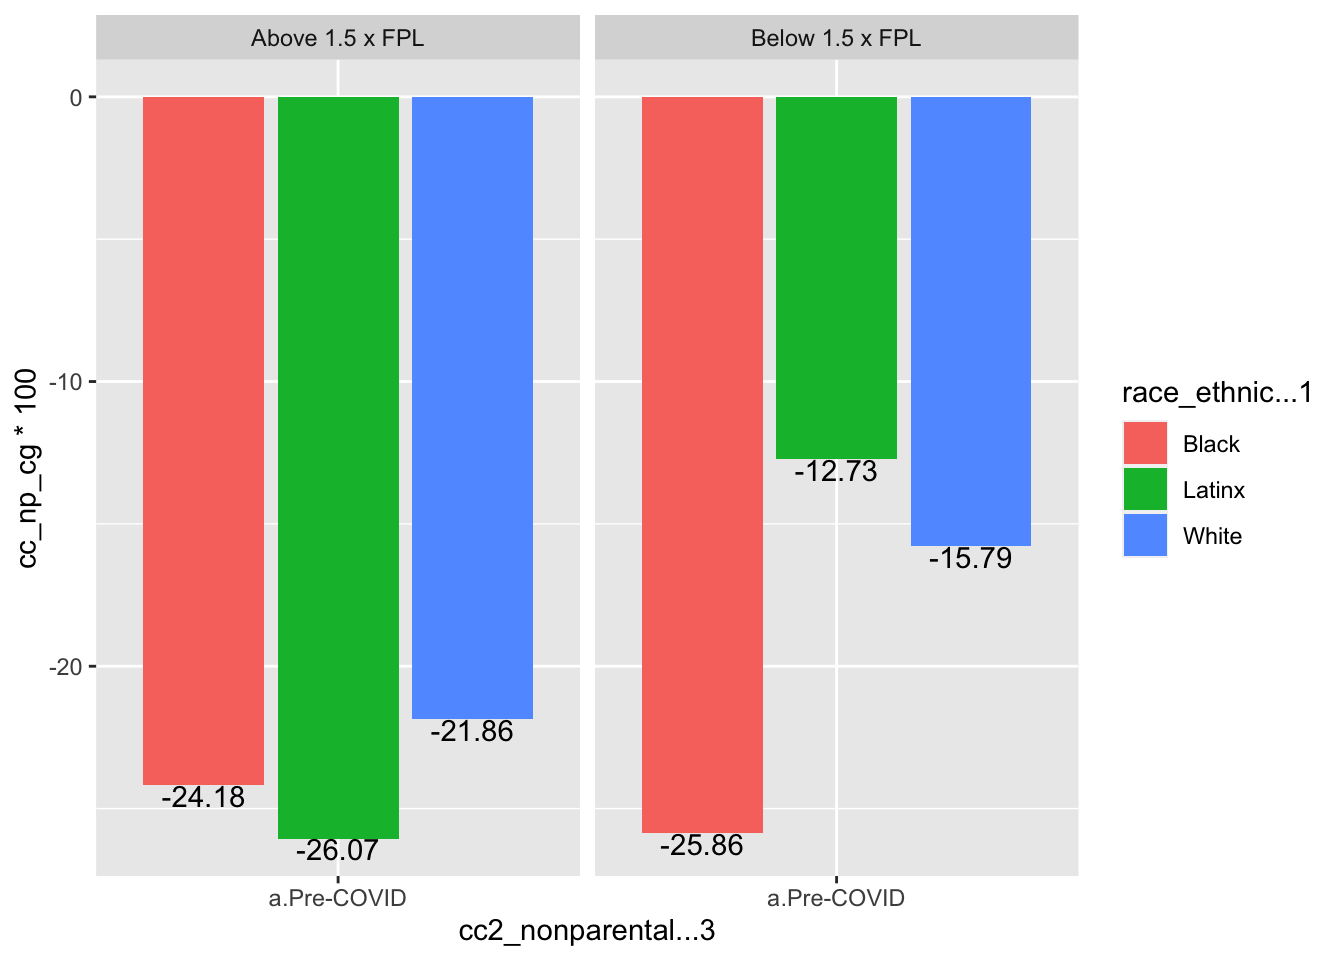
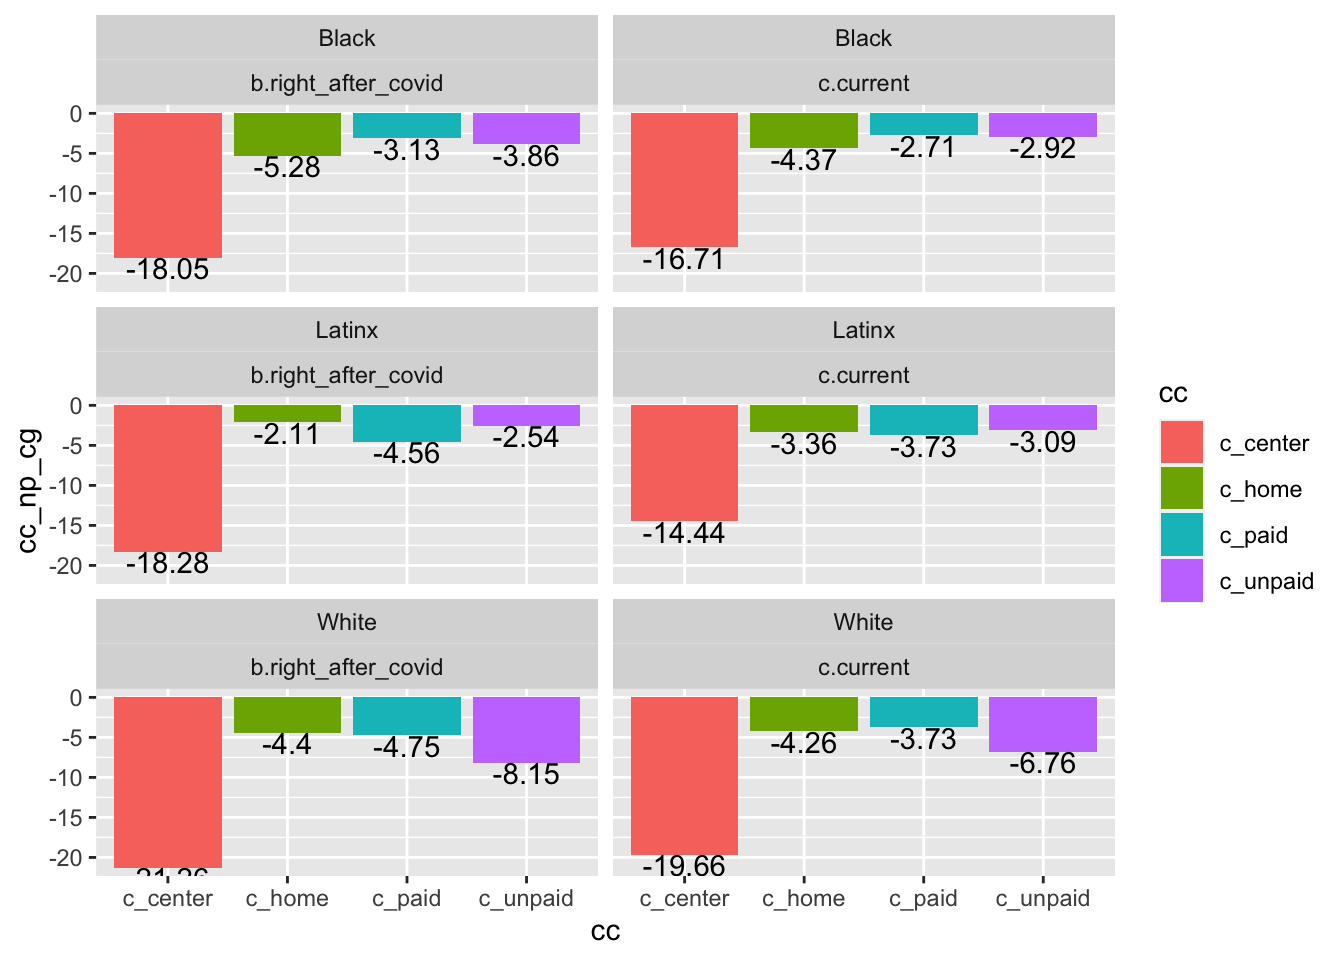
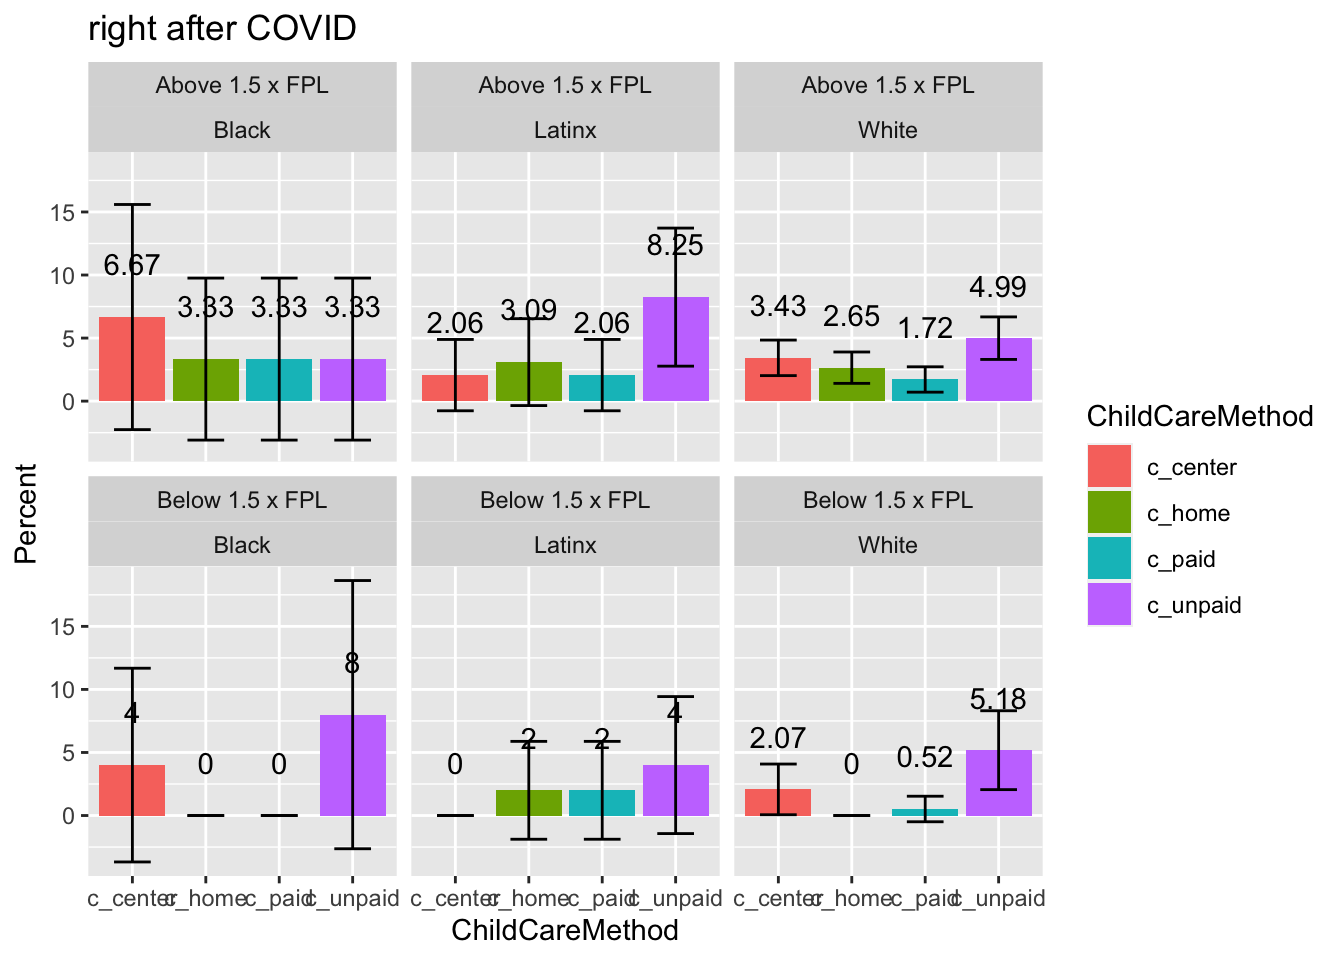
- Findings description: Results showed that for White, Black, and Latinx families, the percentage of using nonparental childcare dropped from pre- to right after COVID19, and then increased overtime recently. during all three time-points, latinx families used the lest nonparental childcare compared to Black and White families.
- Statistical test results:
- Pre-COVID: significant differences between White & Latinx, and Black & Latinx families
- Right after COVID: no significant differences across three race/ethnicity groups
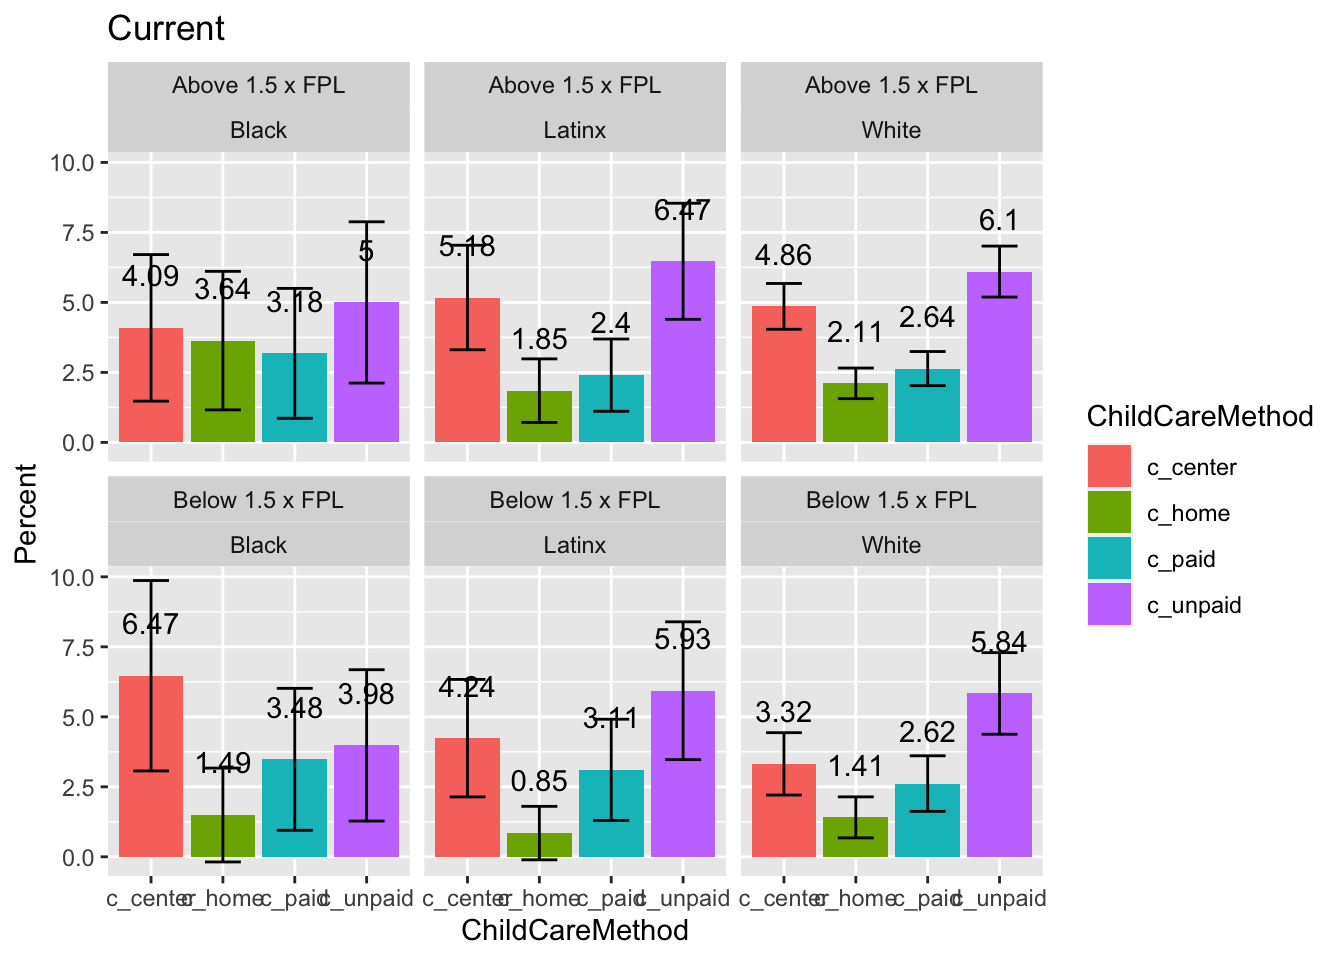
- Current: significant differences between Latinx & White families, marginally significant differences between Black & White families, no significant difference between Black & Latinx families
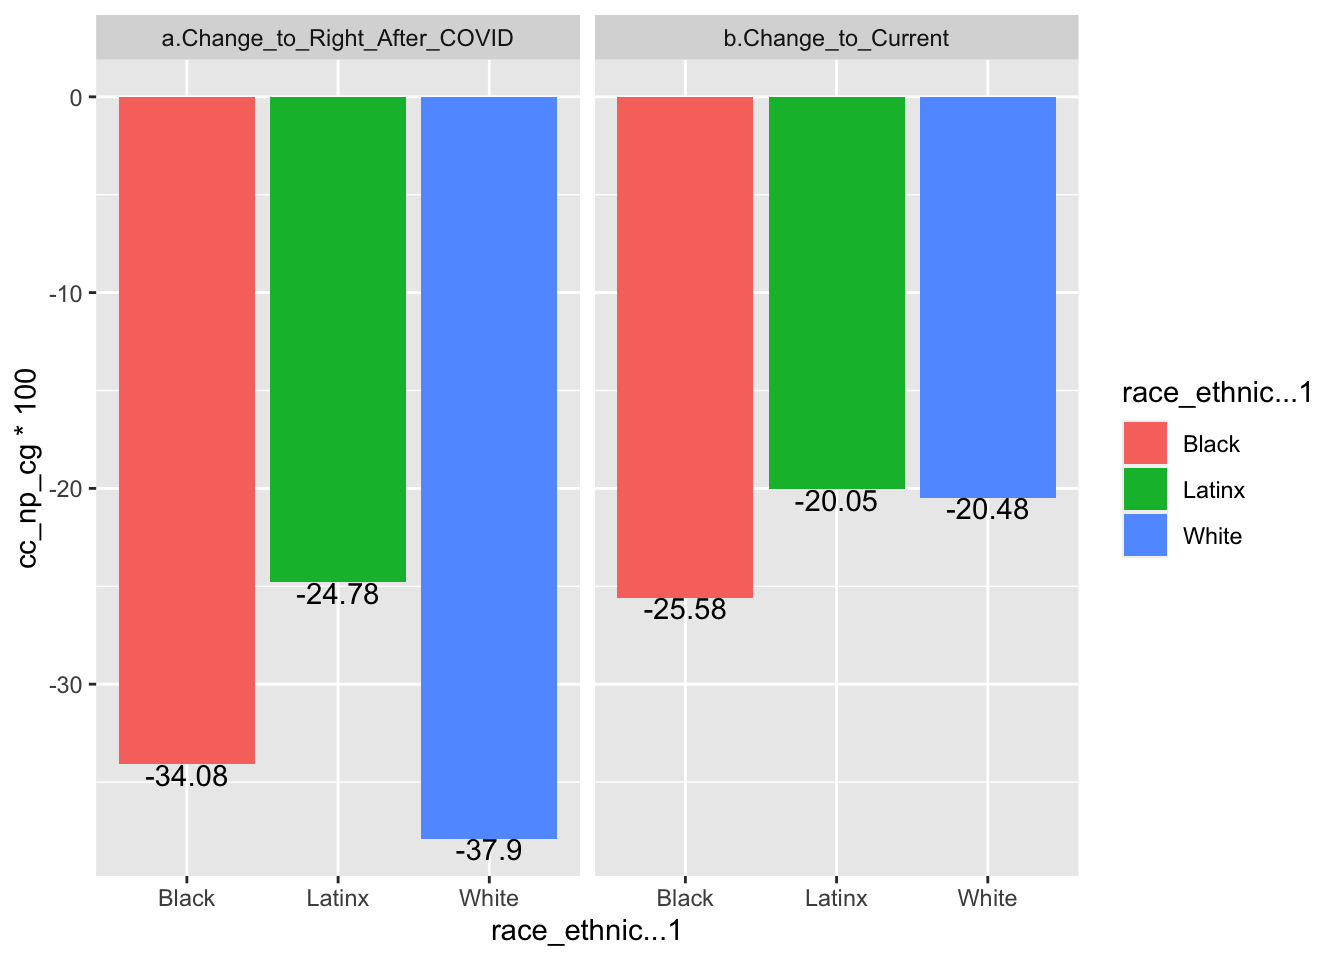
- Changes from pre- to right after COVID: significant decreases for all three race/ethnicity groups
- Changes from pre-COVID to current: significant decreases for all three race/ethnicity groups
- Changes from right-after COVID to current: significant increases only among White families
- Pre-COVID: significant differences between White & Latinx, and Black & Latinx families
Changes from Pre- to Right after COVID & Current - Breakdown by Race/Ethnicity
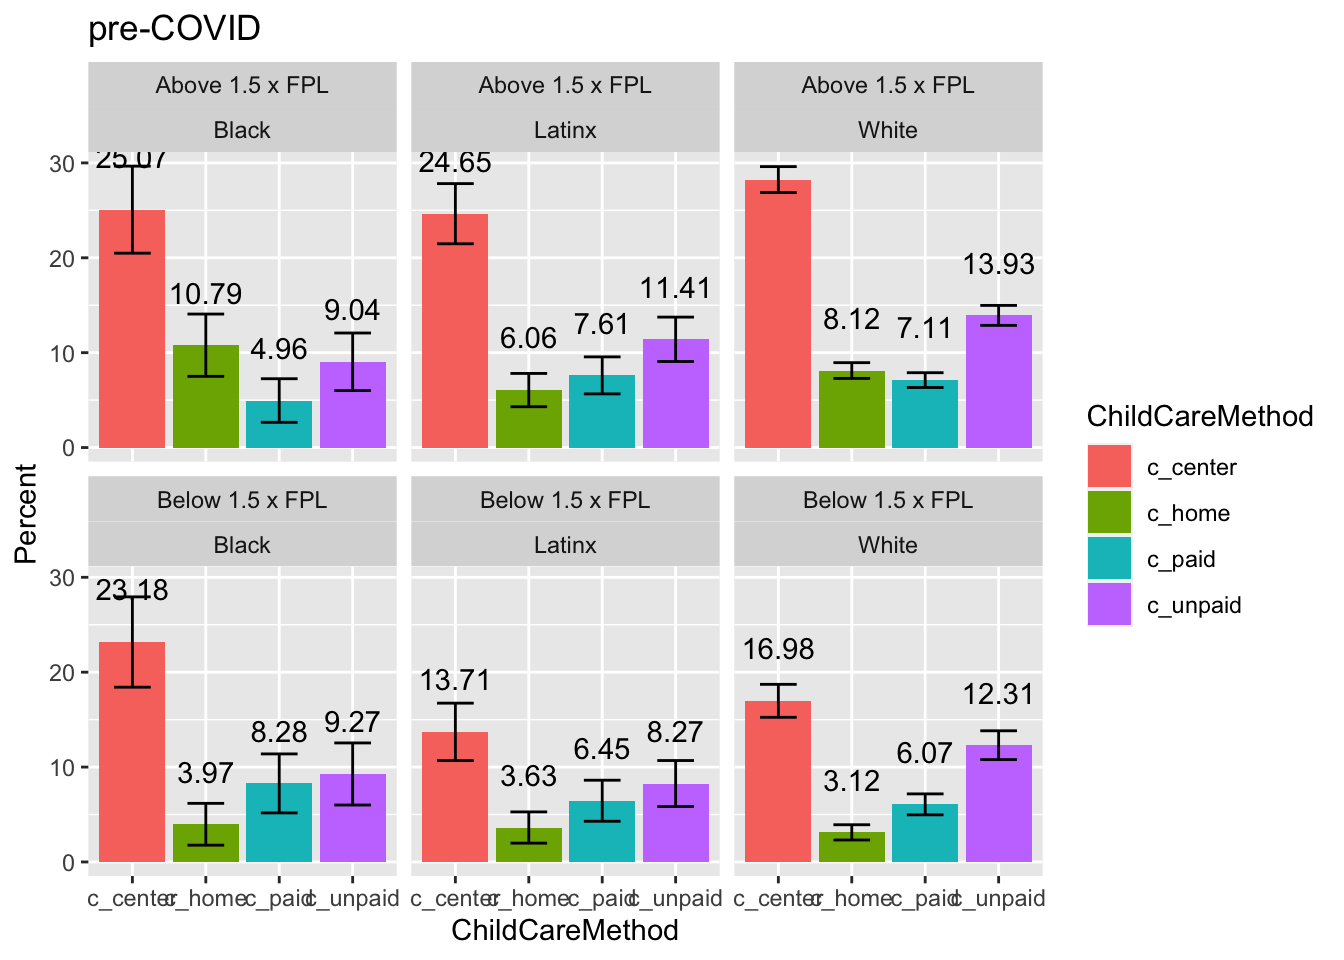
by Race/Ethnicity and Income
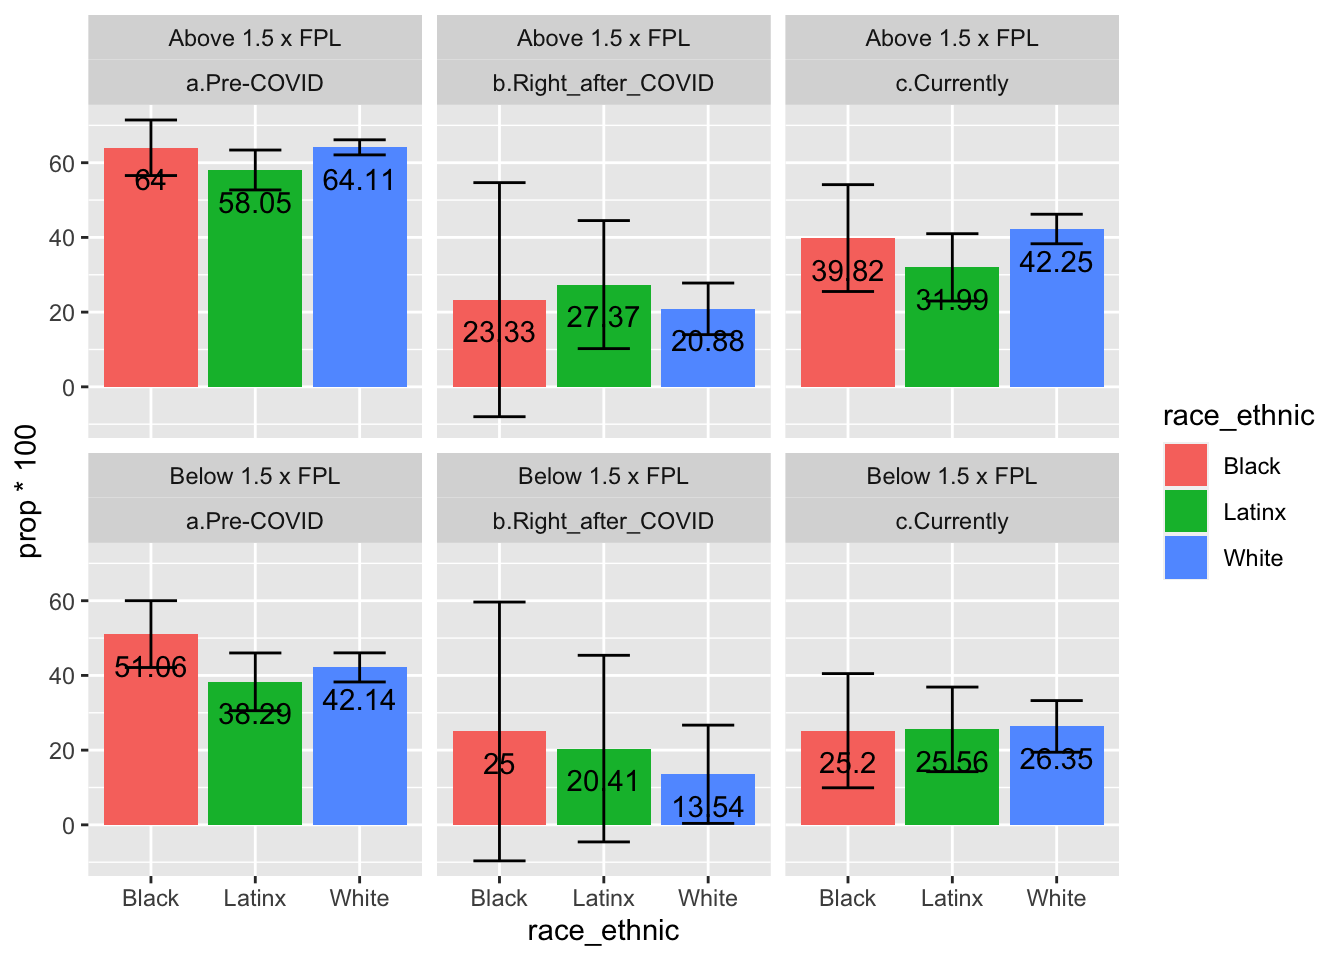
- Findings description: Results showed that
- For low-income and high-income White, Black, and Latinx families, the percentage of using nonparental childcare dropped from pre- to right after COVID19, and then increased overtime recently.
- For all three race/ethnicity groups, high-income families used more nonparental childcare than kow-income families.
- For low-income and high-income White, Black, and Latinx families, the percentage of using nonparental childcare dropped from pre- to right after COVID19, and then increased overtime recently.
- Statistical test results:
- Pre-COVID: Among high-income families, significant difference between White & Latinx families; Among low-income families, significant differences between Black & Latinx families; When comparing income levels, significant differences by poverty level among White and Latinx families
- Right after COVID: no statistically significant differences across race/ethnicity groups; no statistically significant differences across different poverty-level groups
- Current: Among high-income families, significant differences between Latinx & White families; Among low-income families, no significant differences by race/ethnicity; When comparing income levels, significant differences by poverty level only among Latinx families
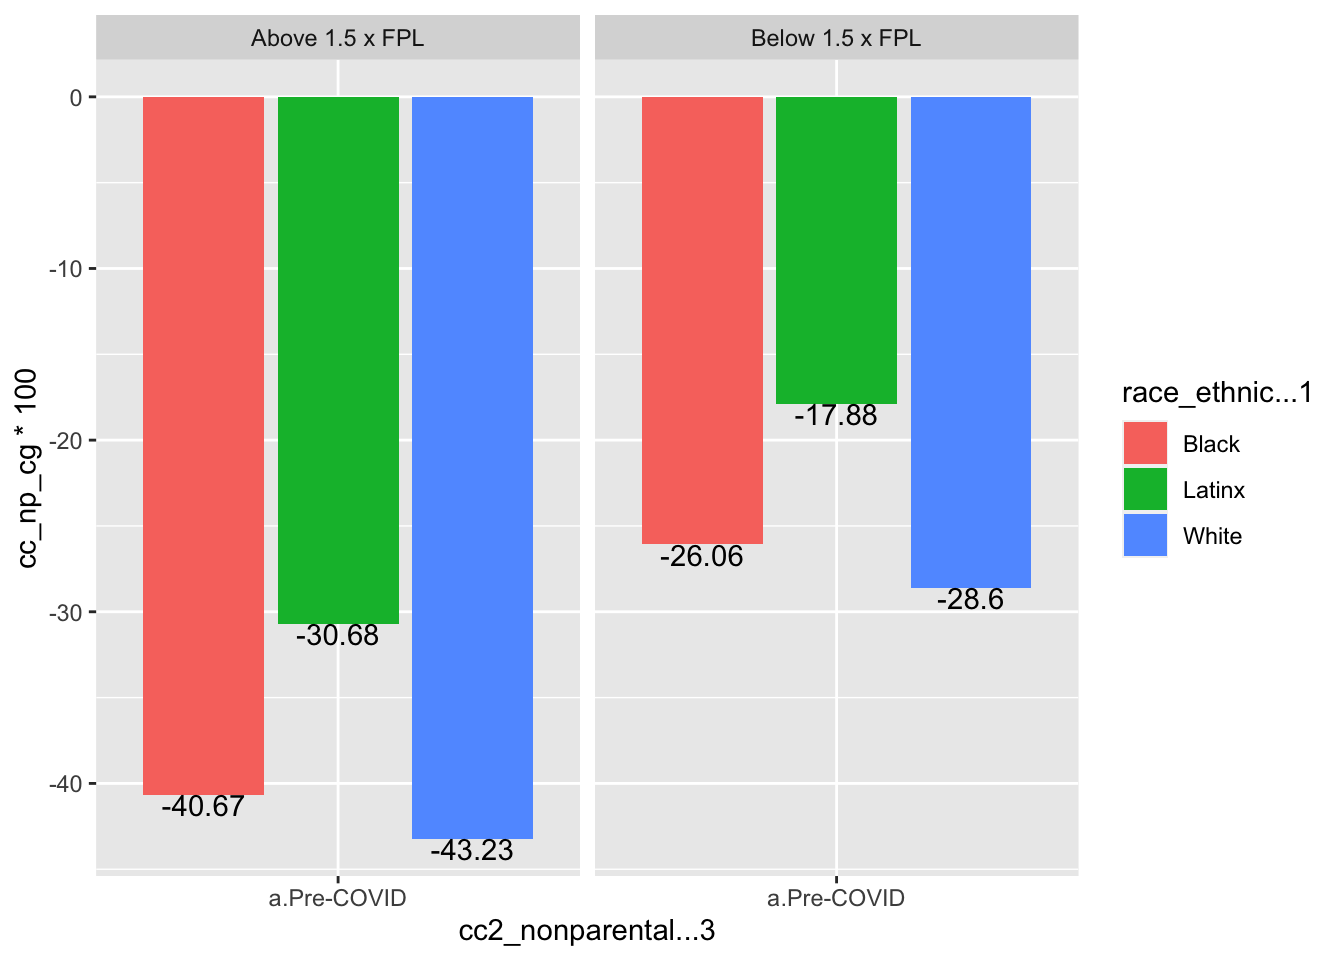
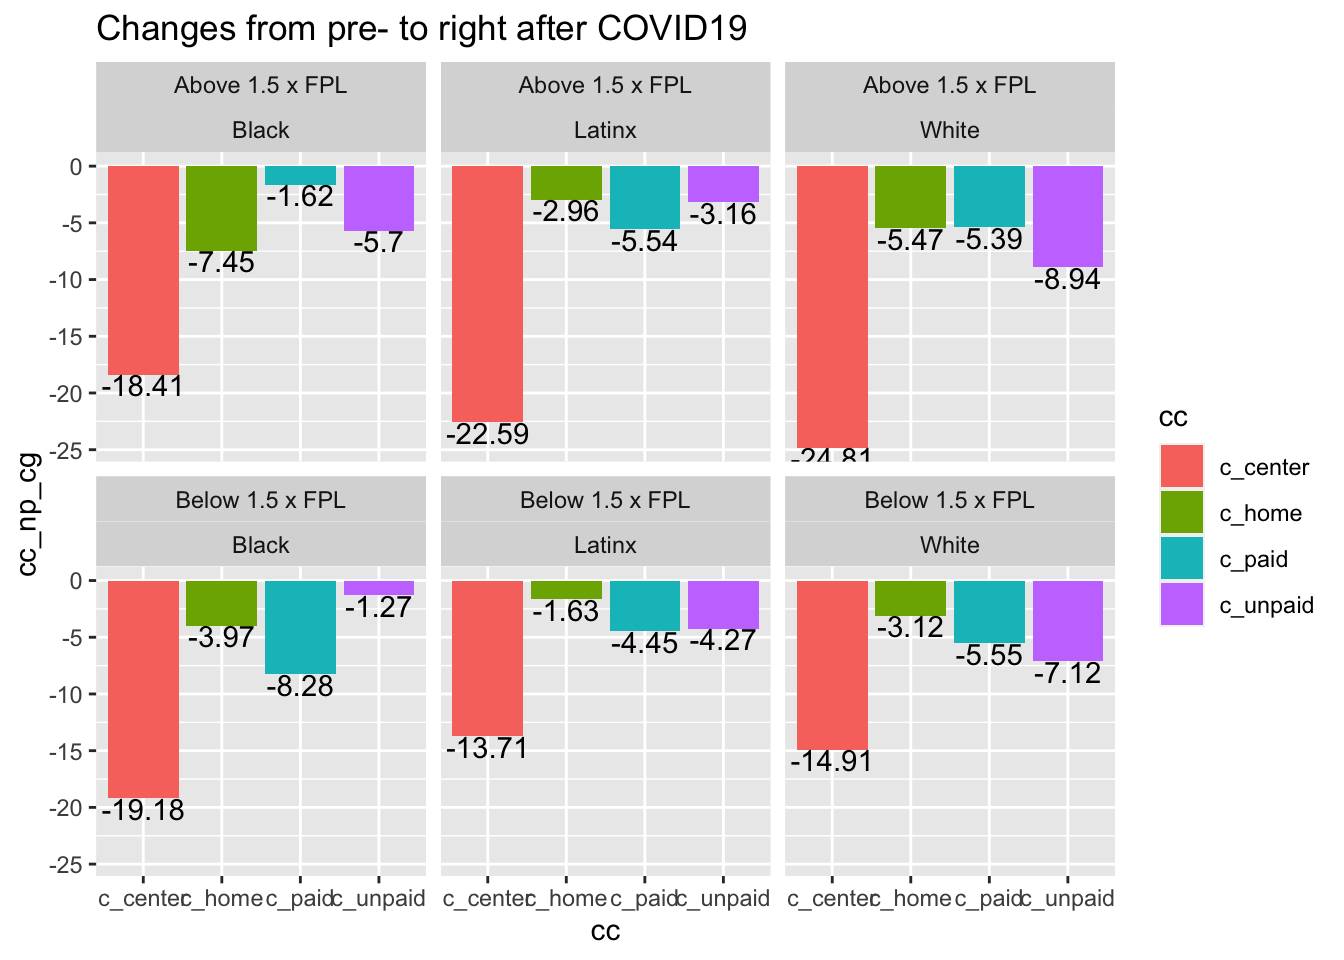
- Changes from pre- to right after COVID: among both high- and low-income families, significant decreases for all three race/ethnicity groups
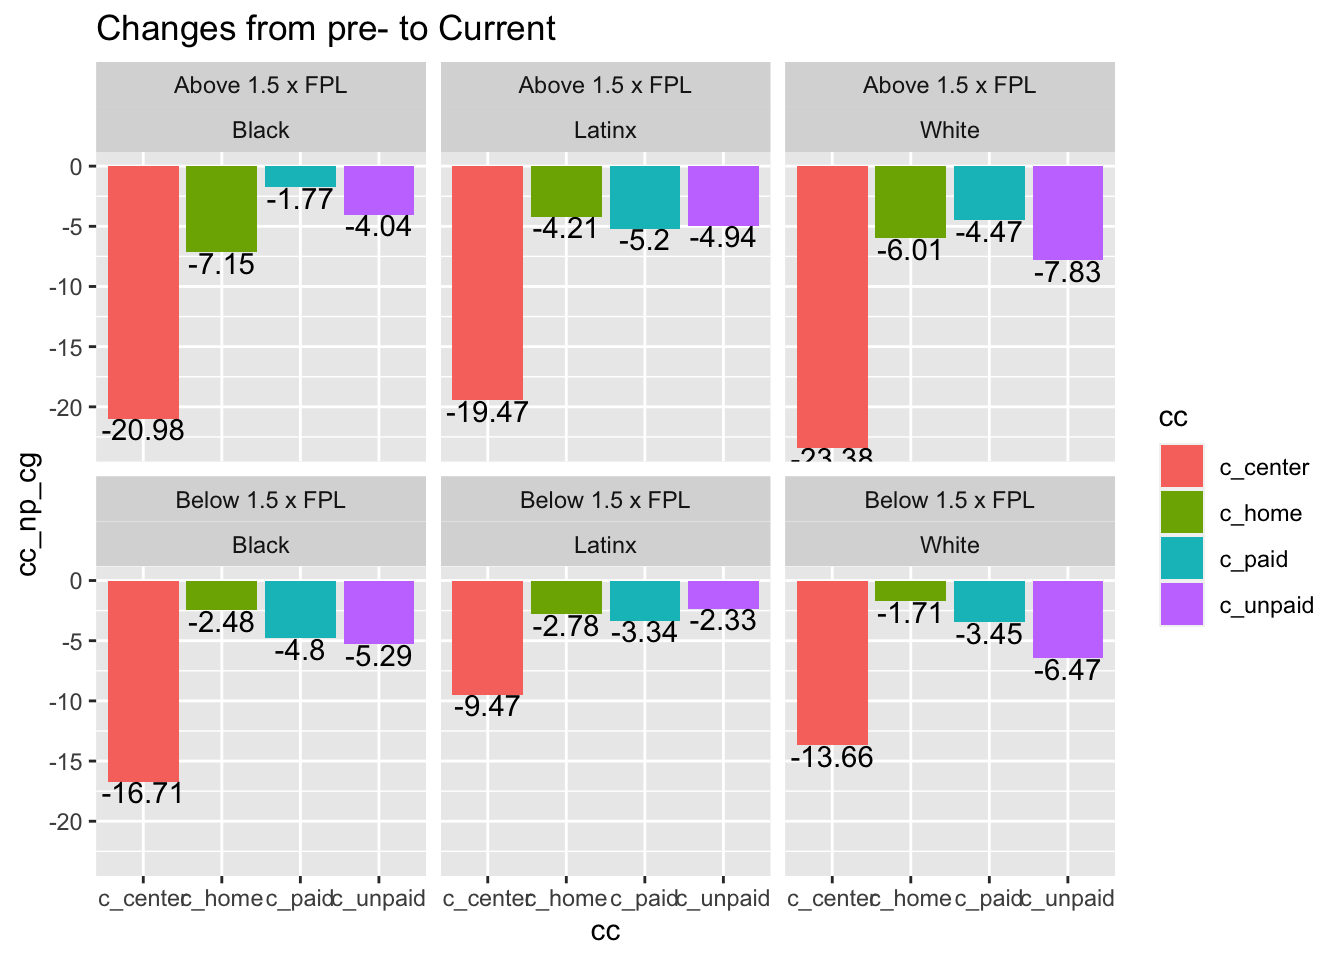
- Changes from pre-COVID to current: among both high- and low-income families, significant decreases for all three race/ethnicity groups
- Changes from right-after COVID to current: among high-income families, significant increases in nonparental childcare use only among White families; among low-income families, marginally significant increases in nonparental childcare use only among White families.
- Pre-COVID: Among high-income families, significant difference between White & Latinx families; Among low-income families, significant differences between Black & Latinx families; When comparing income levels, significant differences by poverty level among White and Latinx families
Changes from Pre- to Right after COVID - Breakdown by Race/Ethnicity & Income
Changes from Pre-COVID to Current - Breakdown by Race/Ethnicity & Income
by Single Parent Status
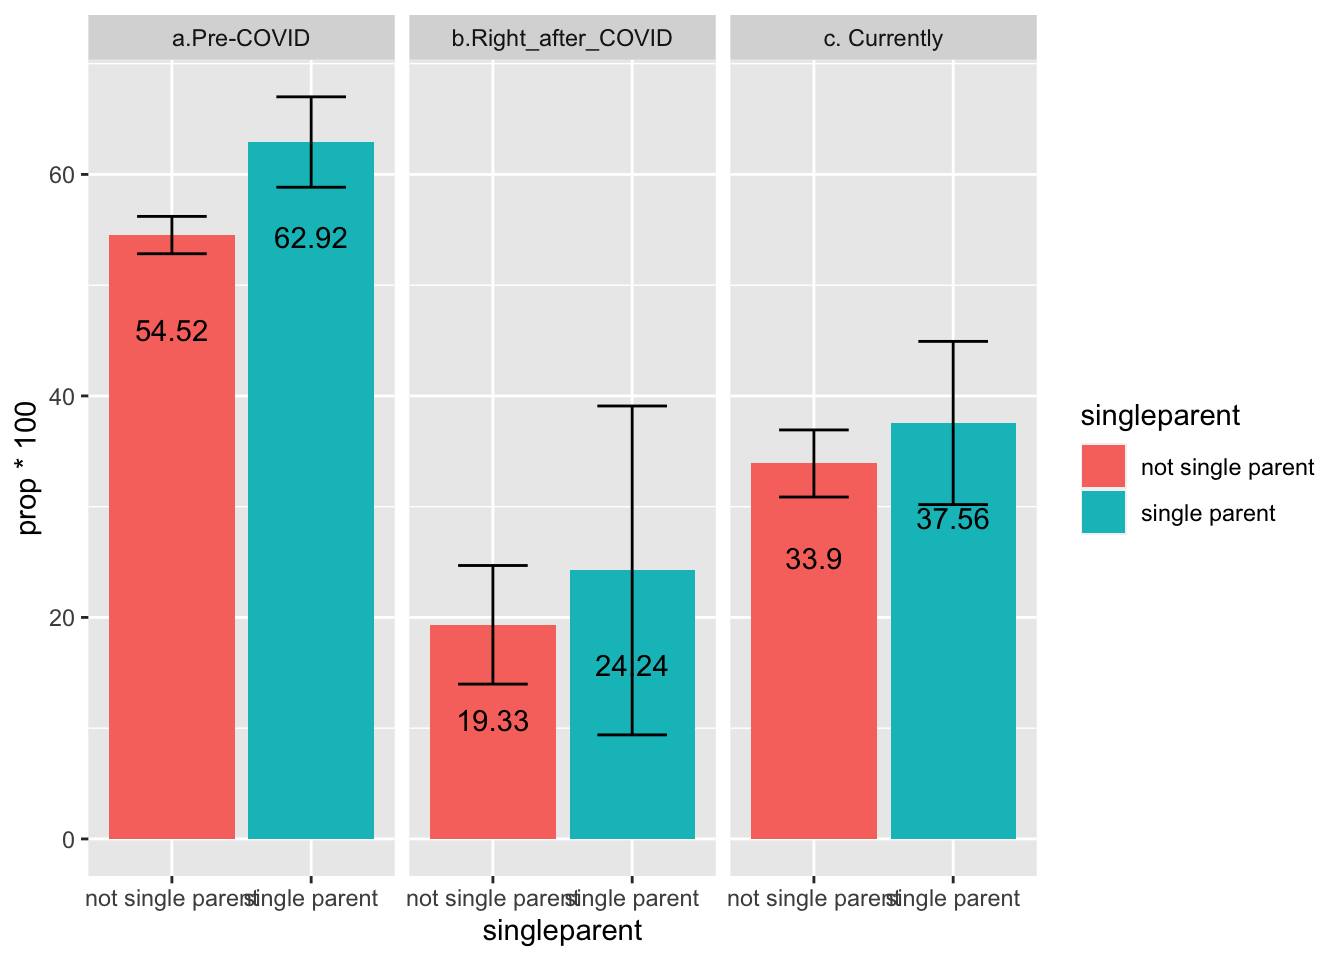
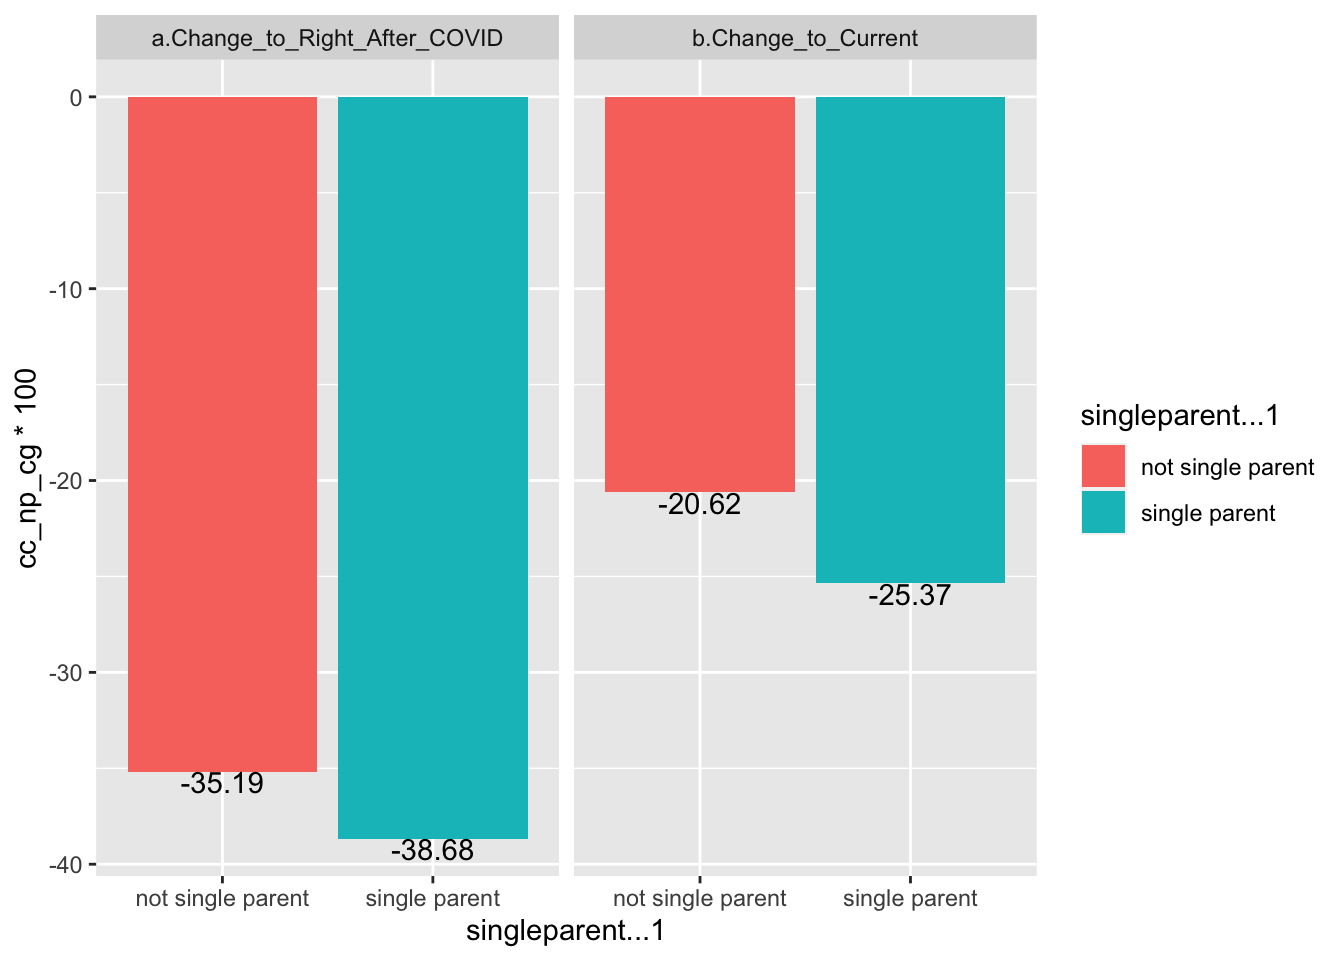
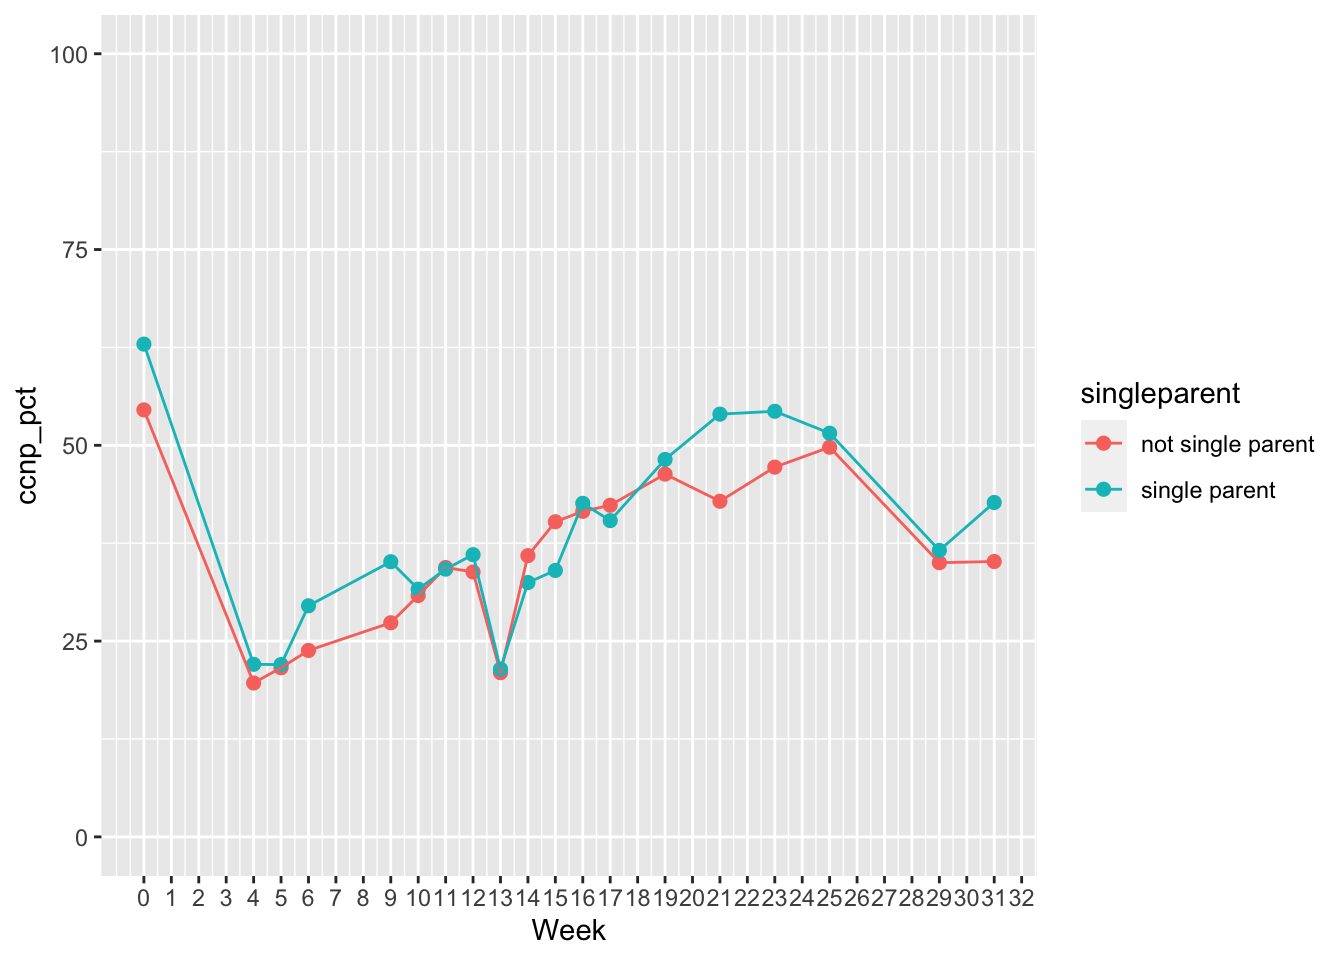
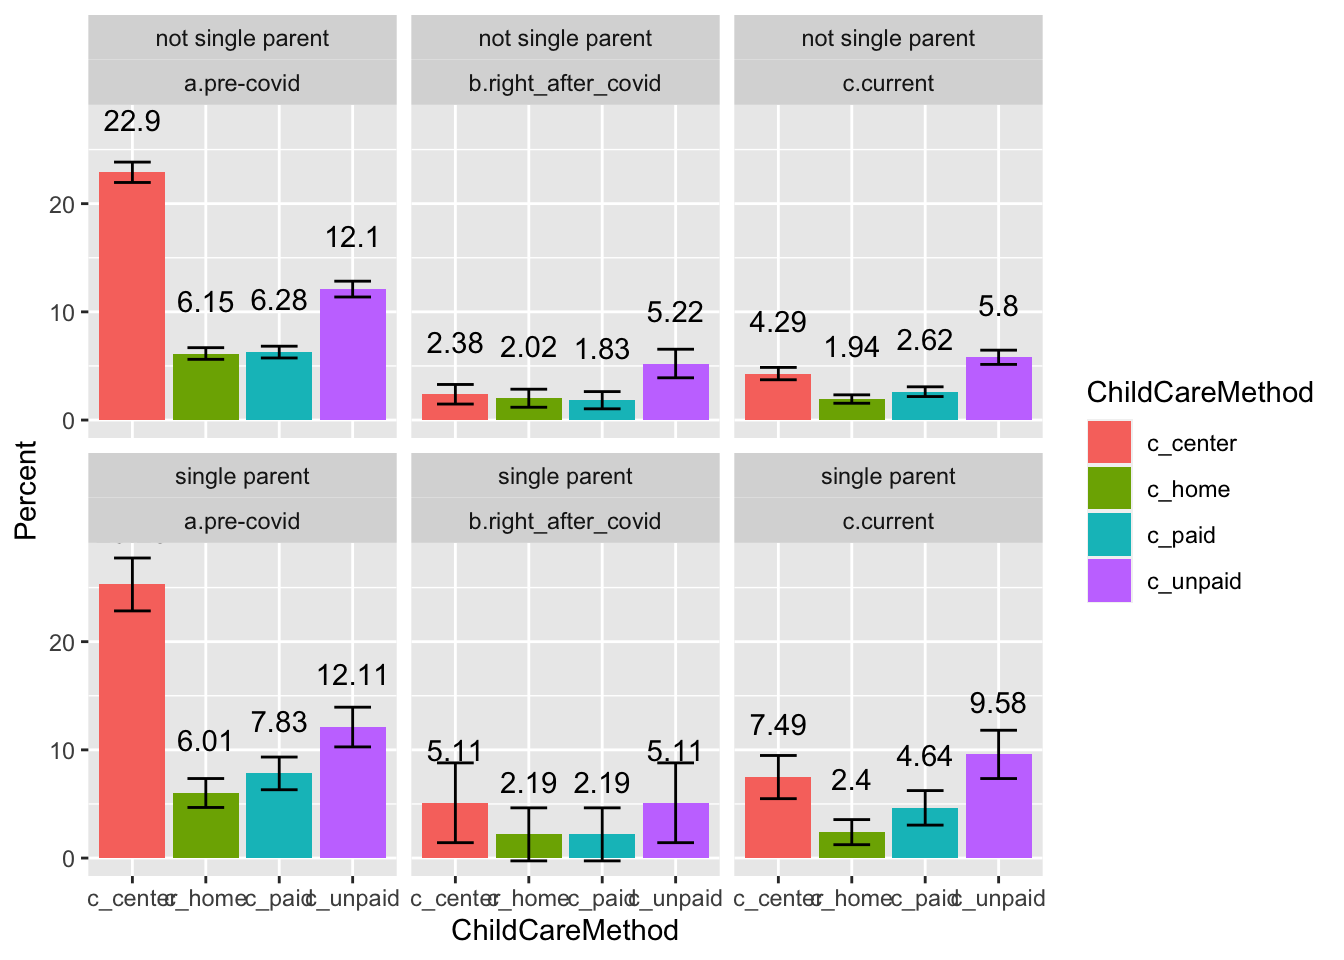
- Findings description: Results showed that for both single-parent and non-single-parent families, the percentage of using nonparental childcare dropped from pre- to right after COVID19, and then increased overtime recently. During all three time-points, single-parent families used more nonparental childcare compared to non-single families.
- Statistical test results:
- Significant differences in the percentage of using nonparental childcare during pre-covid, but no statistically significant differences right after COVID or currently
- For both single-parent and non-single-parent families, the differences between any two timepoints were statistically significant.
- Significant differences in the percentage of using nonparental childcare during pre-covid, but no statistically significant differences right after COVID or currently
Changes from Pre- to Right after COVID & Current - Breakdown by Single Parent Status
by Child Disability Status
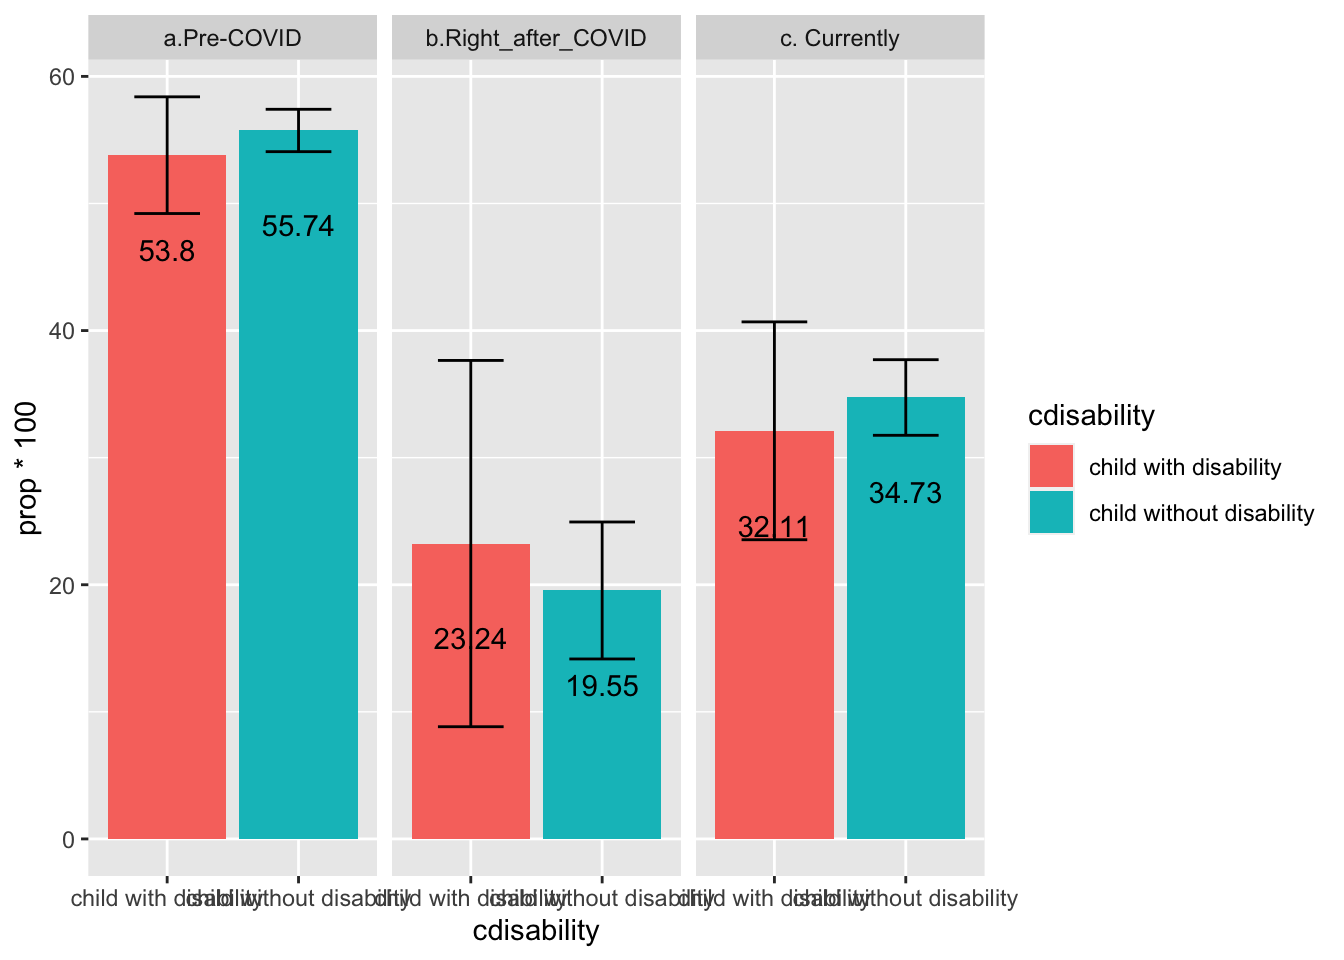
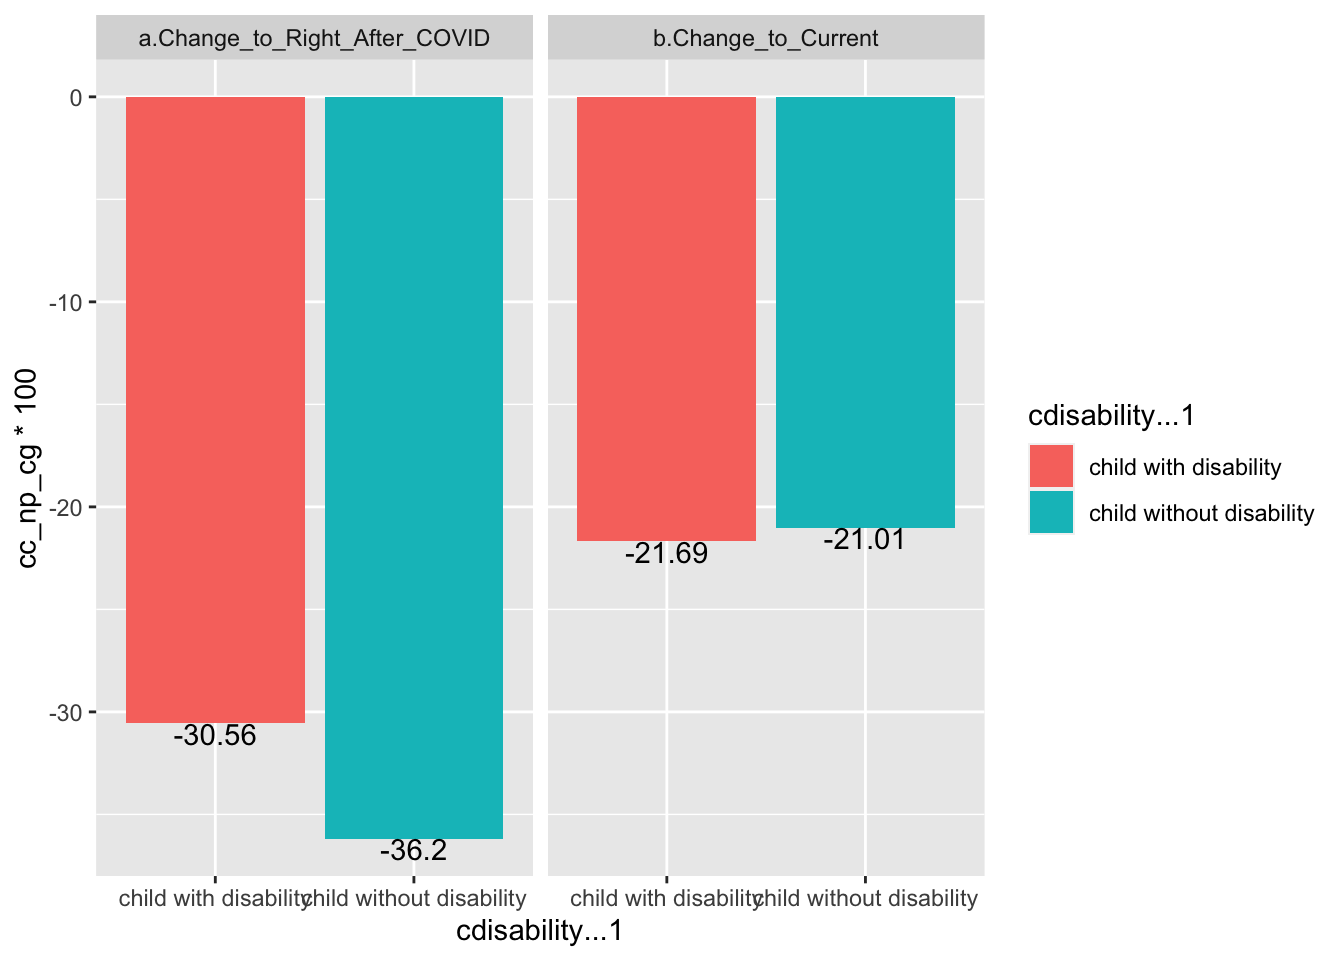
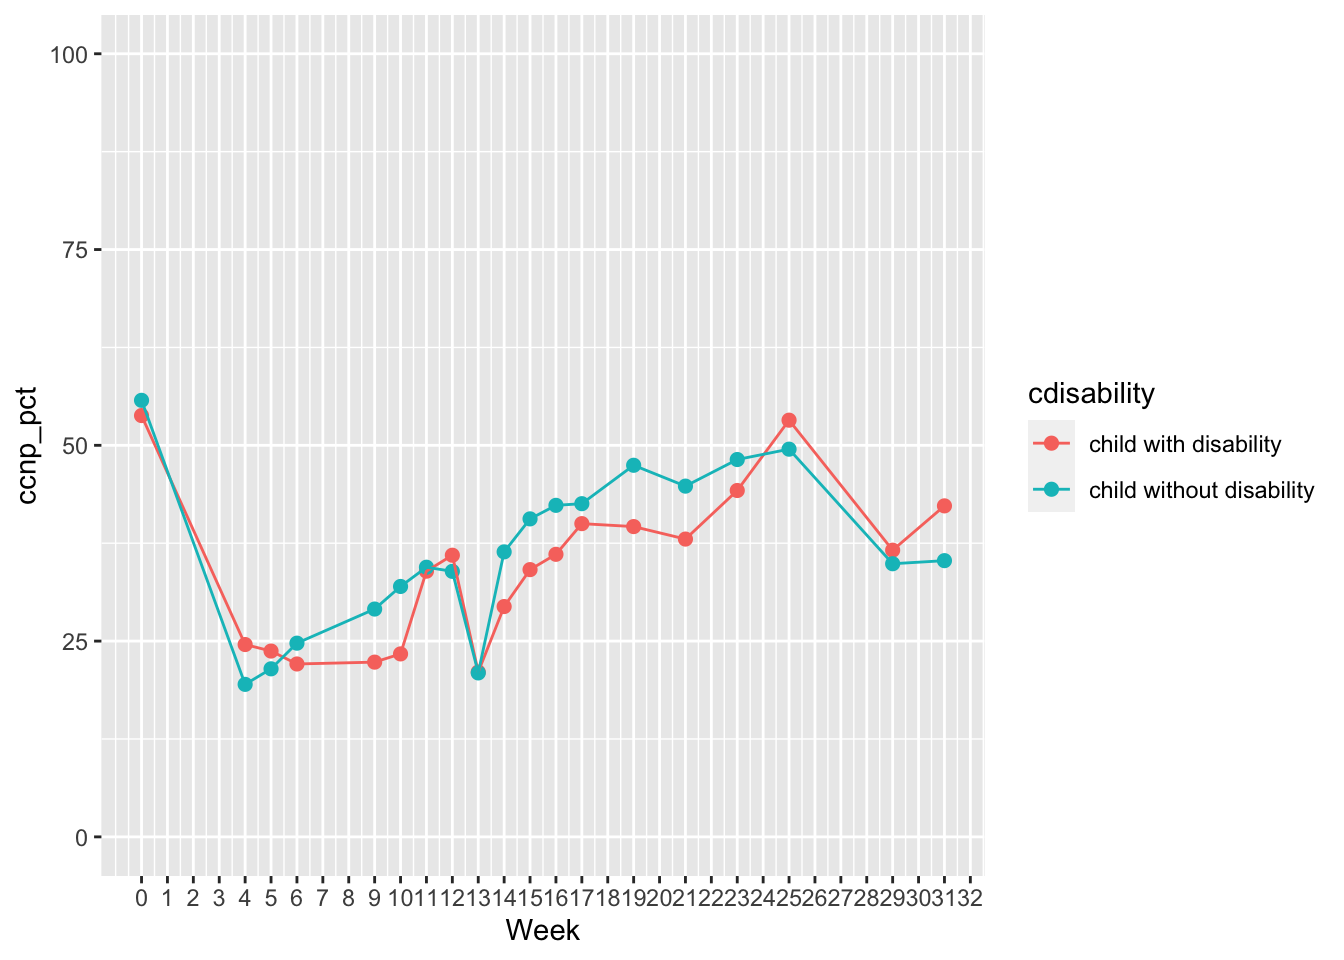
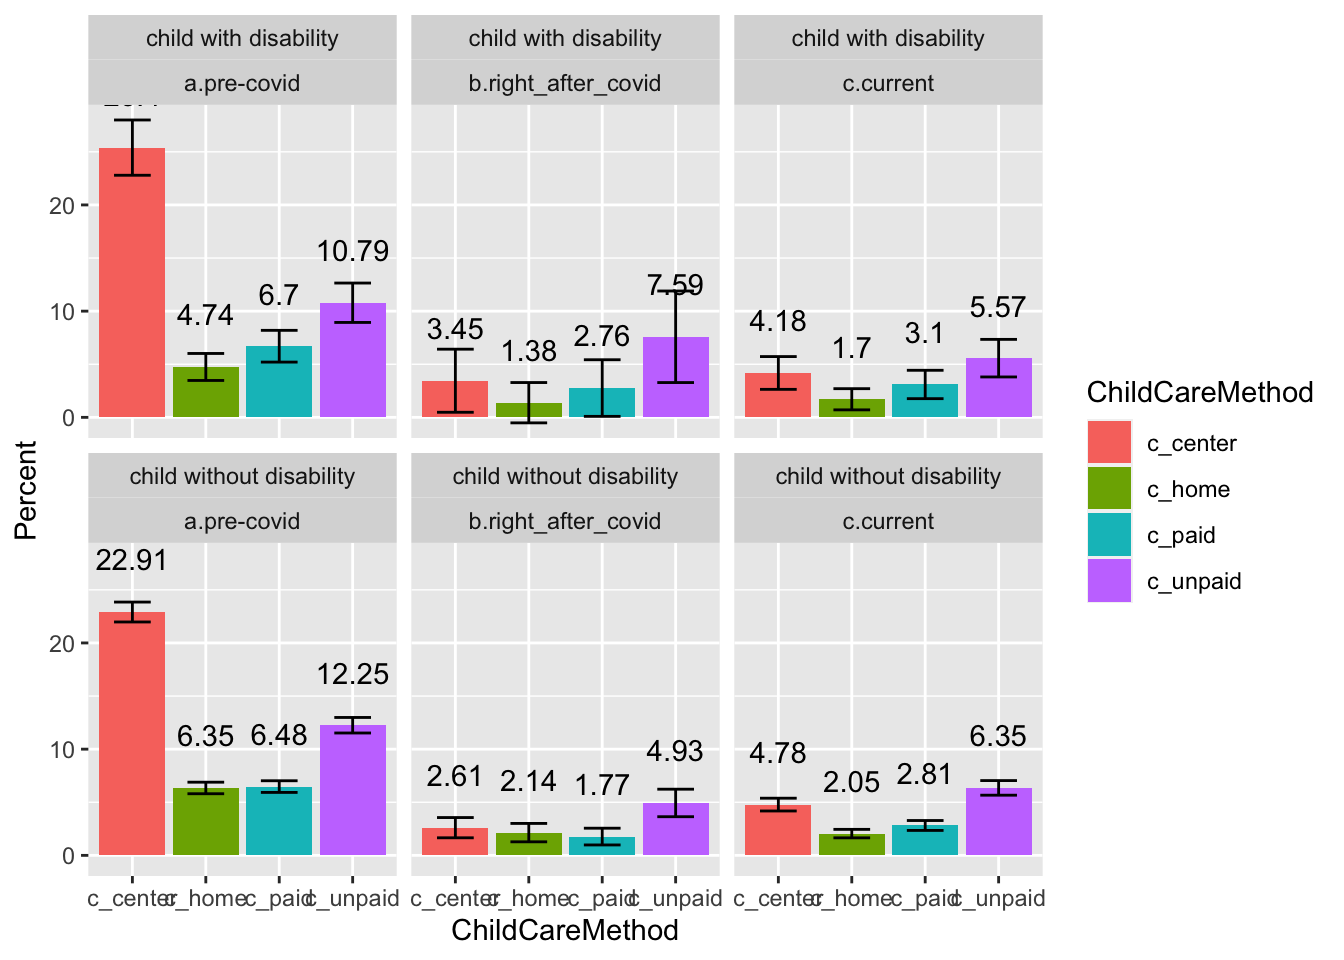
- Findings description: Results showed that for families of children with disability, the percentage of using nonparental childcare dropped from pre- to right after COVID19, and then kept dropping overtime; For families of children without disability, the percentage of using nonparental childcare dropped from pre- to right after COVID19, and then increased recently.
- Statistical test results:
- Pre-COVID, there was no significant differences in caregivers’ using nonparental childcare
- Right after COVID, families of children with disability used significantly more nonparental childcare compared to families of children without disability
- Currently, families of children with disability used significantly less nonparental childcare compared to families of children without disability
- For families of children with disability, the decrease of using nonparental childcare across three timepoints were all statistically significant
- For families of children without disability, the decreases from pre- to right after covid, from pre-covid to current, and increases from right after covid to current were all statistically significant.
- Pre-COVID, there was no significant differences in caregivers’ using nonparental childcare
Changes from Pre- to Right after COVID & Current - Breakdown by Child Disability Status
by Caregivers’ Employment Status
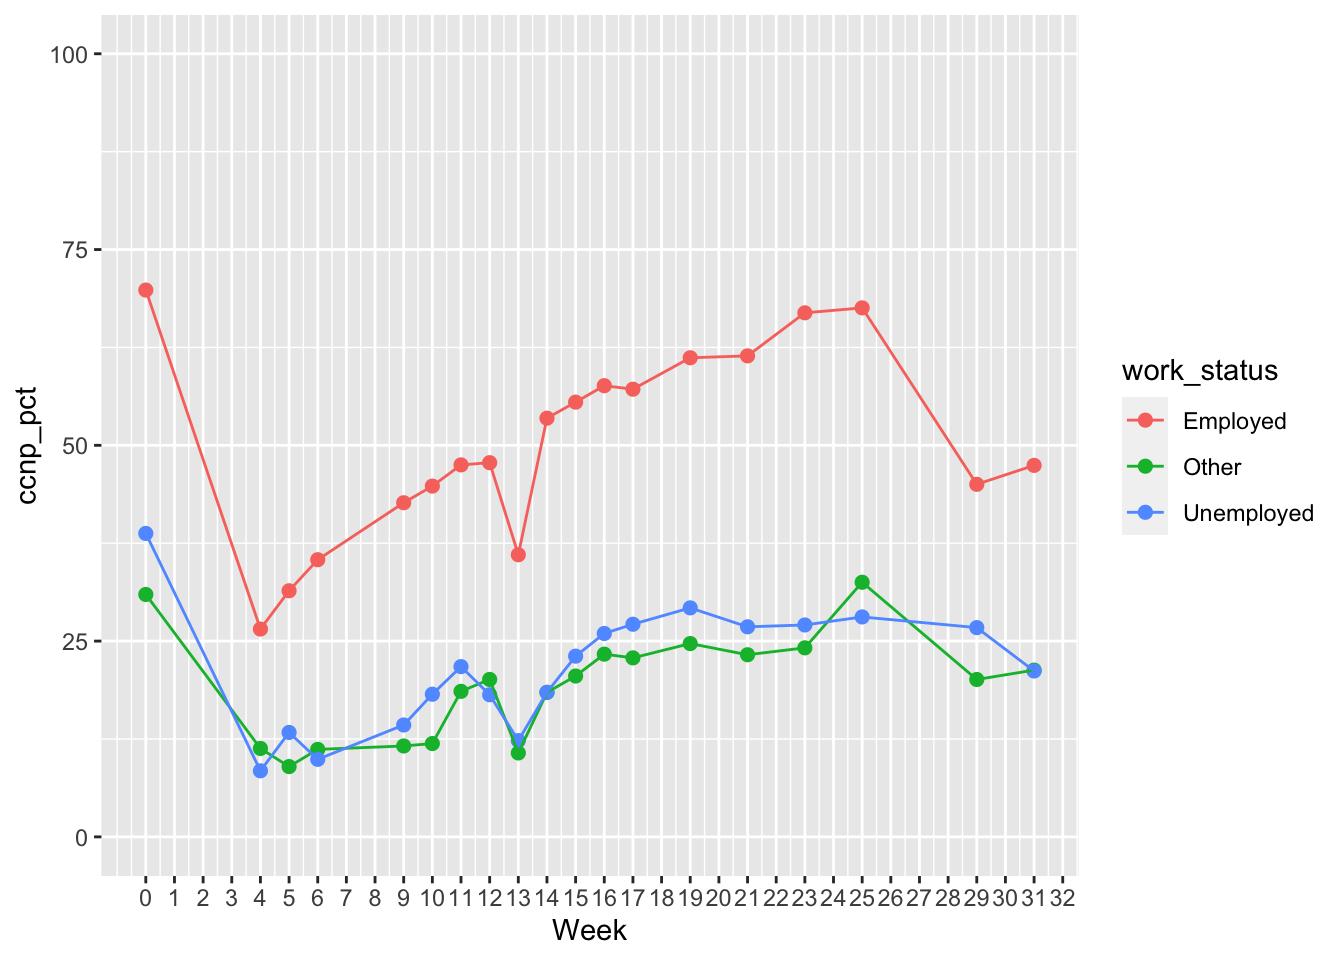
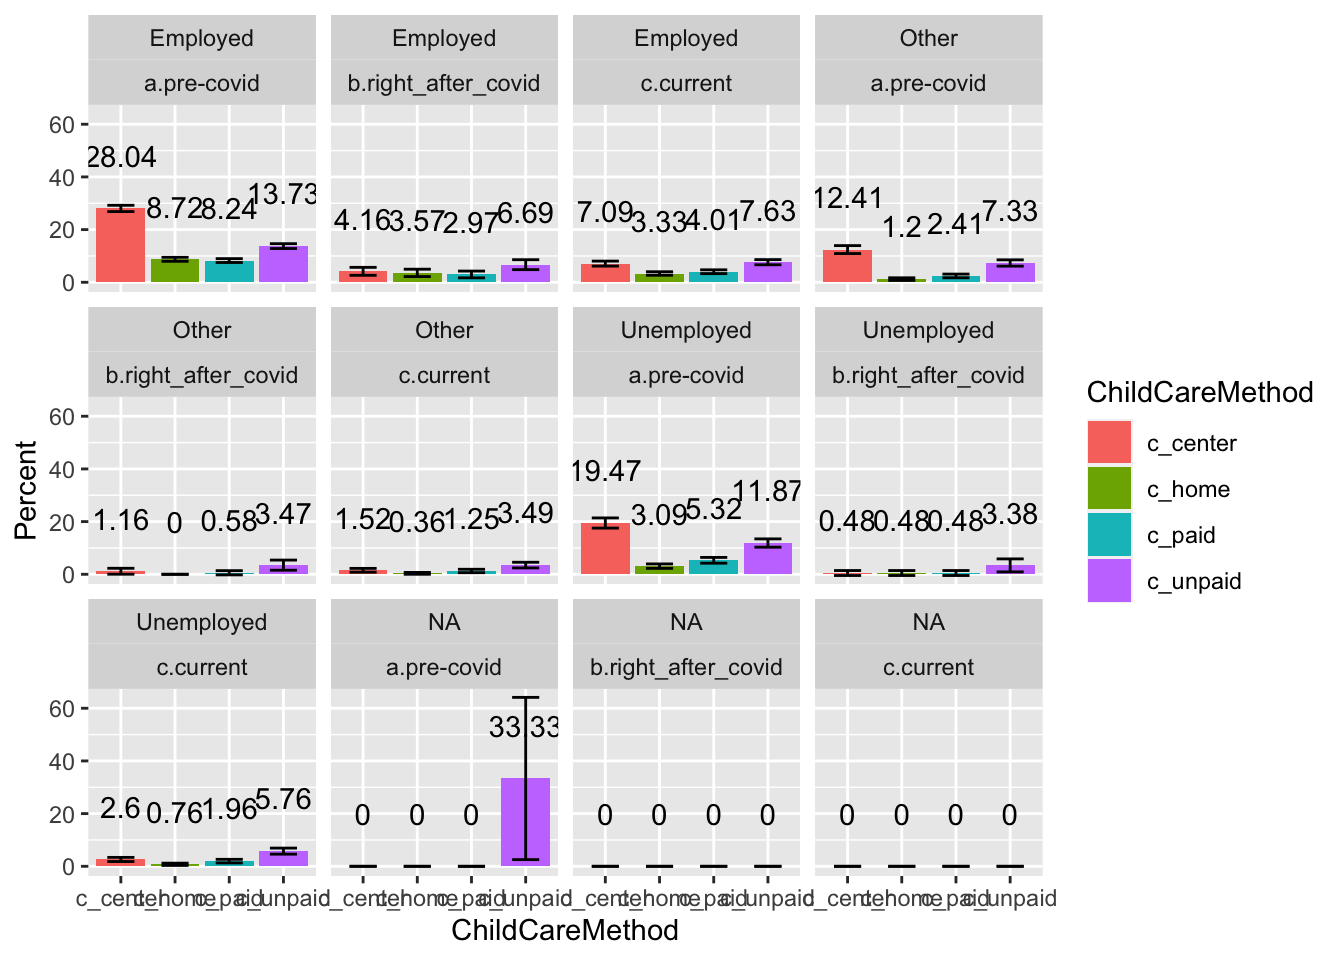
- Findings description: Results showed that for families of employed and unemployed caregivers, the percentage of using nonparental childcare dropped from pre- to right after COVID19, and then increased overtime recently. During all three time-points, employed caregivers used more nonparental childcare compared to unemployed caregivers
- Statistical test results:
- Significant differences in the percentage of using nonparental childcare at all three timepoints
- For both employed and unemployed caregivers, the differences between any two timepoints were statistically significant.
- Significant differences in the percentage of using nonparental childcare at all three timepoints
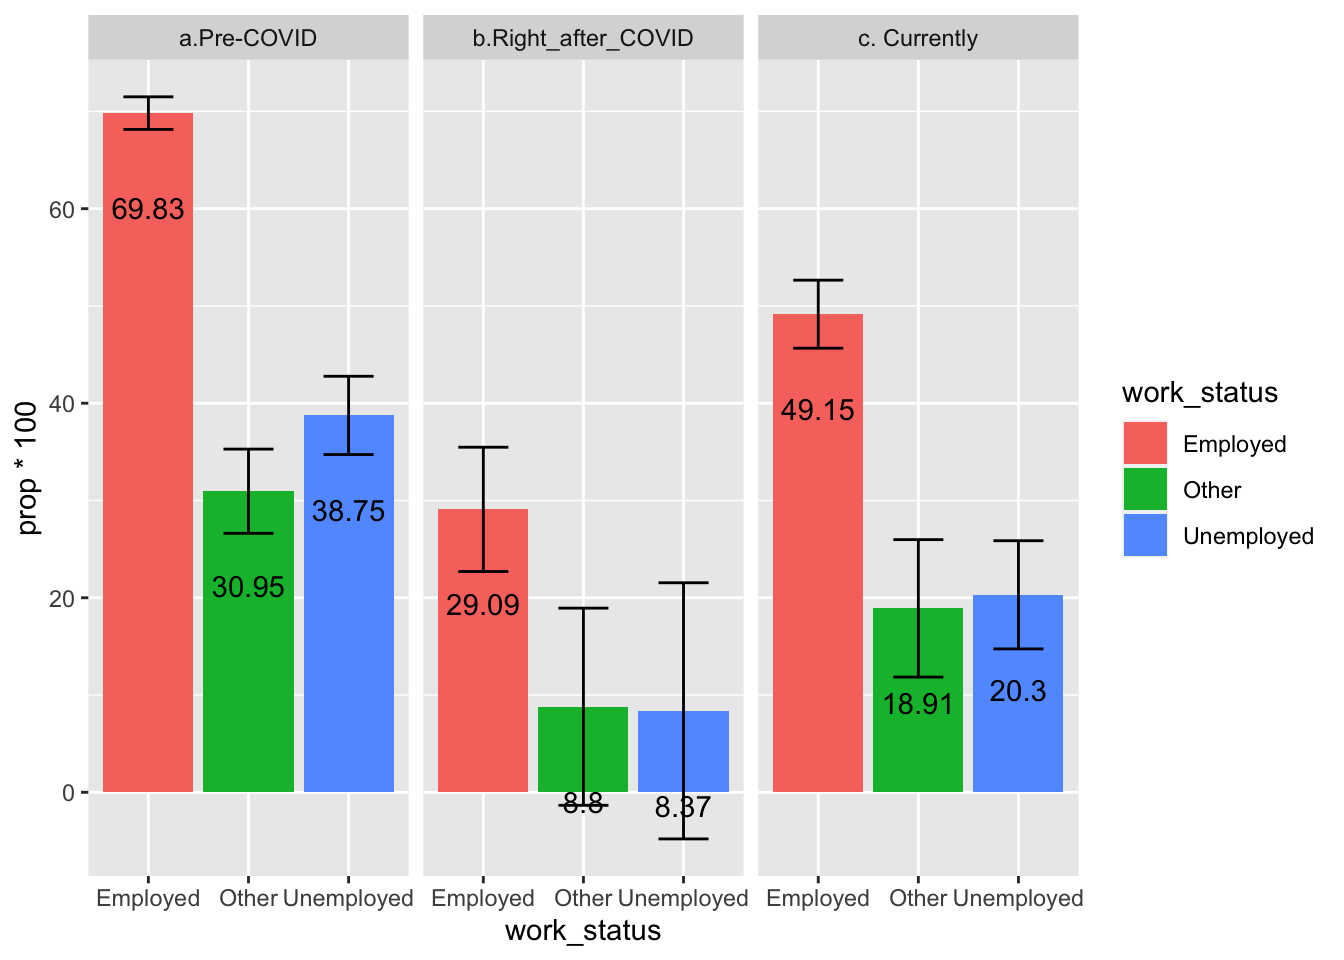
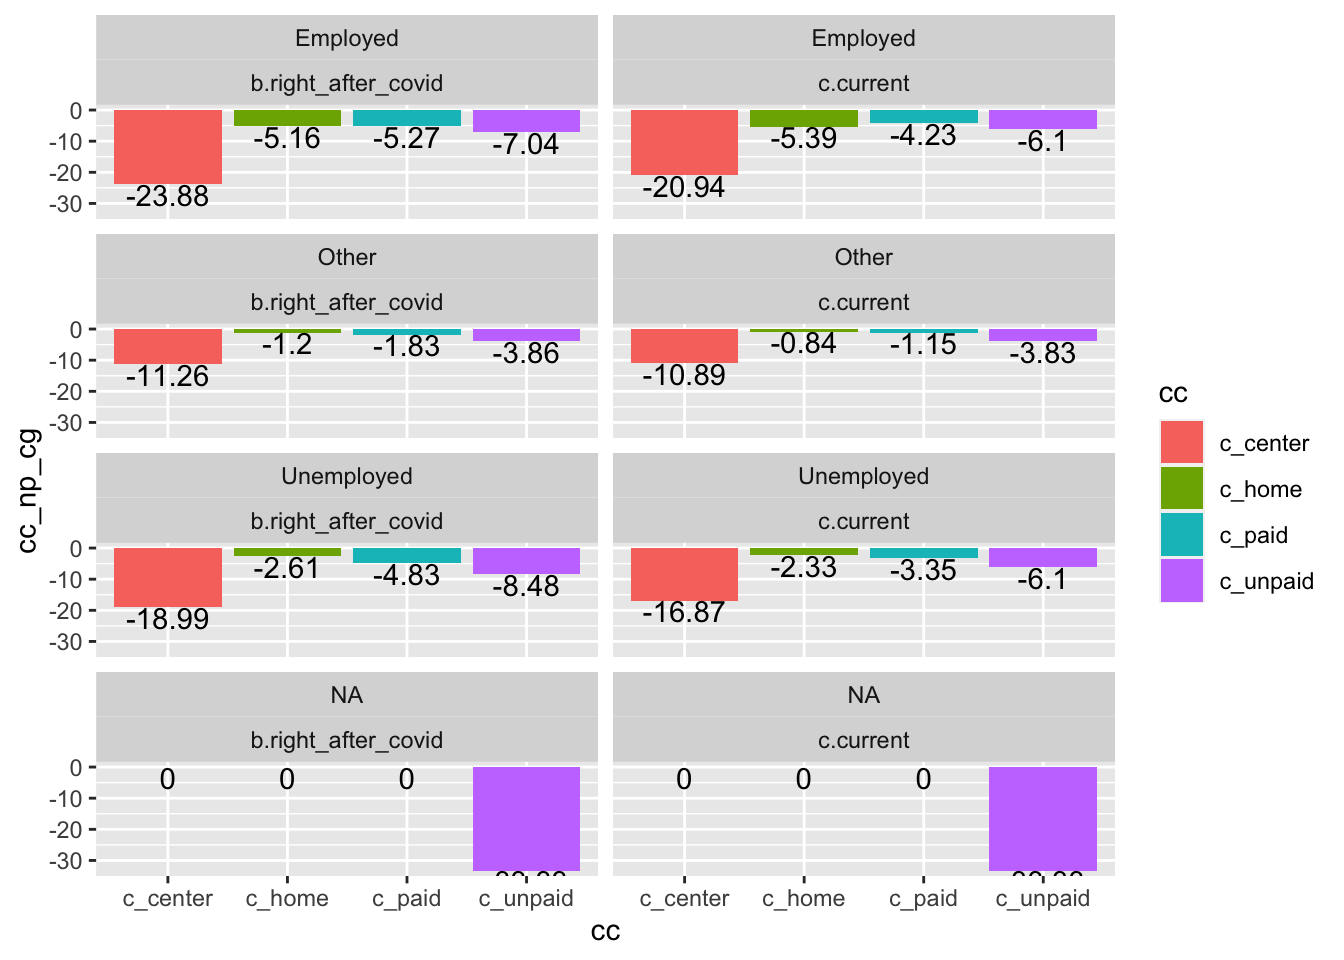
Changes from Pre- to Right after COVID & Current - Breakdown by Caregivers’ Employment Status
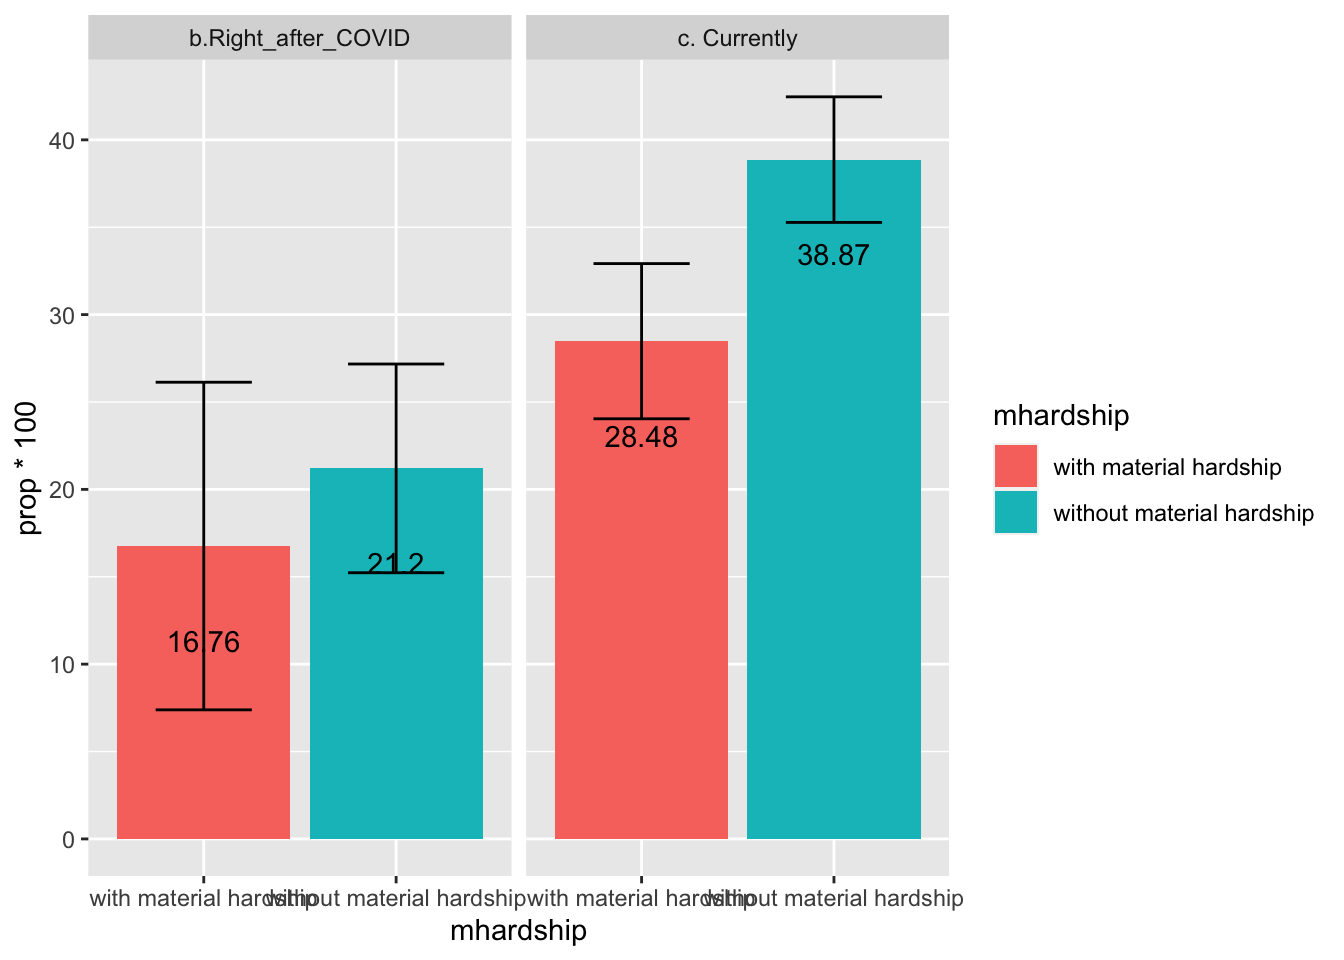
by Material Hardship Status
*Note. No data assessing pre-COVID material hardship. Thus, data below present the usage of non-parental childcare breakdown by material hardship status only during right after COVID and current situations.
- Findings description:
- No statistically significant differences in the percentage of using nonparental childcare by material hardship status right after COVID
- At the current timepoint, families not experiencing any material hardship reported significantly more usage of nonparental childcare compared to families who are experiences material hardship
- For both families with or without material hardship, the percentage of using nonparental childcare significantly increased from right after covid to current situations.
- No statistically significant differences in the percentage of using nonparental childcare by material hardship status right after COVID
Map Out Changes of Percentage of Non-Parental Childcare Over Time
- Overall, families’ use of non-parental childcare first decreased after COVID-19, then slowly increased over time.
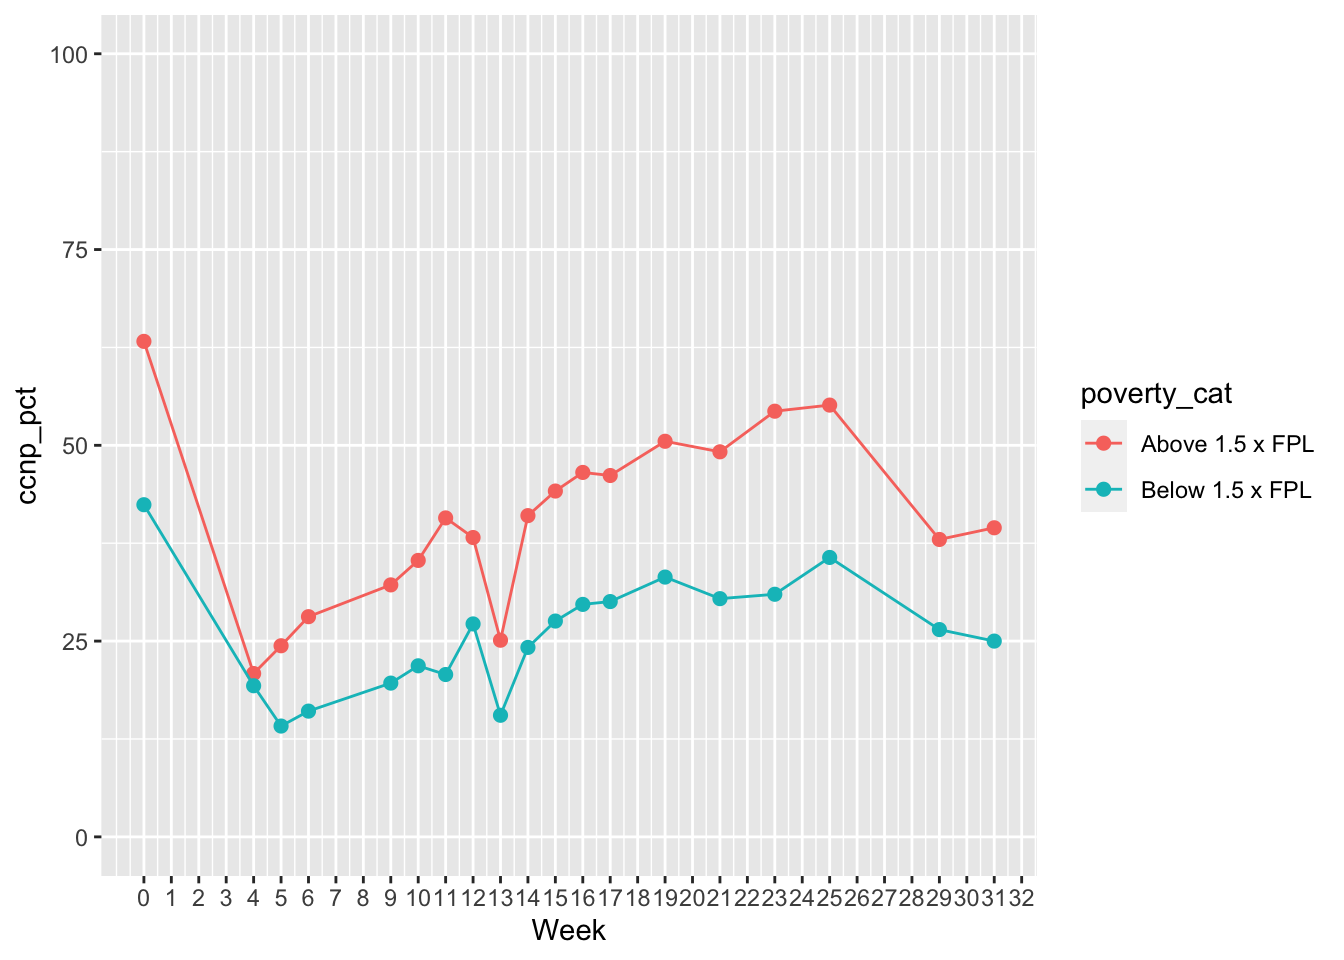
Breakdown by Income
- Results showed that high-income families reported more non-parental childcare use compared to low-income families; the trend of changes was similar across these two groups.
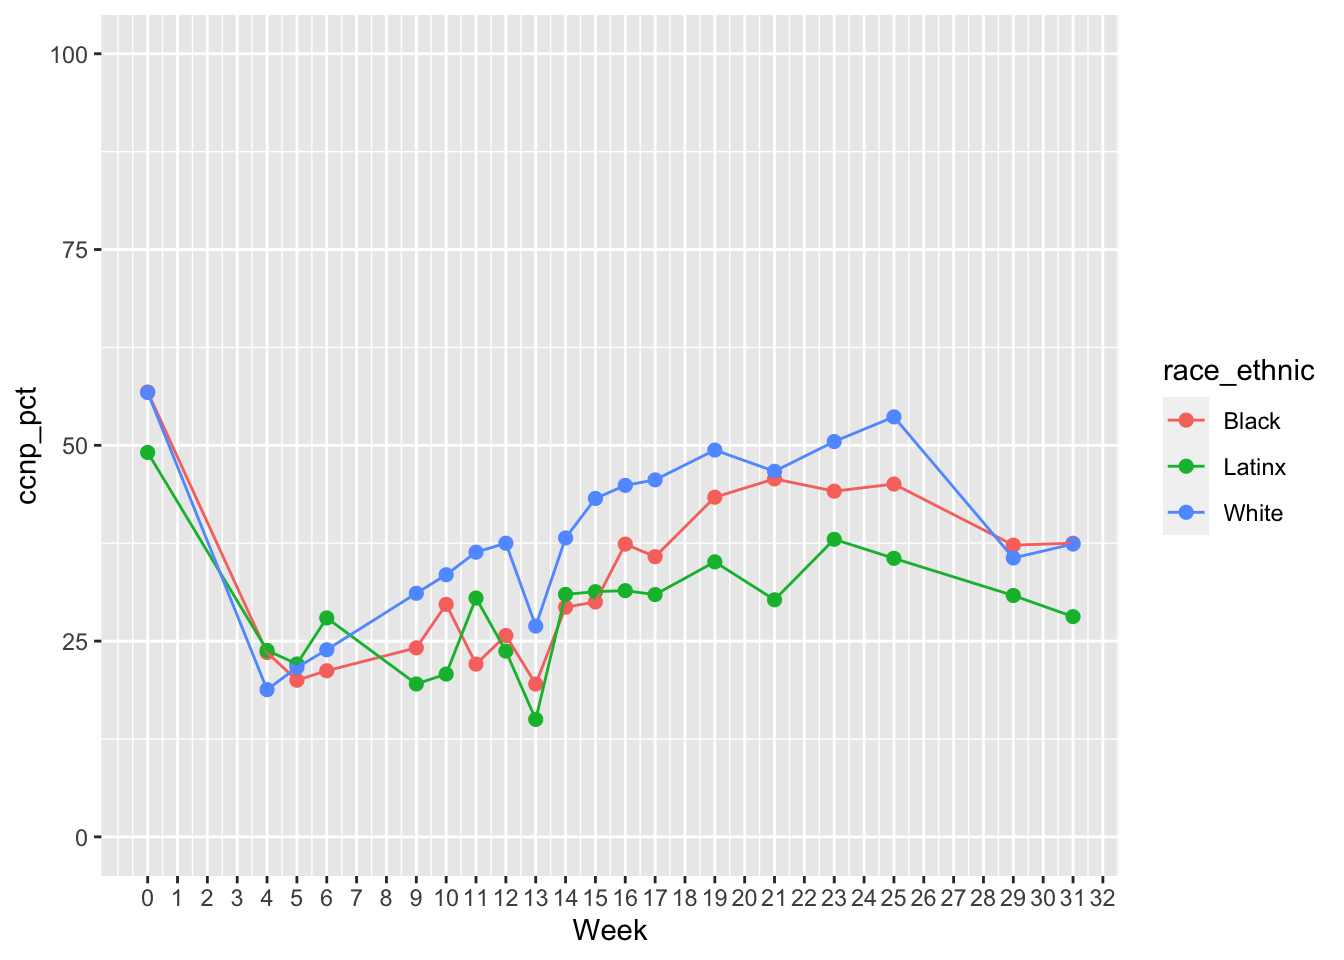
by Race/Ethnicity
- White families reported using more nonparental childcare compared to Black and Latinx families. Black and White families showed more steady increases of using nonparental childcare from Week 9, while Latnix families’ changes were less obvious.
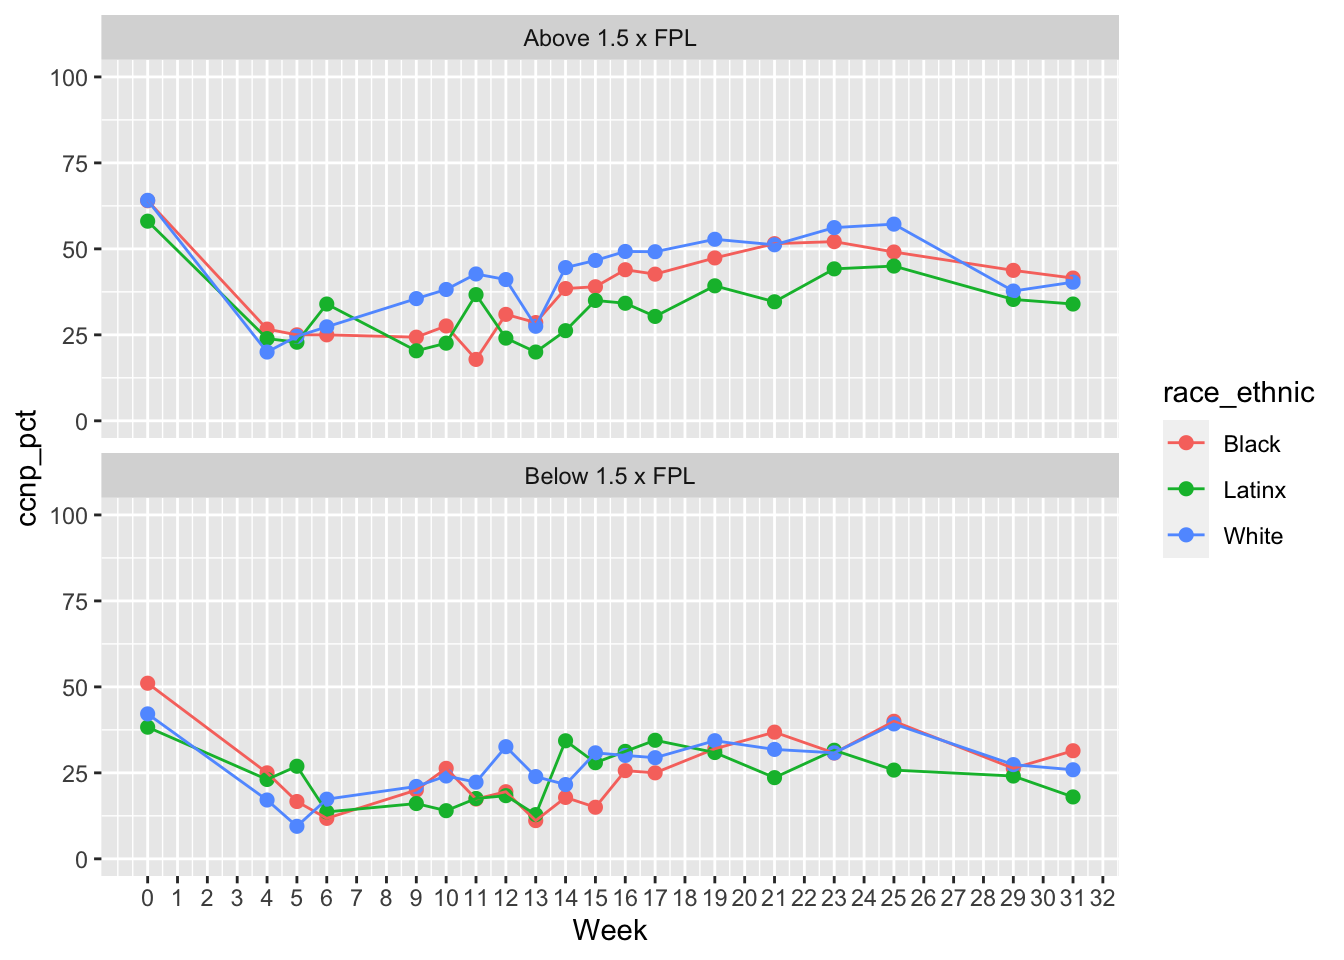
by Income and Race/Ethnicity
Single Parent Status
- Single-parent families reported more non-parental childcare use compared to non-single-parent families; the trend of changes was similar across these two groups.
Child Disability Status
- Families of children without disability showed steady increases in using nonparental childcare from Week 4; However, for families with children with disability, the overall trend of using nonparental childcare was decreasing until Week 10 and then remained the same after (small sample size for families of children with disability).
Caregivers’ Employment Status
- Caregivers who were employed reported using more non-parental childcare compared to caregivers who were unemployed during COVID-19. Additionally, the percentage of nonparental childcare use among employed caregivers has almost returned back to pre-COVID level, but the percentage of nonparental childcare use among unemployed caregivers is still lower than pre-COVID level.
Material Hardship Status
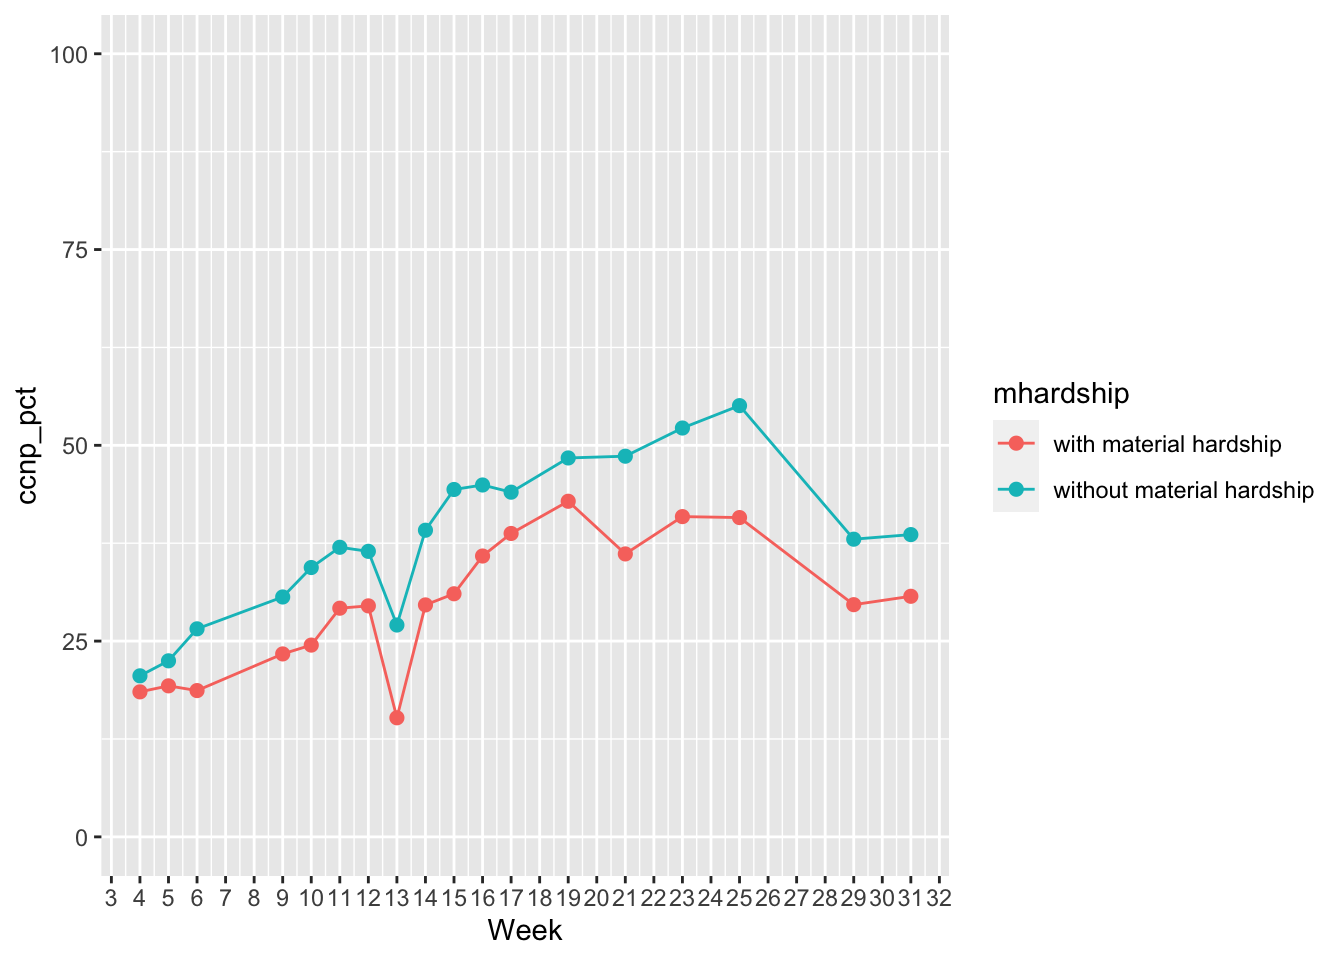
*Note that figure below starts from Week 4 because of lack of material hardship data for baseline.
- Families experiencing material hardship used less nonparental childcare compared to families without mateiral hardship; the trend of increasing from week 4 to current was similar across two groups.
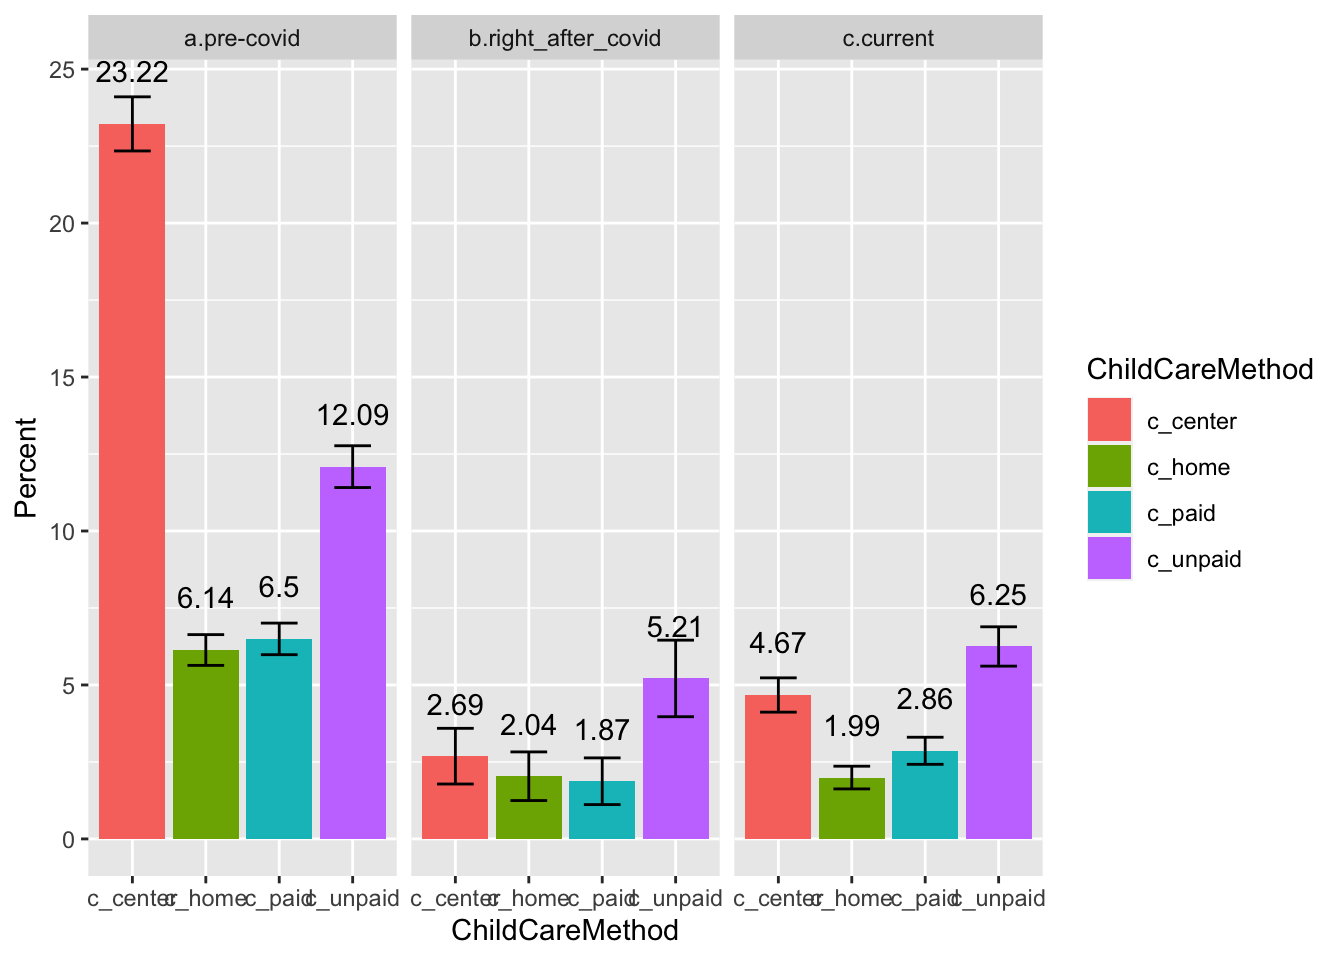
Types of Childcare Caregivers Used
*Data based on weeks 5-6, and 9-25. Figures below present the percentage of different childcare methods among all caregivers.
*Note:
c_unpaid = Using unpaid care by a relative, friend, or neighbor (>5+ hours per week)
c_paid = Using paid care by a relative, friend, or neighbor (>5+ hours per week)
c_center = Using paid or unpaid center-based care, such as pre-school, day care, etc. but not include kindergarten
c_home = Using paid care from a home-based child care provider (>5+ hours per week).
Total Responses
- Statistical test results:
- Changes from pre- to right after COVID: significant decreases in center-based childcare ; no statistically signficant changes for home-based, paid, and unpaid childcare
- Changes from pre-COVID to current: significant increases in all four types of childcare
- Changes from right-after COVID to current: significant increases in all four types of childcare.
- Changes from pre- to right after COVID: significant decreases in center-based childcare ; no statistically signficant changes for home-based, paid, and unpaid childcare
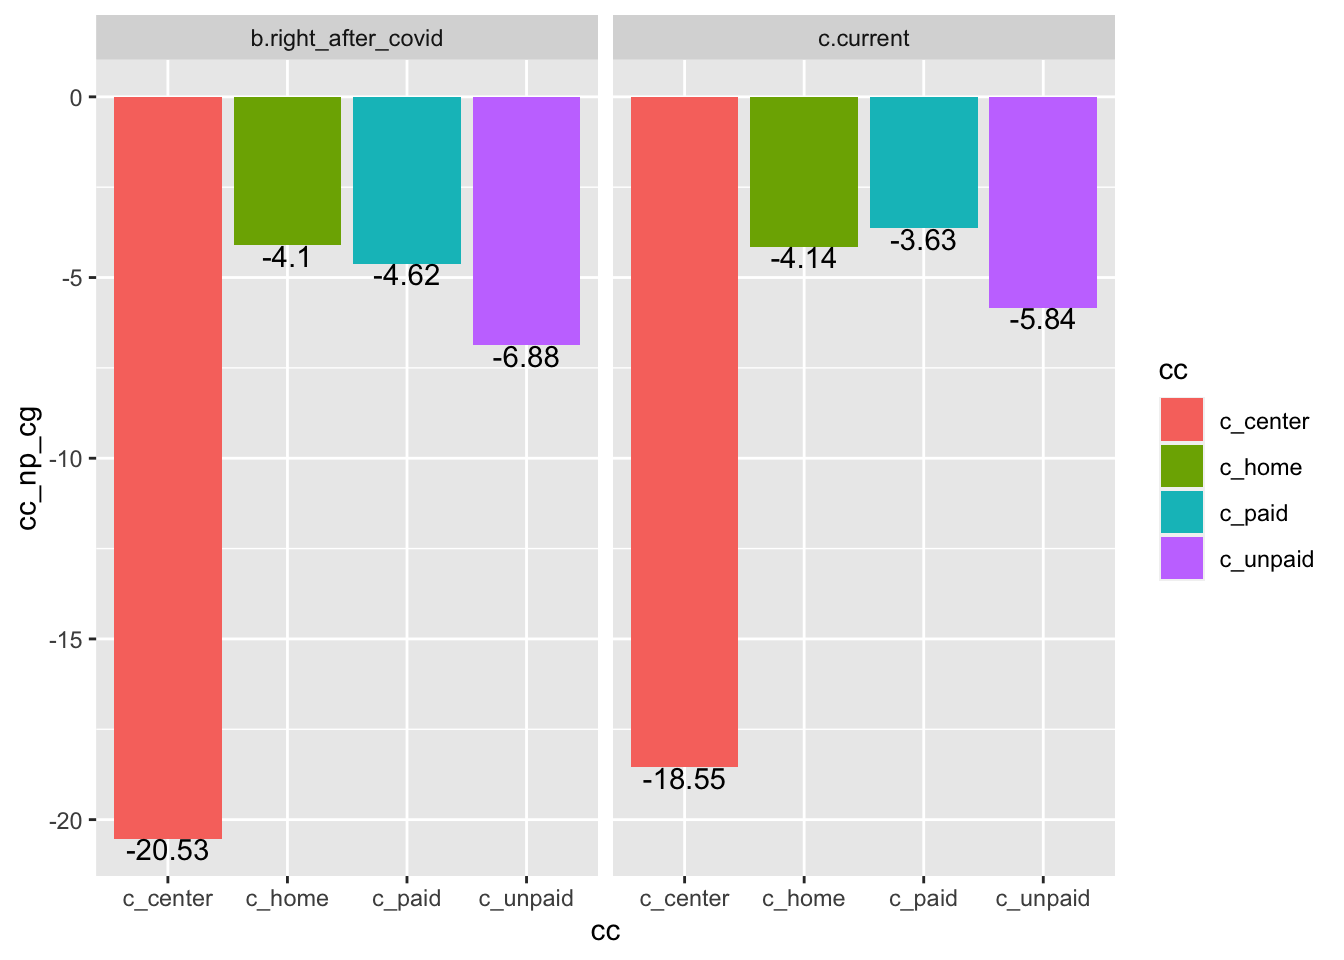
Changes from Pre- to Right after COVID & Current
*Note. Figure below indicates changes in the percentage of using different childcare types from pre-COVID to right after COVID (weeks 4-6) and to current situation. negative values indicate decreases, while positive values suggest increases.
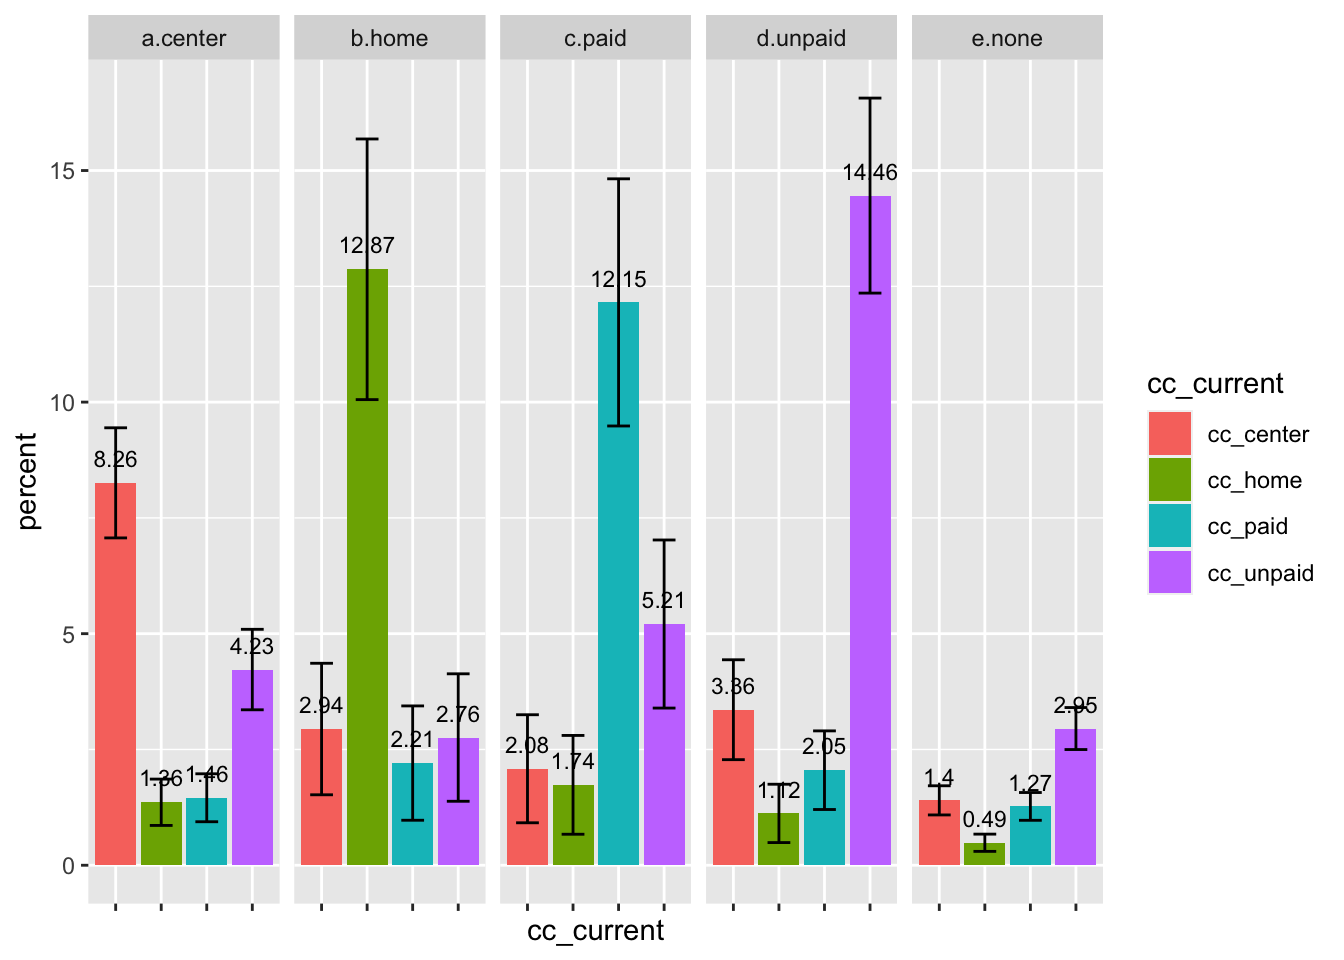
Grid of Pre-COVID & Current Childcare Choice Shifts
This figure presents the shift of childcare types from pre-COVID to current (i.e., caregivers’ most recent responses). Each facet indicates the childcare type caregivers used before COVID-19. In each facet, the bars reflect caregivers’ current childcare type. For example, for caregivers using center-based childcare before COVID, there were 14.98% of them still using center-based childcare currently, 2.14% using home-based, 2.71% using paid, and 8.70% using unpaid childcare. Facet e reflect caregivers who reported not using any of the four types of childcare before COVID.
Race/Ethnicity
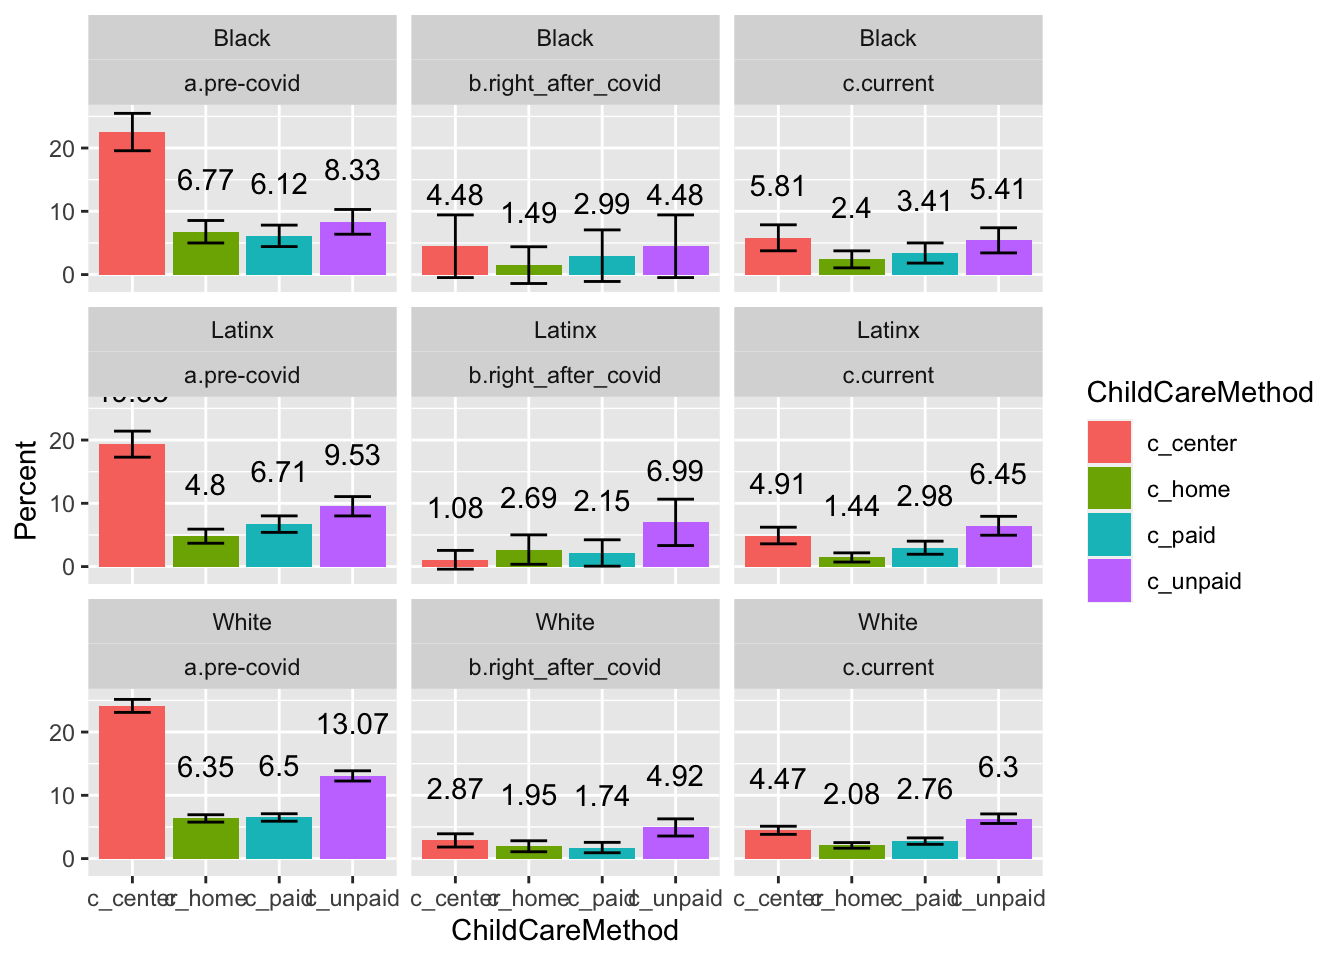
Changes from Pre- to Right after COVID & Current - Breakdown by Race/Ethnicity
*Note. Figure below indicates changes in the percentage of using different childcare types from pre-COVID to right after COVID (weeks 4-6) and to current situation. negative values indicate decreases, while positive values suggest increases.
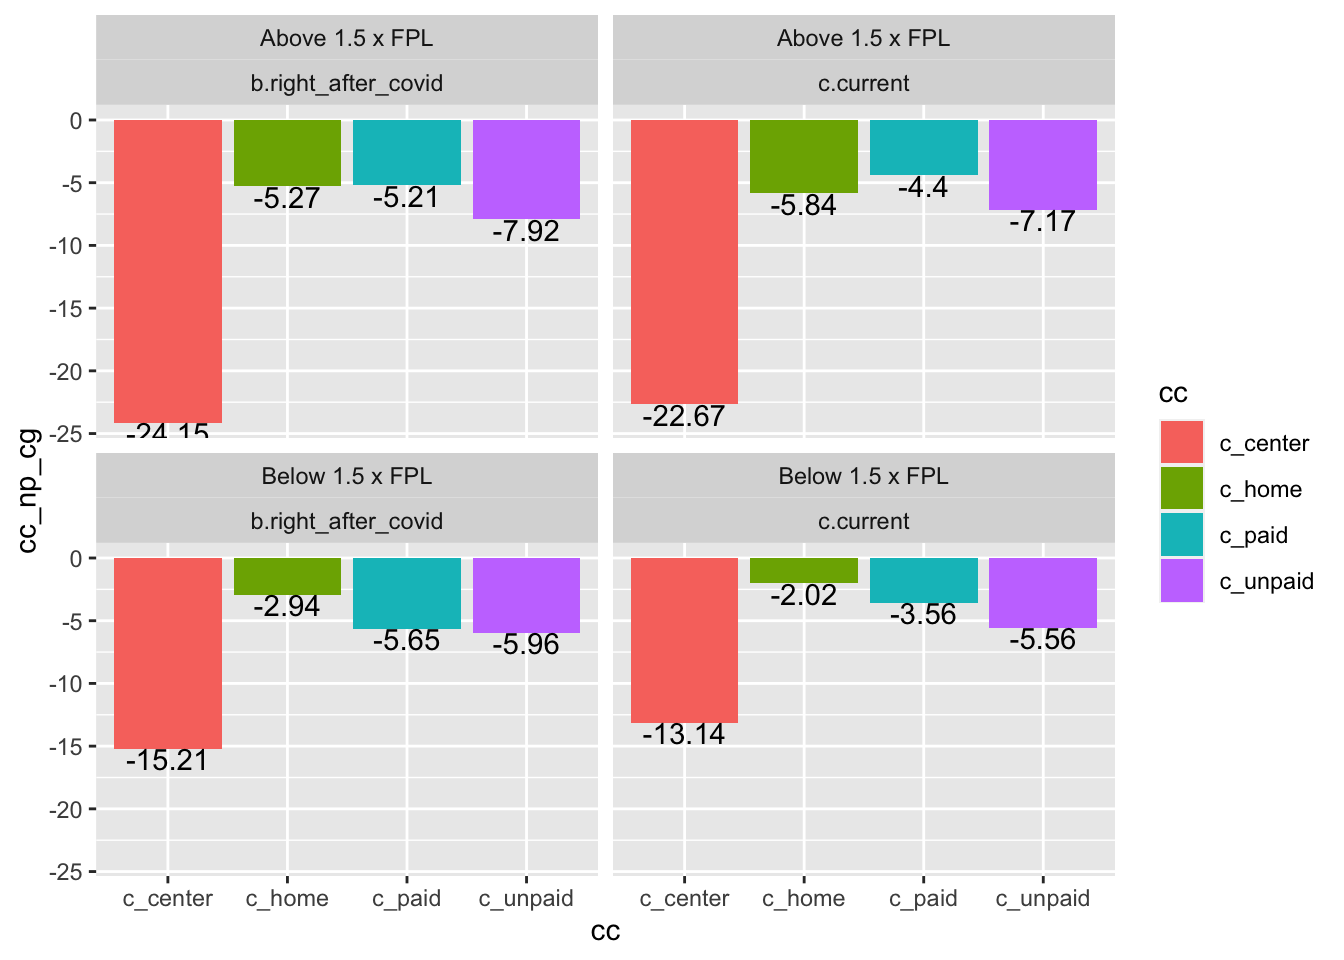
Income
Changes from Pre- to Right after COVID & Current - Breakdown by Income
*Note. Figure below indicates changes in the percentage of using different childcare types from pre-COVID to right after COVID (weeks 4-6) and to current situation. negative values indicate decreases, while positive values suggest increases.
Income and Race/Ethnicity
Changes from Pre- to Right after COVID & Current - Breakdown by Race/Ethnicity abd Income
*Note. Figure below indicates changes in the percentage of using different childcare types from pre-COVID to right after COVID (weeks 4-6) and to current situation. negative values indicate decreases, while positive values suggest increases.
Single Parent Status
Changes from Pre- to Right after COVID & Current - Breakdown by Single Parent Status
*Note. Figure below indicates changes in the percentage of using different childcare types from pre-COVID to right after COVID (weeks 4-6) and to current situation. negative values indicate decreases, while positive values suggest increases.

Child Disability Status
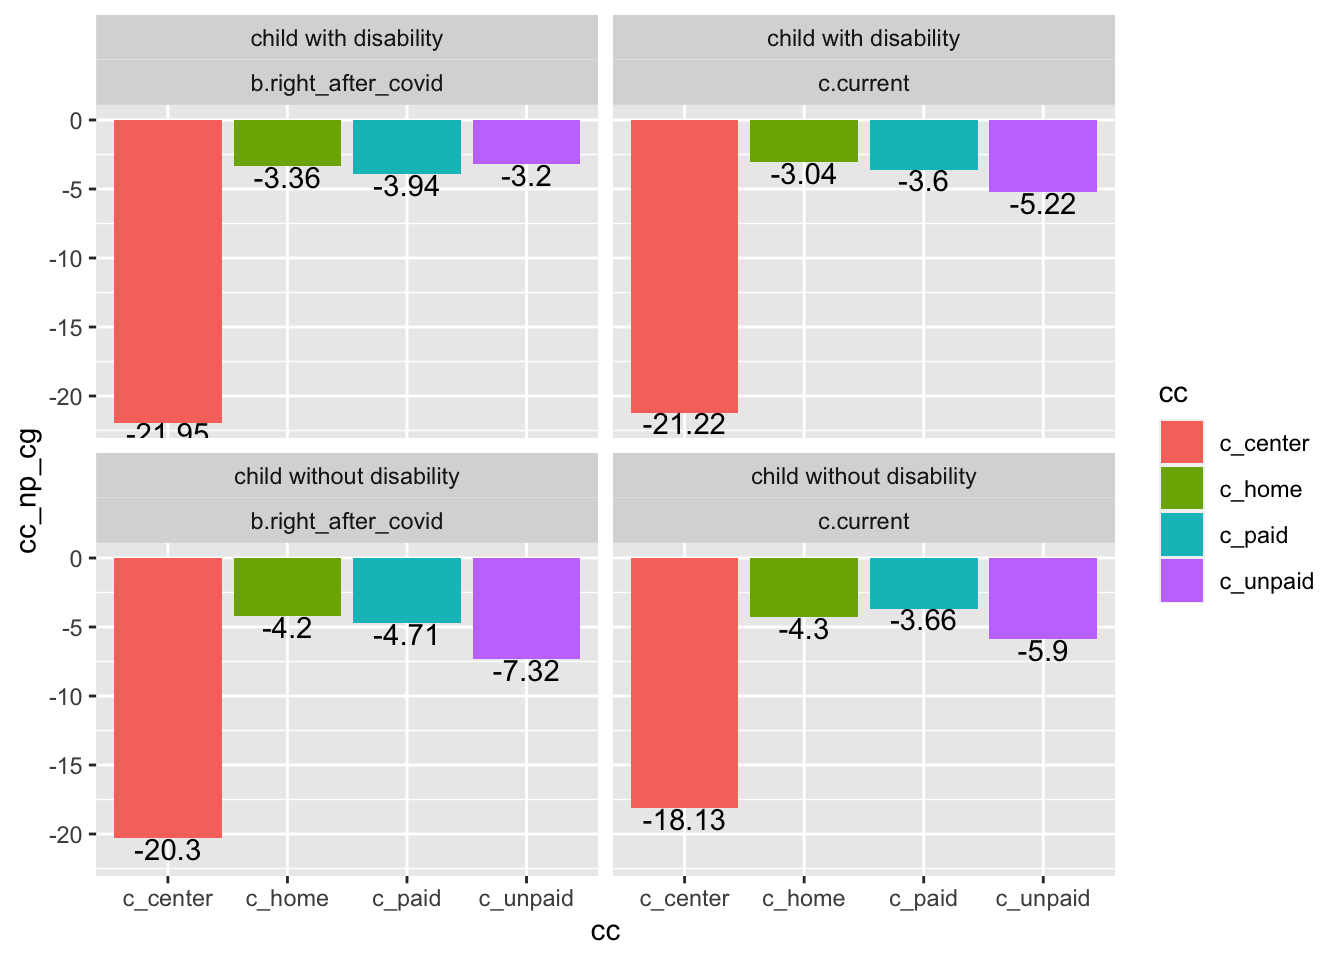
Changes from Pre- to Right after COVID & Current - Breakdown by Child Disability Status
*Note. Figure below indicates changes in the percentage of using different childcare types from pre-COVID to right after COVID (weeks 4-6) and to current situation. negative values indicate decreases, while positive values suggest increases.
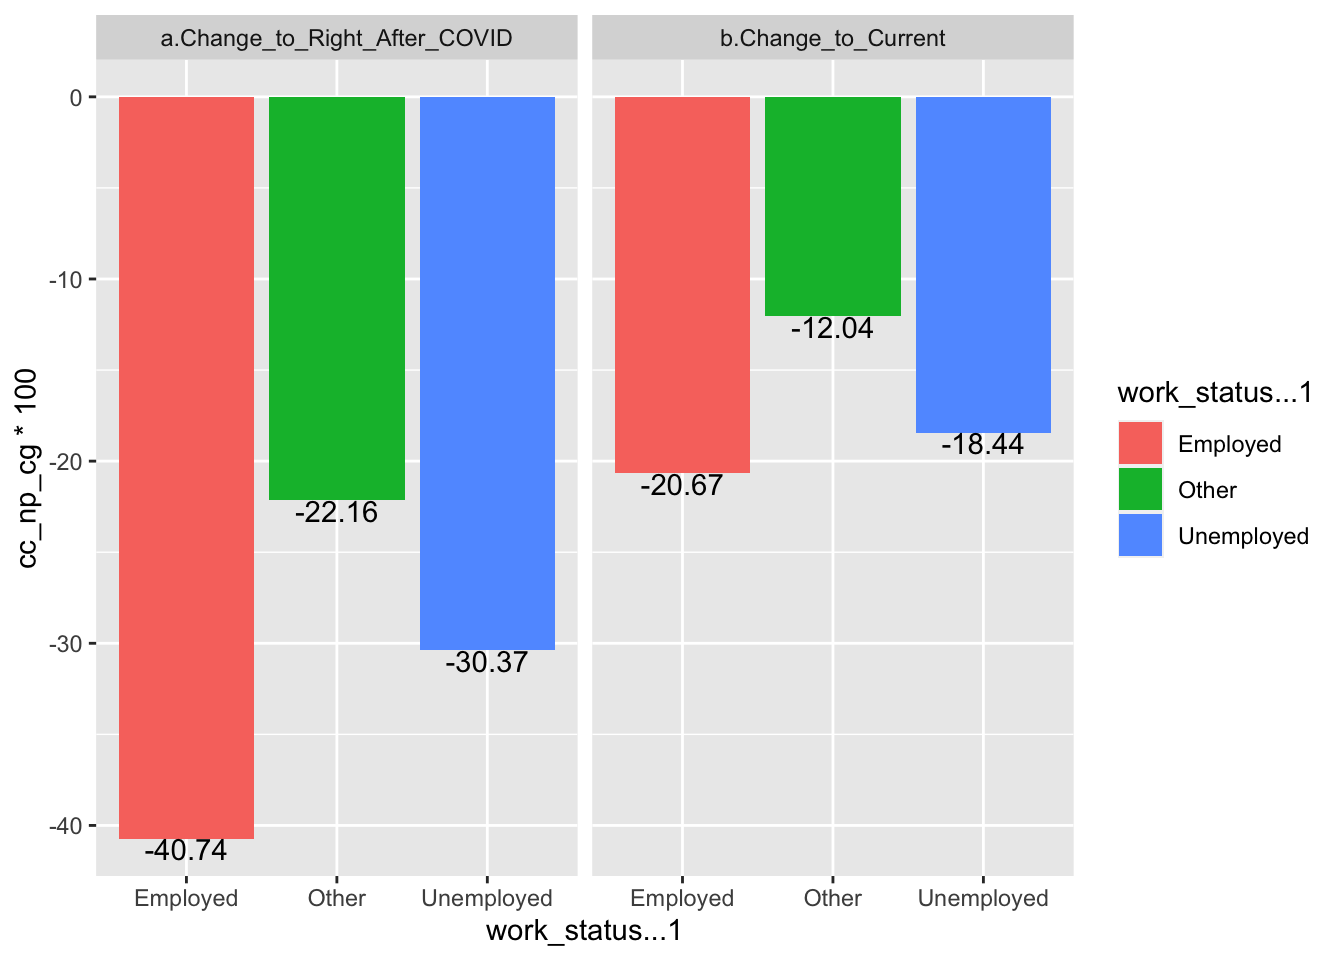
Caregivers’ Employment Status
Changes from Pre- to Right after COVID & Current - Breakdown by Caregivers’ Employment Status
*Note. Figure below indicates changes in the percentage of using different childcare types from pre-COVID to right after COVID (weeks 4-6) and to current situation. negative values indicate decreases, while positive values suggest increases.
Material Hardship Status
*Note. Material hardship data were only obtained for right after COVID and current situations. Thus, the figures below did not present pre-COVID situations. 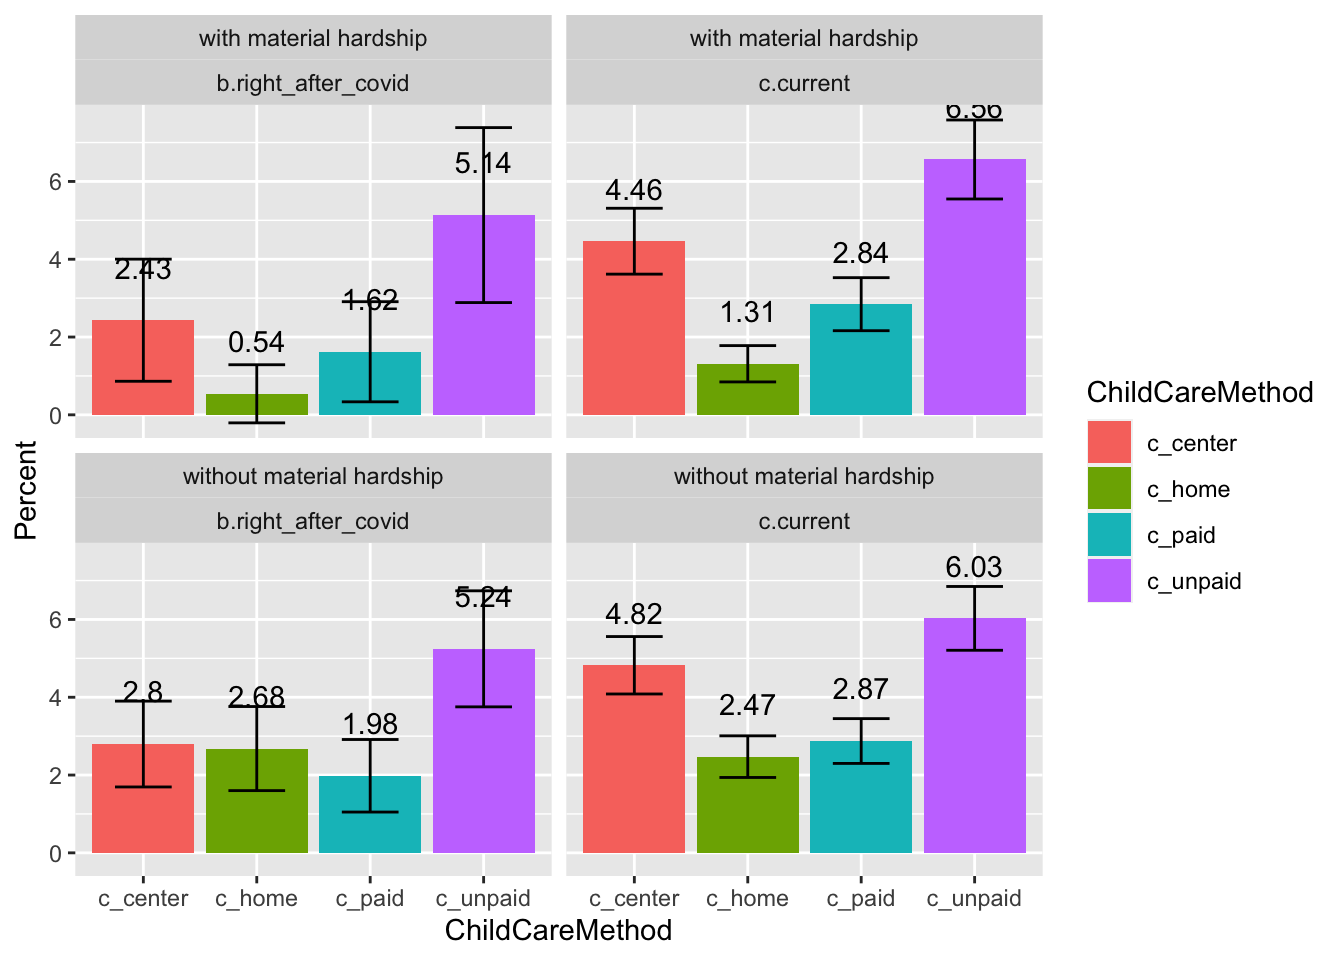
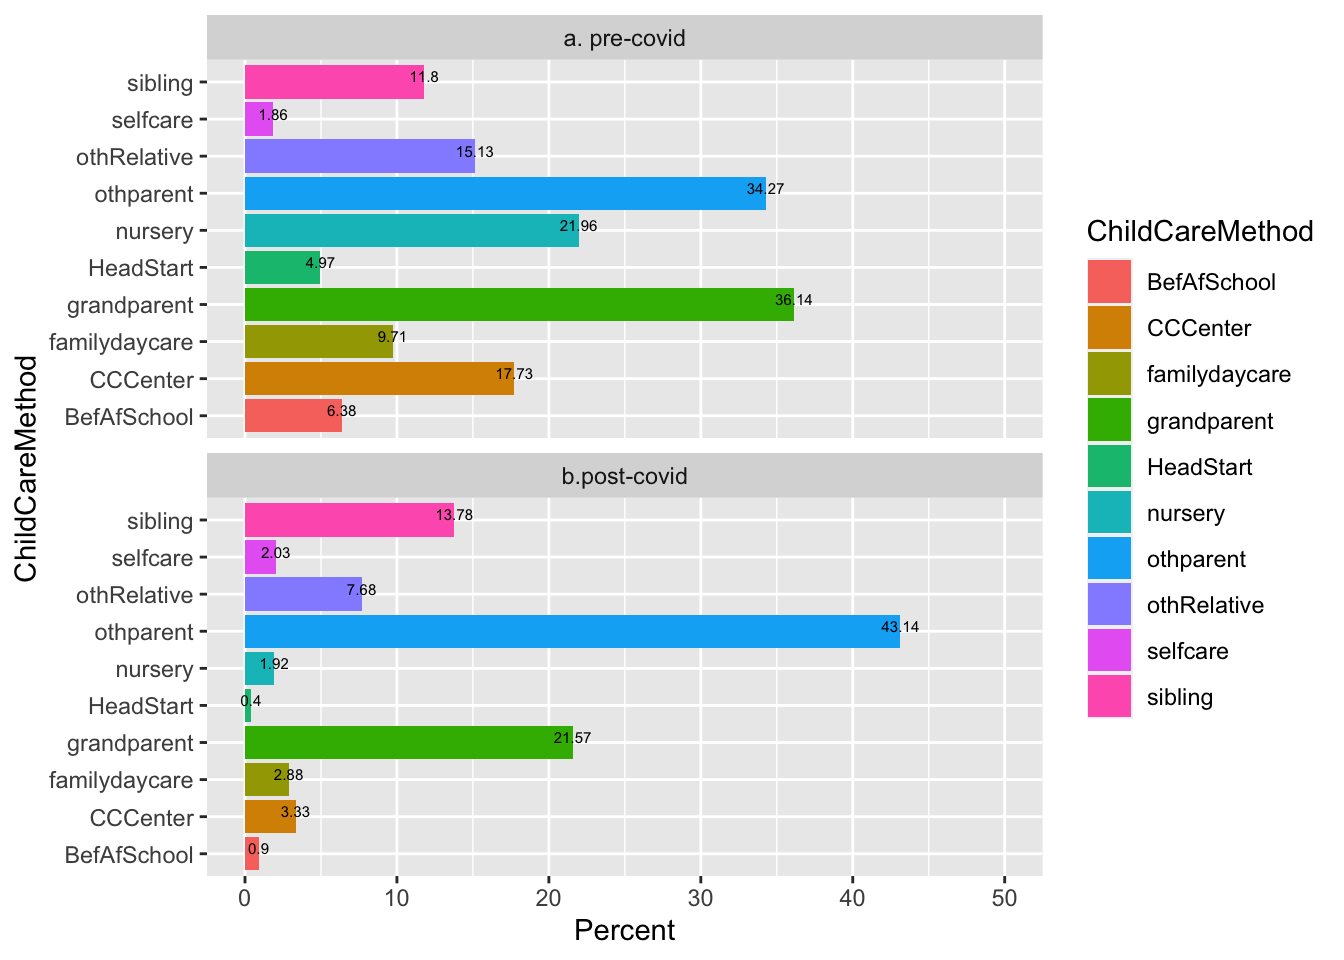
Except for parents, who are taking childcare responsibilites?
*Data based on weeks 1-4, so the “post-covid” results mainly reflect families’ choices of chidcare right after covid.
Total Responses
Caregivers reported large increases in using childcare by other parents, some increases in using siblings, and decreases in using other relatives and center-based childcare such as child care centers, head start program, nursery, family day care, and after-school programs. The percentage of grandparents and child self-care remain the same.
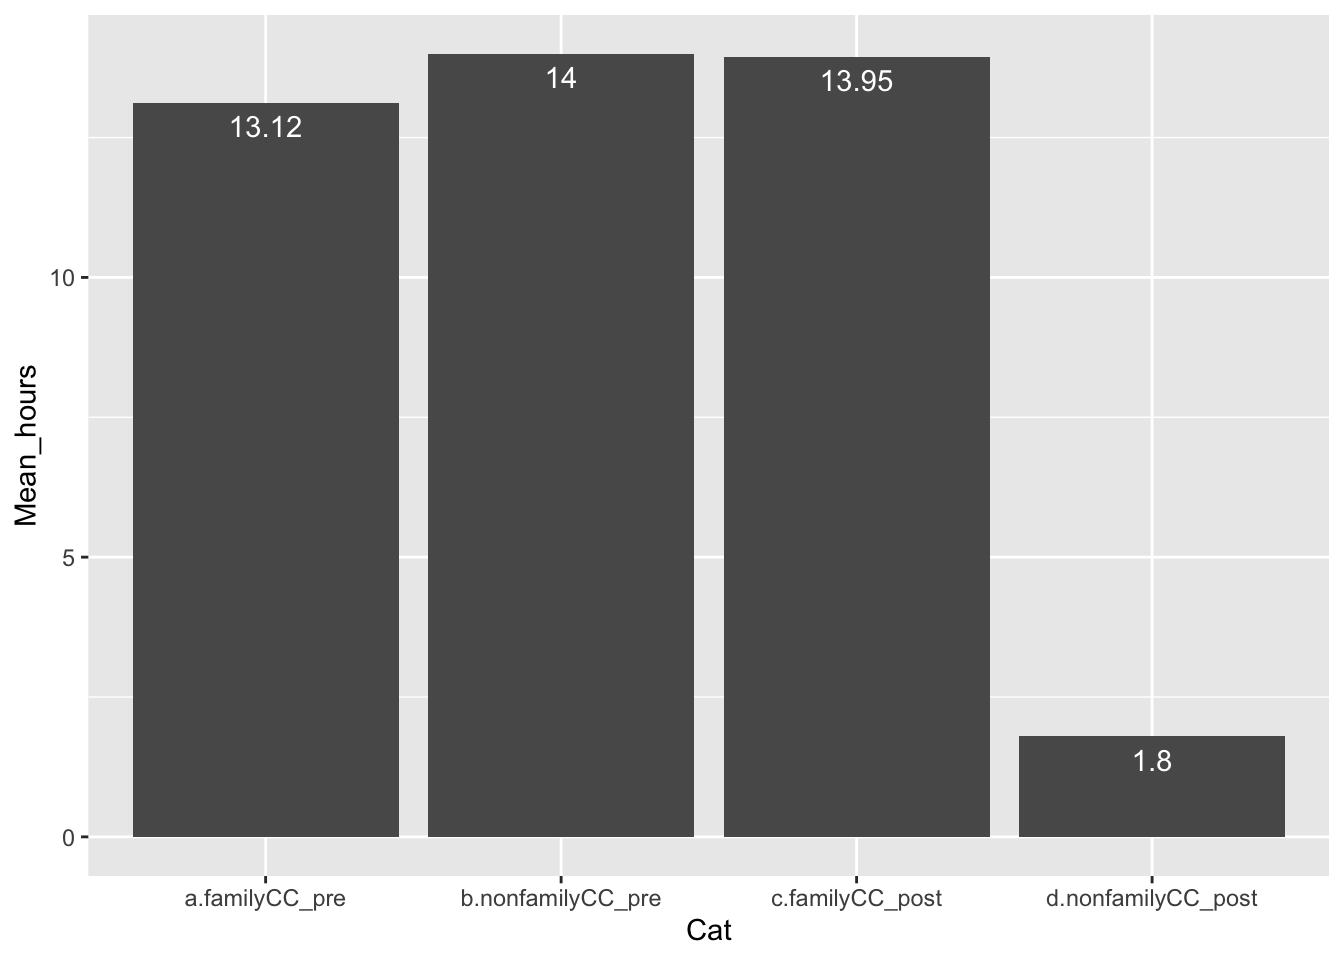
Hours of Using Family vs. Non-Family Non-Parental Child Care
*Data based on data from week 1 to 4.
Mean of Family & Non-family Childcare Hours - Total Responses
From pre- to post-COVID, family-based non-parental childcare significantly increased, and non-family-based non-parental childcare significantly decreased.
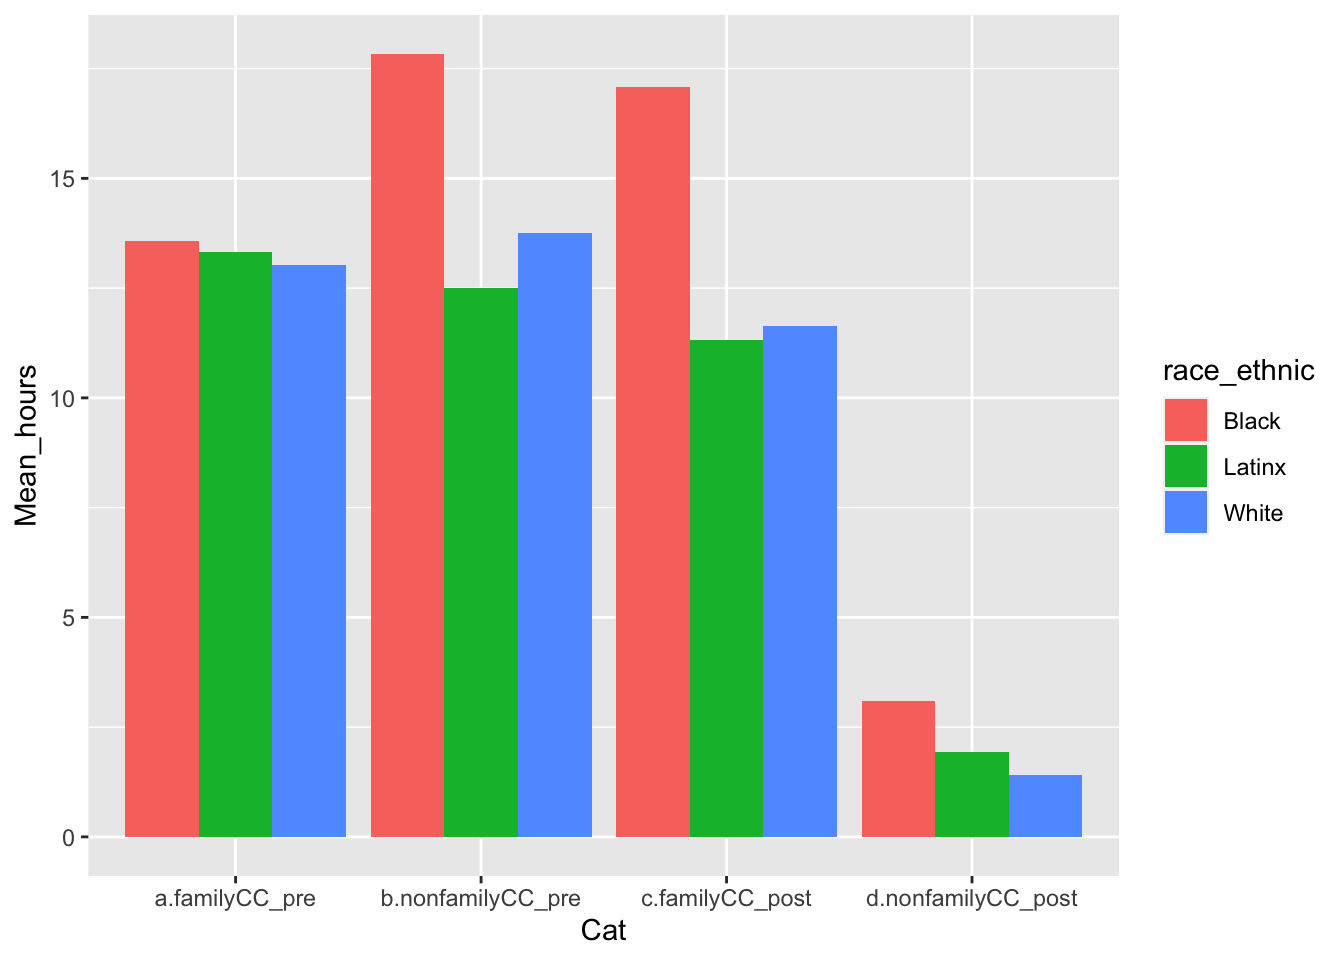
Race/Ethnicity
The trend of changes across three race/ethnic groups was the same. Black families reported more hours of using family- and non-family-based childcare before COVID, and more hours of using family-based childcare after COVID.
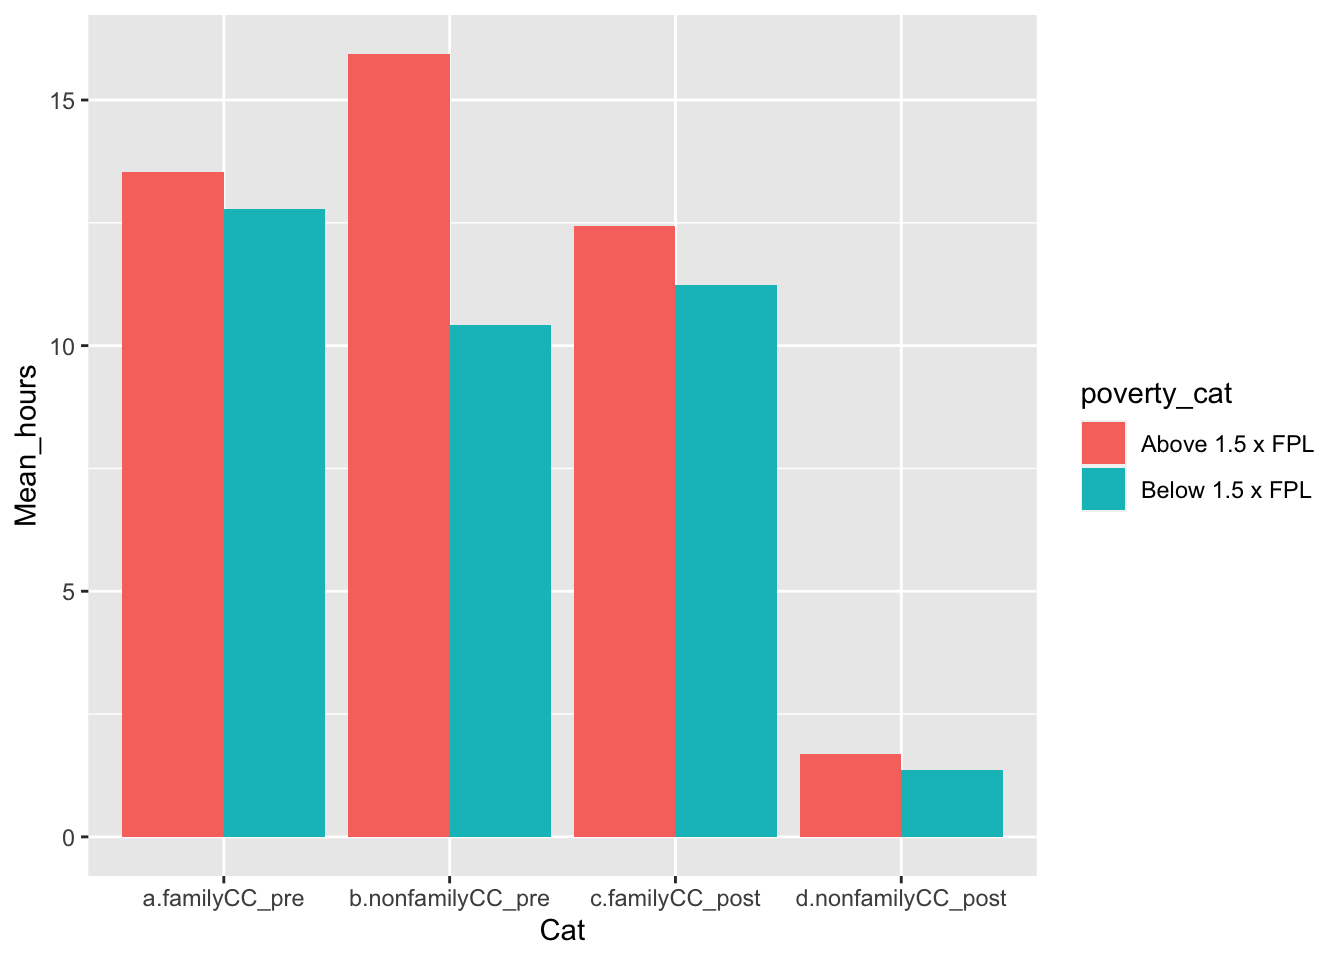
Income
The trend of changes for low- and high-income families was generally similar. low-income familes reported using fewer hours of nonfamily-based childcare before COVID19 compared to high-income families.
Income & Race/Ethnicity
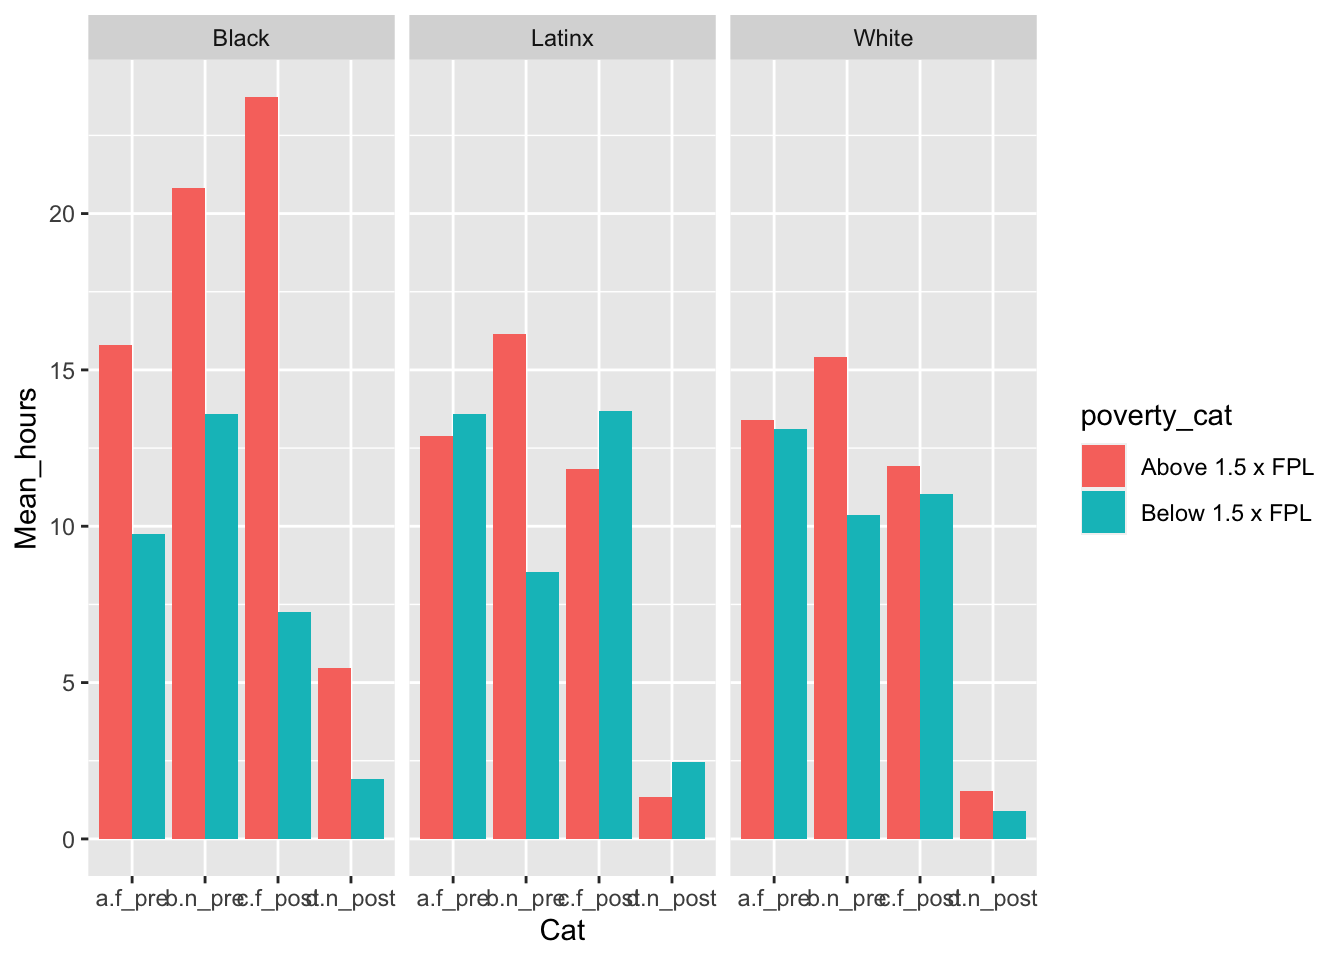
*Note. f_pre = family child care - pre-COVID19; n_pre = non-family child care - pre-COVID19; f_post = family child care - post-COVID19; n_post = family child care - post-COVID19.
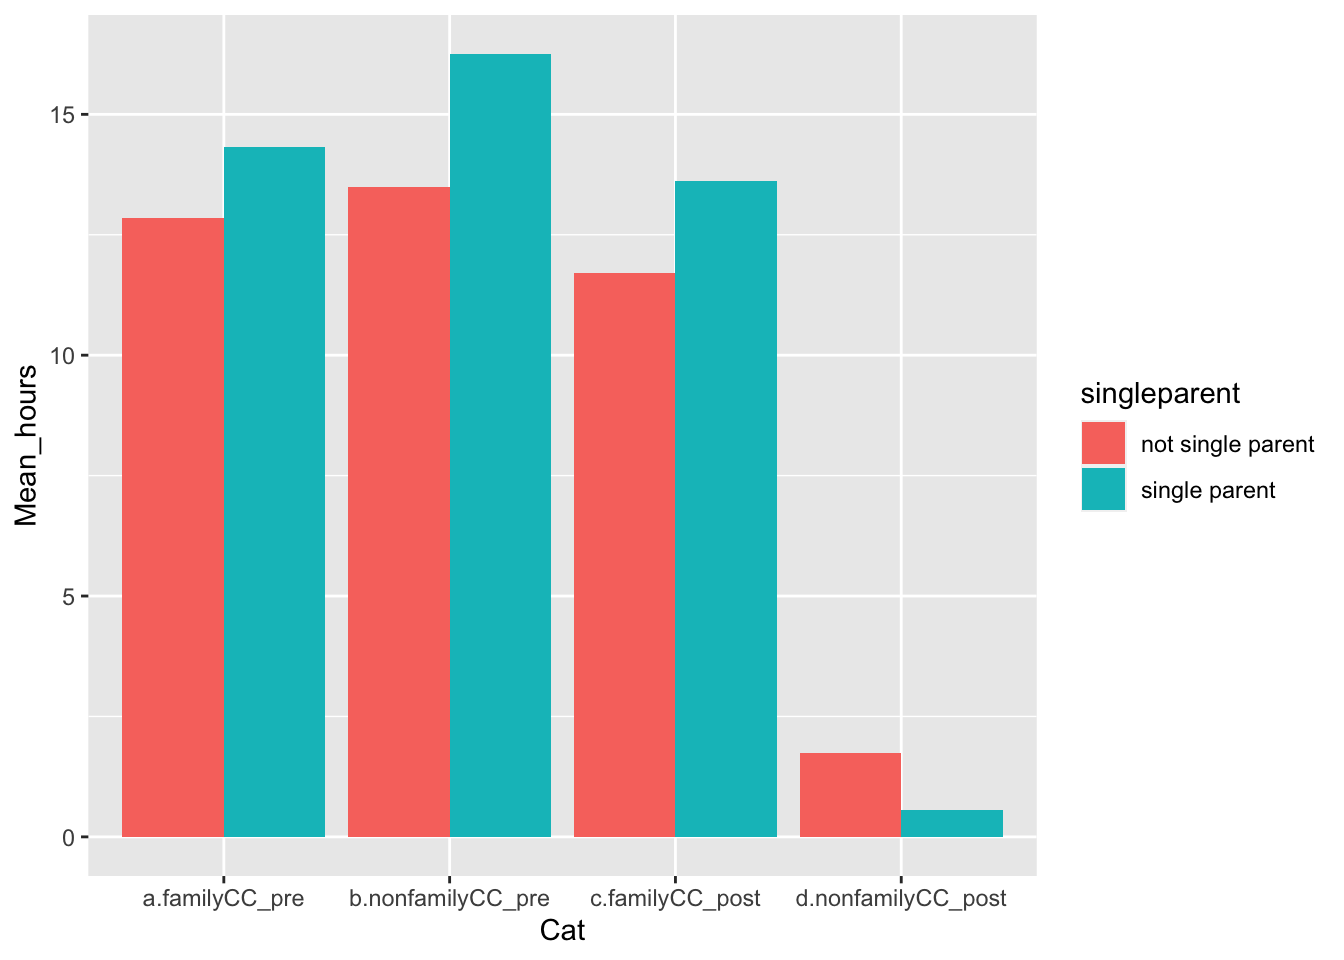
Single Parental Status
Single parents reported using more hours of family- and non-family-based childcare before COVID, compared to non single parents. However, after COVID, these differences were diminished.
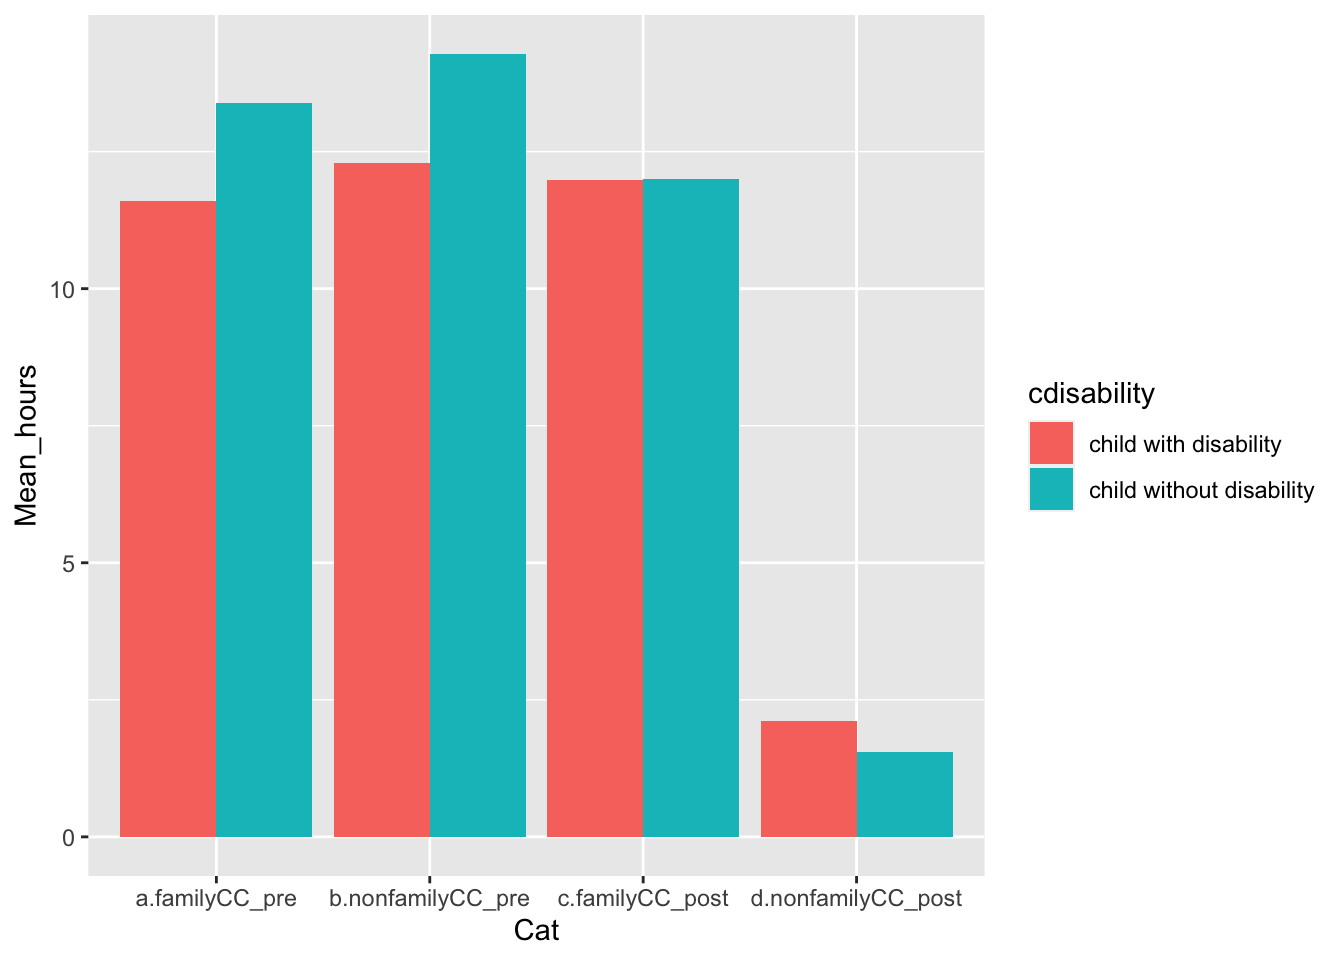
Child Disability Status
Families with children with disability used slightly fewer hours of nonparental childcare (both family and nonfamily based) compared to families of children without disability, during both pre- and post-COVID.
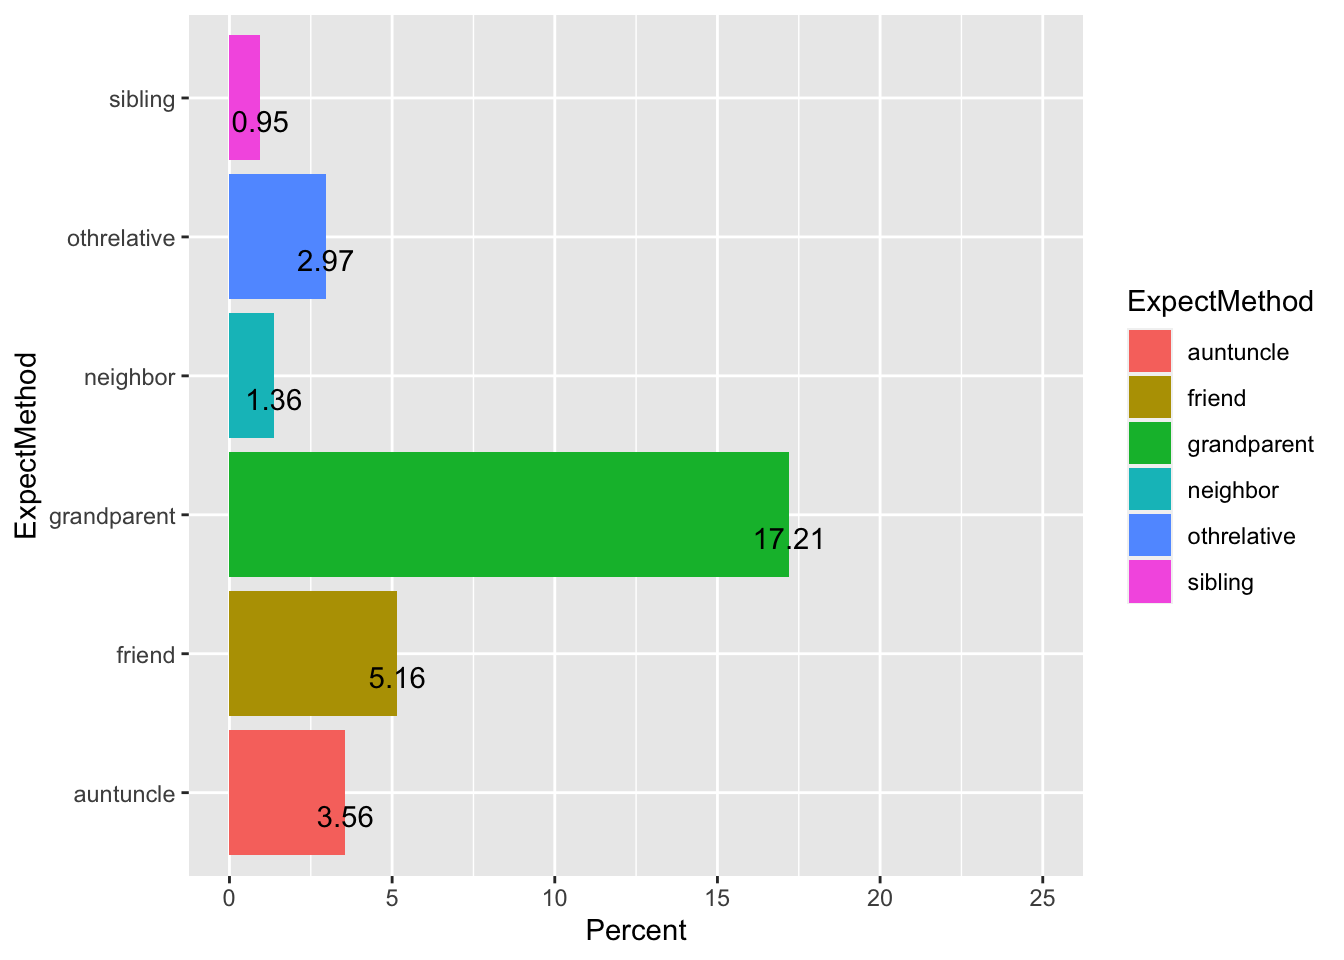
Who Parents Are Expecting to Provide Childcare?
*Based on Data Collected from Weeks 7 & 8
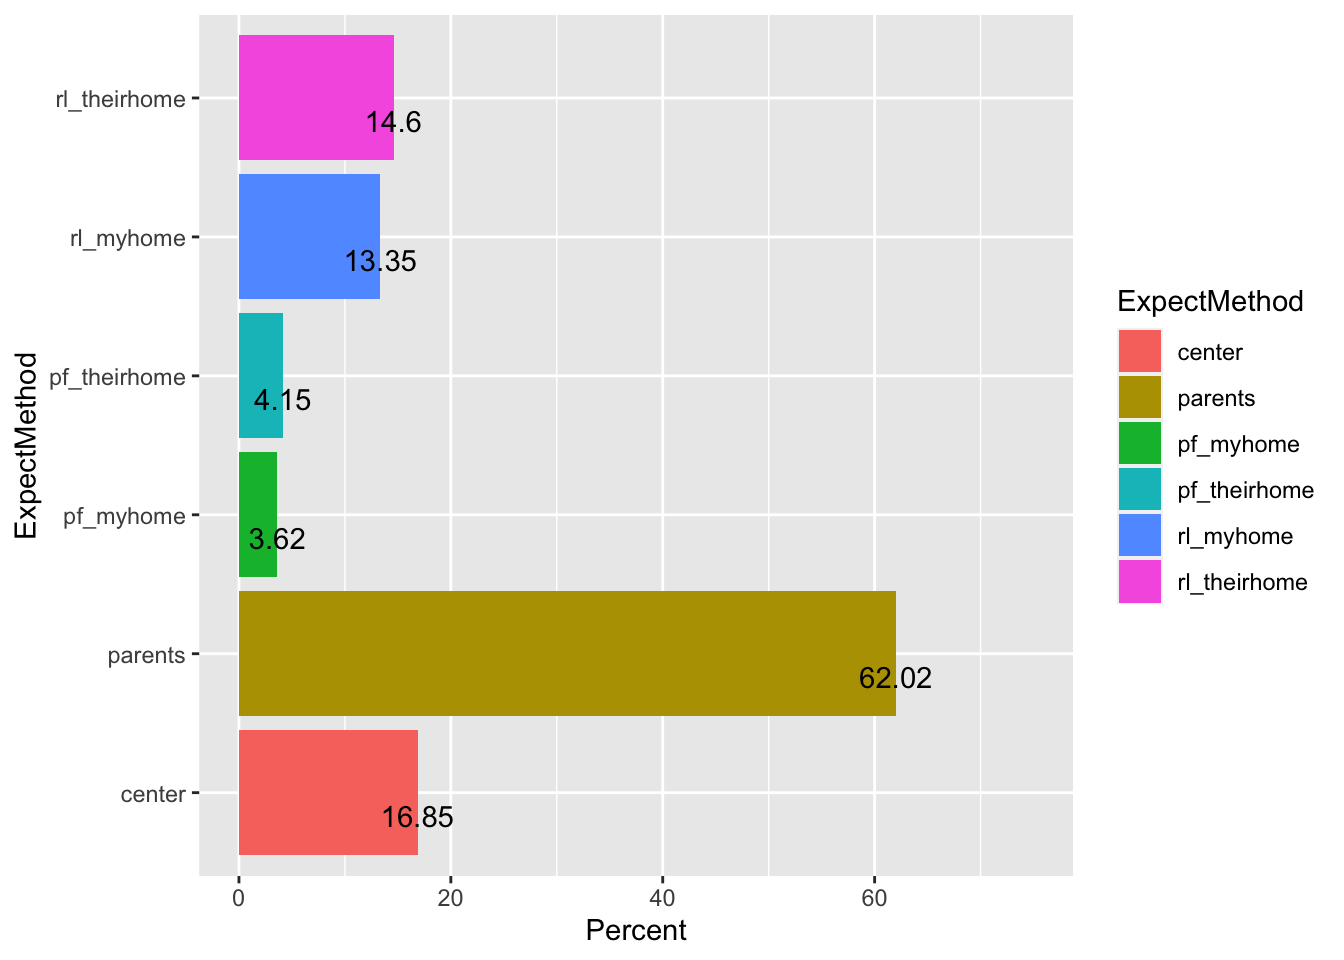 *Note. center = childcare center; rl_myhome = relatives at the caregivers’ home; rl_theirhome = relatives at their home; pf_myhome = professional child provider at the caregivers’ home; pf_theirhome = professional childcare provider in their home; parents = the child’s parents/legal gardians.
The Relationship Between Child and Childcare Provider - Among All Respondents of Week 7 & 8