Food Insecurity
Sihong
11/13/2020
Food Insecurity Descriptive Analyses - Percentage of Food Insecurity Families
- Questions: For these following statements, please indicate whether the statement was often true, sometimes true, or never true for your household prior to/since the coronavirus (COVID-19) pandemic:
- The food that we bought just didn’t last, and we didn’t have money to get more (often true/sometimes true/never true)
- We couldn’t afford to eat balanced meals (often true/sometimes true/never true)
- Did you or other adult in your household ever cut the size of your meal or skip meals because there wasn’t enough money for food? (yes/no) - if yes, how often did this happen? (almost every month/some months but not every month/in only 1 or 2 months)
- Did you ever eat less than you felt you should because there wasn’t enough money for food? (yes/no)
- Were you ever hungry but didn’t eat because there wasn’t enough money for food? (yes/no)
- The food that we bought just didn’t last, and we didn’t have money to get more (often true/sometimes true/never true)
- Note. Food insecurity data were collected on weeks 19, 21, 23, 25, 27, & 31 follow-up surveys.
Between-Subject Analyses
- Note: analyses based on participants’ most recent responses
Overall
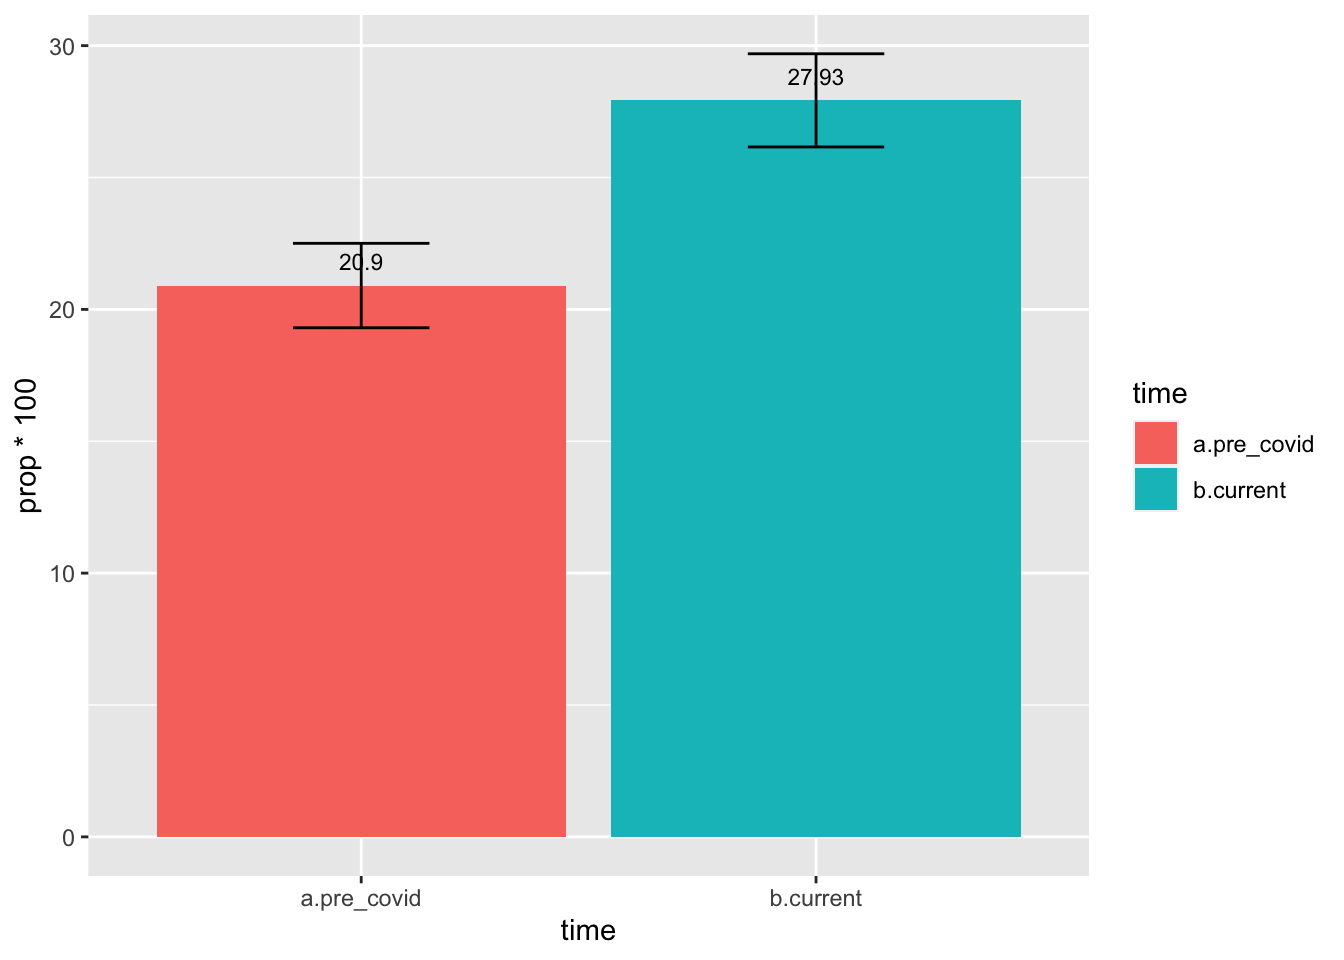
- Significantly higher percentage of families reported experiencing food insecurity currently (27.61%) compared to pre-COVID-19 (20.72%)
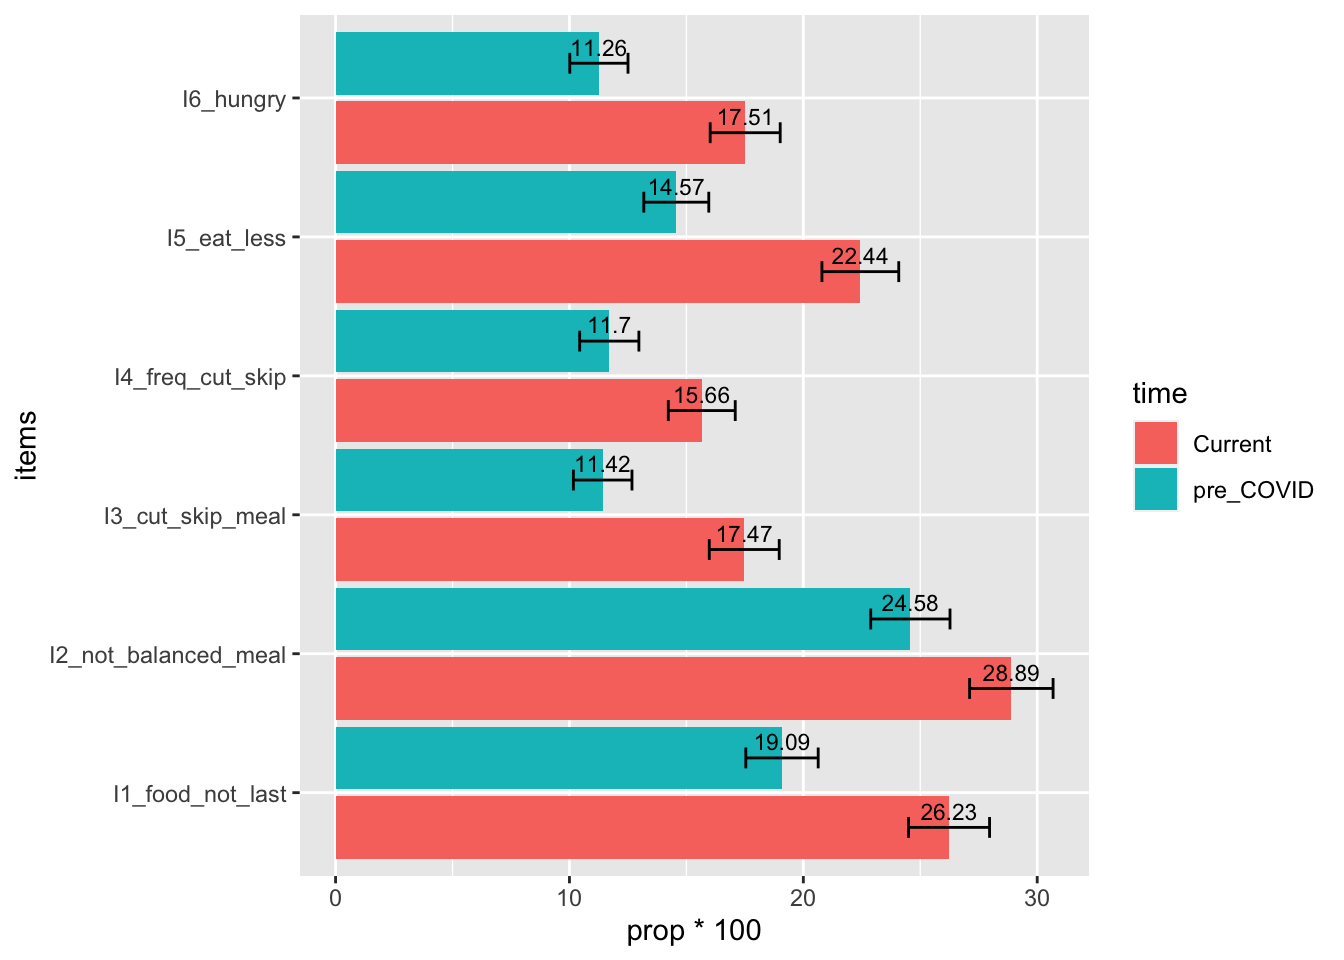
Item-Level Descriptives
Item 1: The food that we bought just didn’t last, and we didn’t have money to get more (coded as 1 = often/sometimes true, 0 = never true)
Item 2: We couldn’t afford to eat balanced meals (coded as 1 = often/sometimes true, 0 = never true)
Item 3: Did you or other adult in your household ever cut the size of your meal or skip meals because there wasn’t enough money for food? (coded as 1 = yes, 0 = no)
Item 4: Frequency of item 3 (coded as 1 = almost every month / some months but not every month, and 0 = only 1 or 2 months)
Item 5: Did you ever eat less than you felt you should because there wasn’t enough money for food? (coded as 1 = yes, 0 = no)
Item 6: Were you ever hungry but didn’t eat because there wasn’t enough money for food? (coded as 1 = yes, 0 = no)
Results showed that all items had significant increases from pre-COVID to current situation.
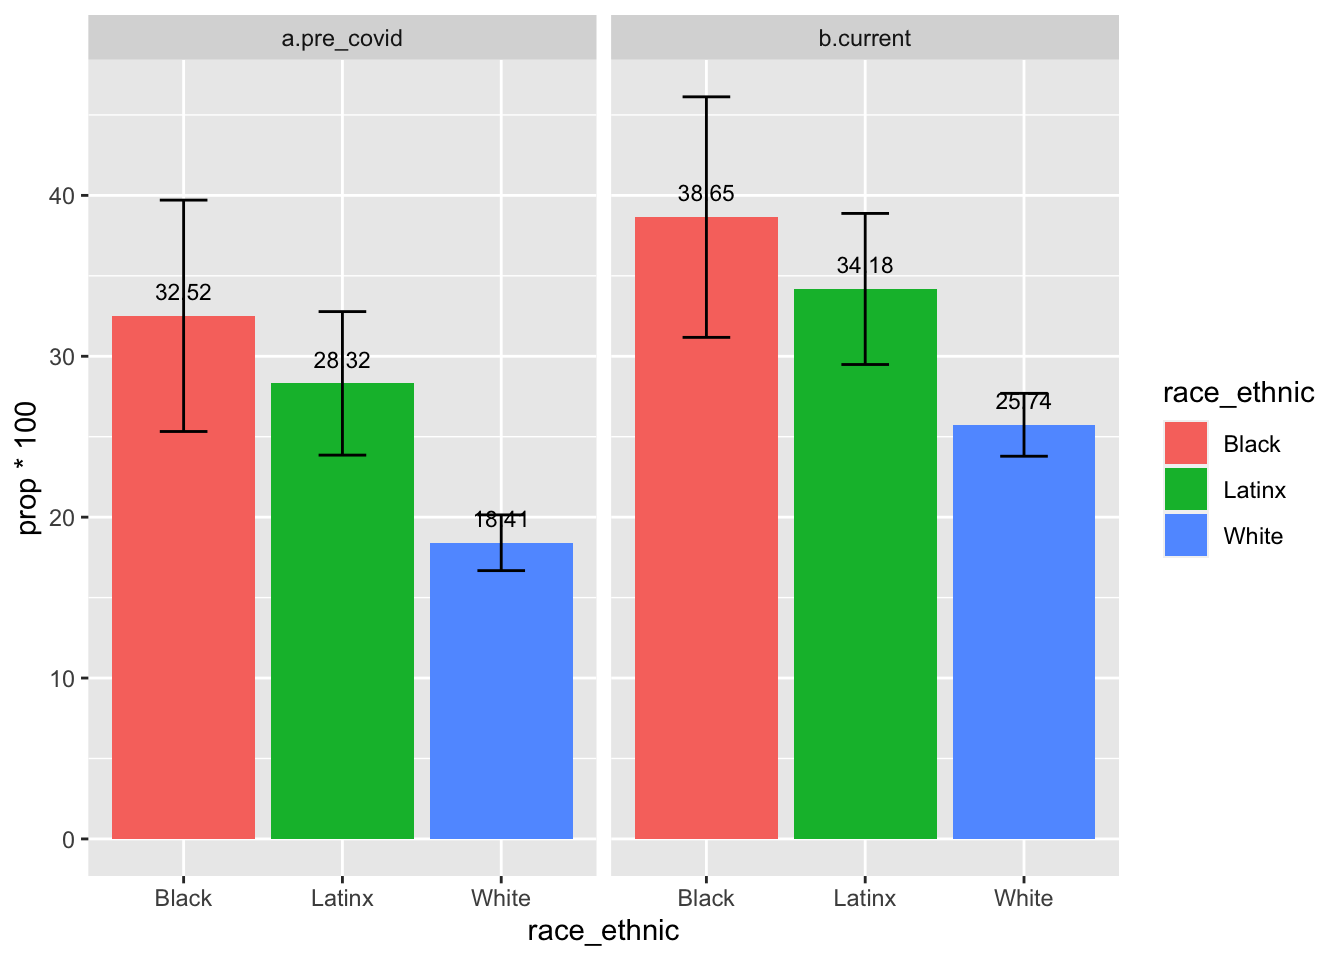
By Race/Ethnicity Groups
- During both pre-COVID-19 and current situation, significantly smaller percentage of White families experienced food insecurity compared to Black and Latinx families
- The percentage of food insecurity in Black, Latinx, and White families all increased from pre-COVID to current. However, only White families’ increases were statistically significant.
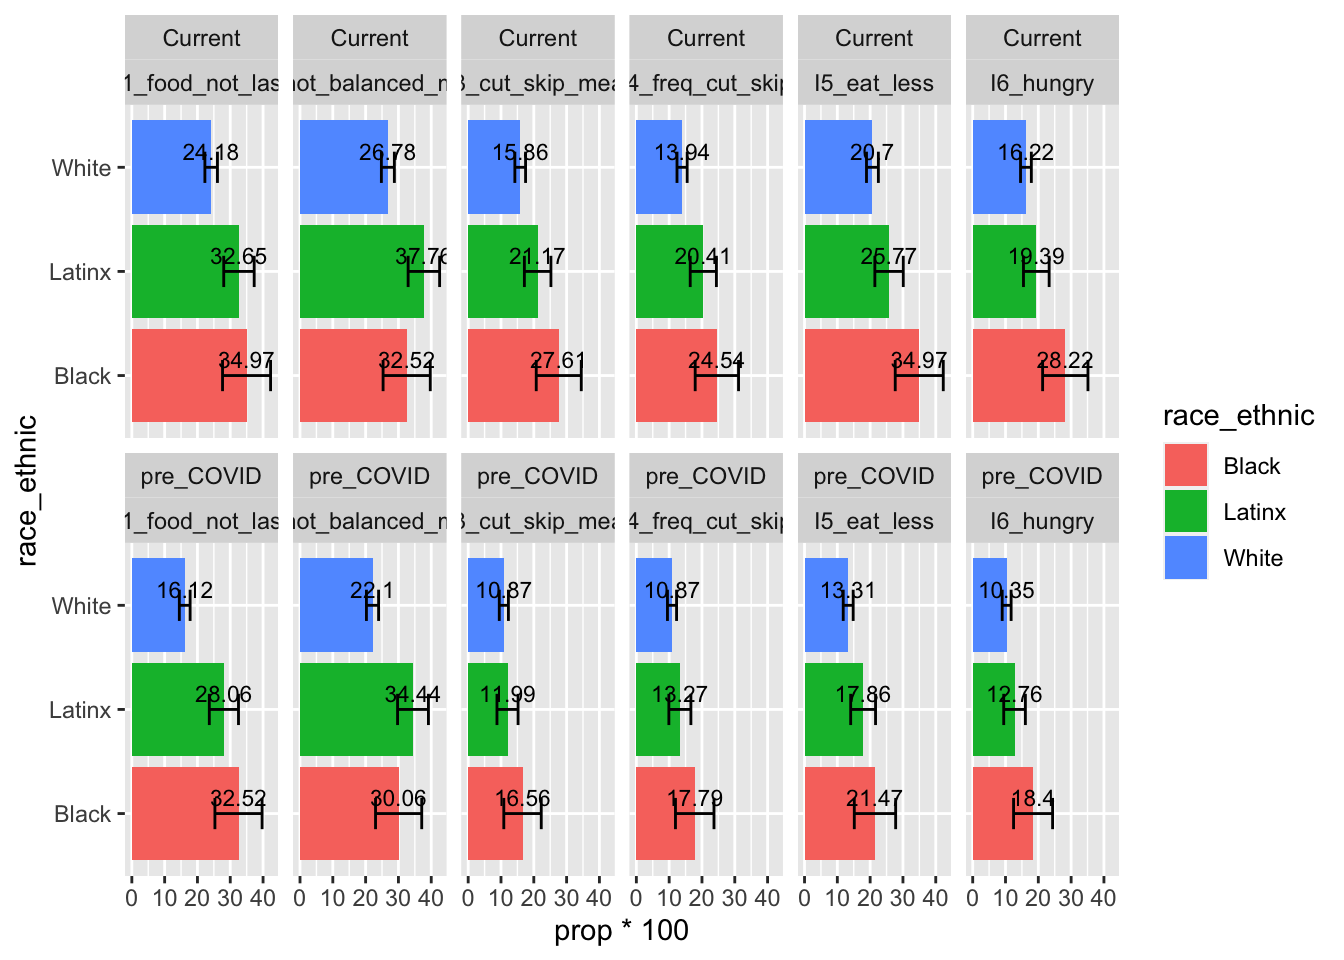
Item-Level Descriptives
- Lower percentage of White families reported experiencing the six items of food insecurity compared to Black and/or Latinx families. The differences were specifically significant (or marginally significant) between White and Black families.
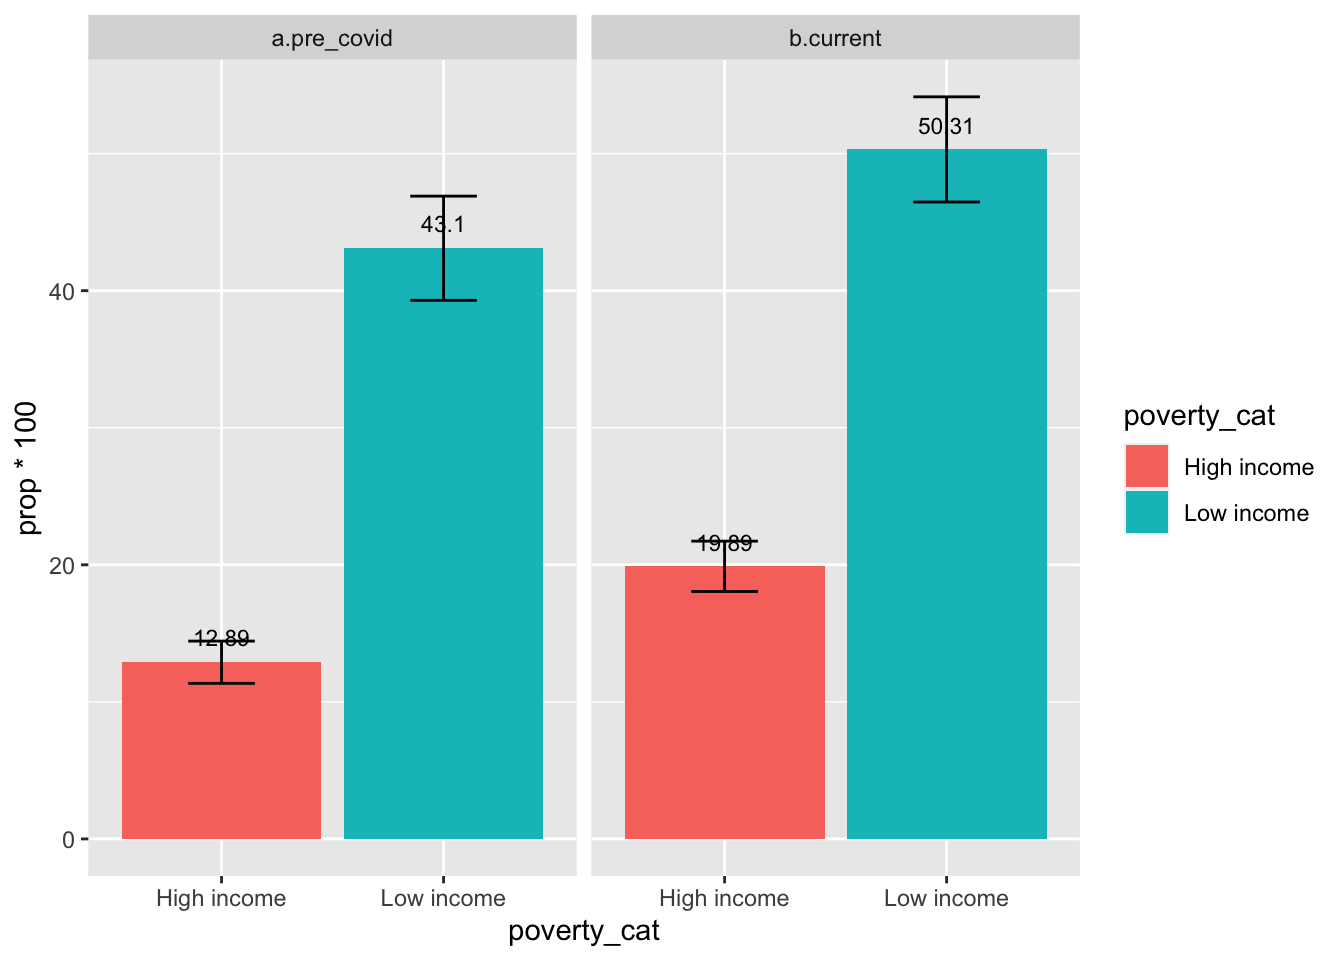
By Poverty Level
- During both pre-COVID-19 and current situation, significantly larger percentage of low-income families experienced food insecurity compared to high-income families
- The percentage of food insecurity in low-income and high-income families both significantly increased from pre-COVID to current.
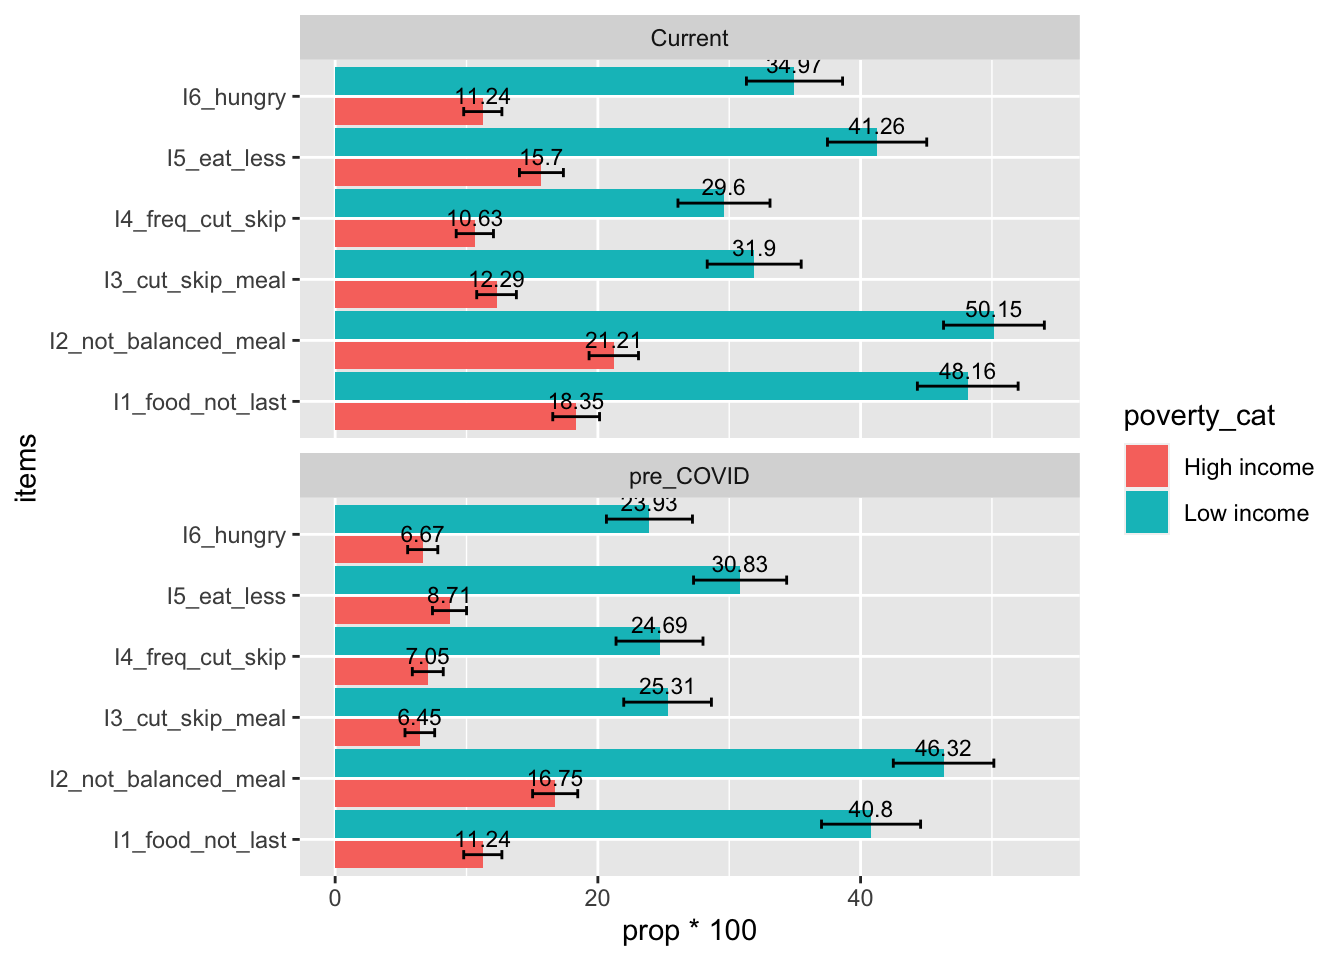
Item-Level Descriptives
- Significantly higher percentage of low-income families reported experiencing the six items of food insecurity compared to high-income families
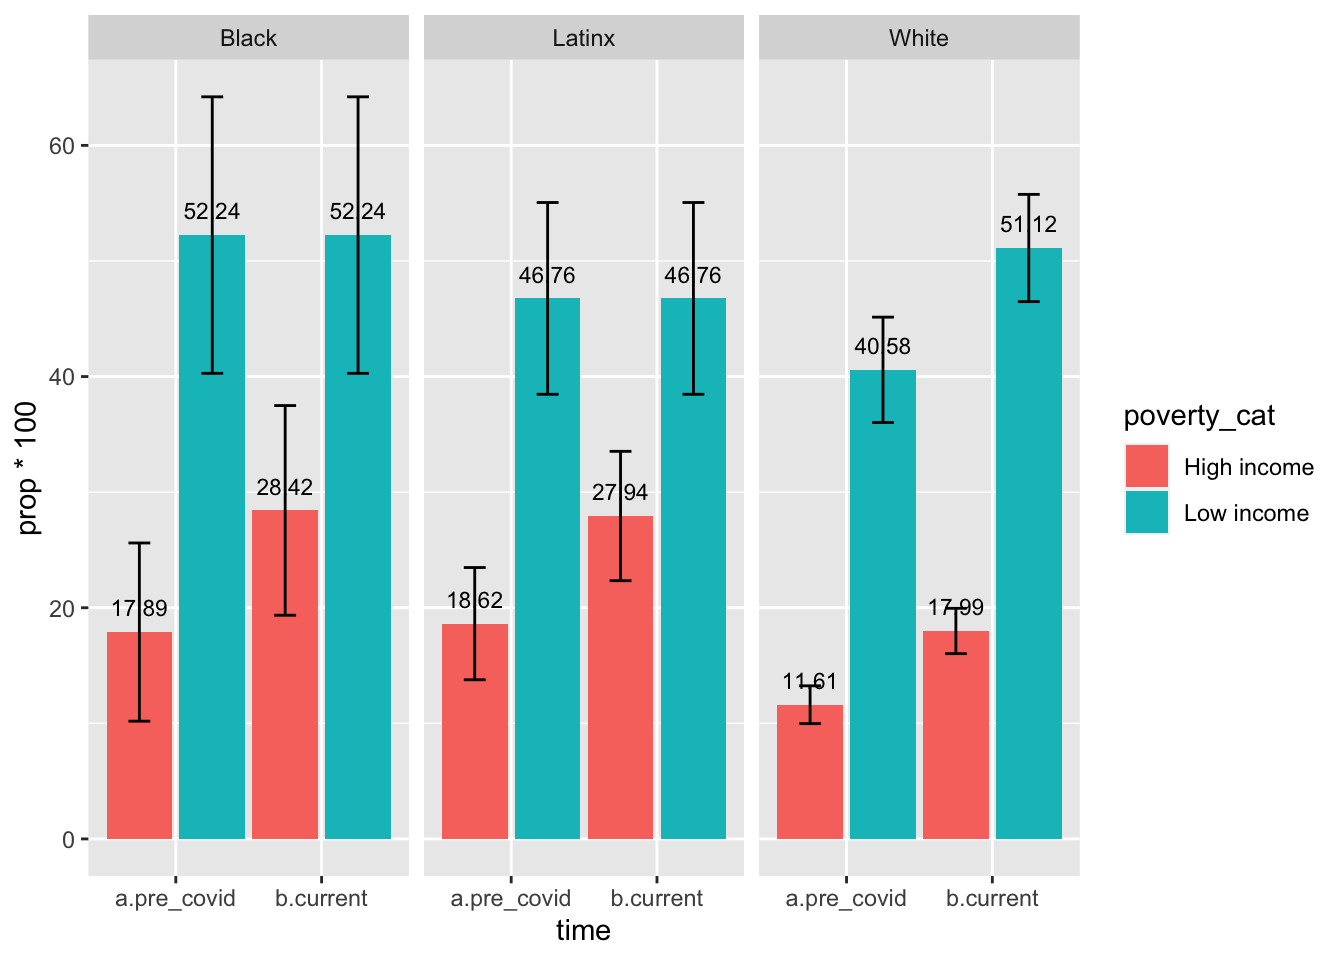
By Poverty Level & Race/Ethnicity
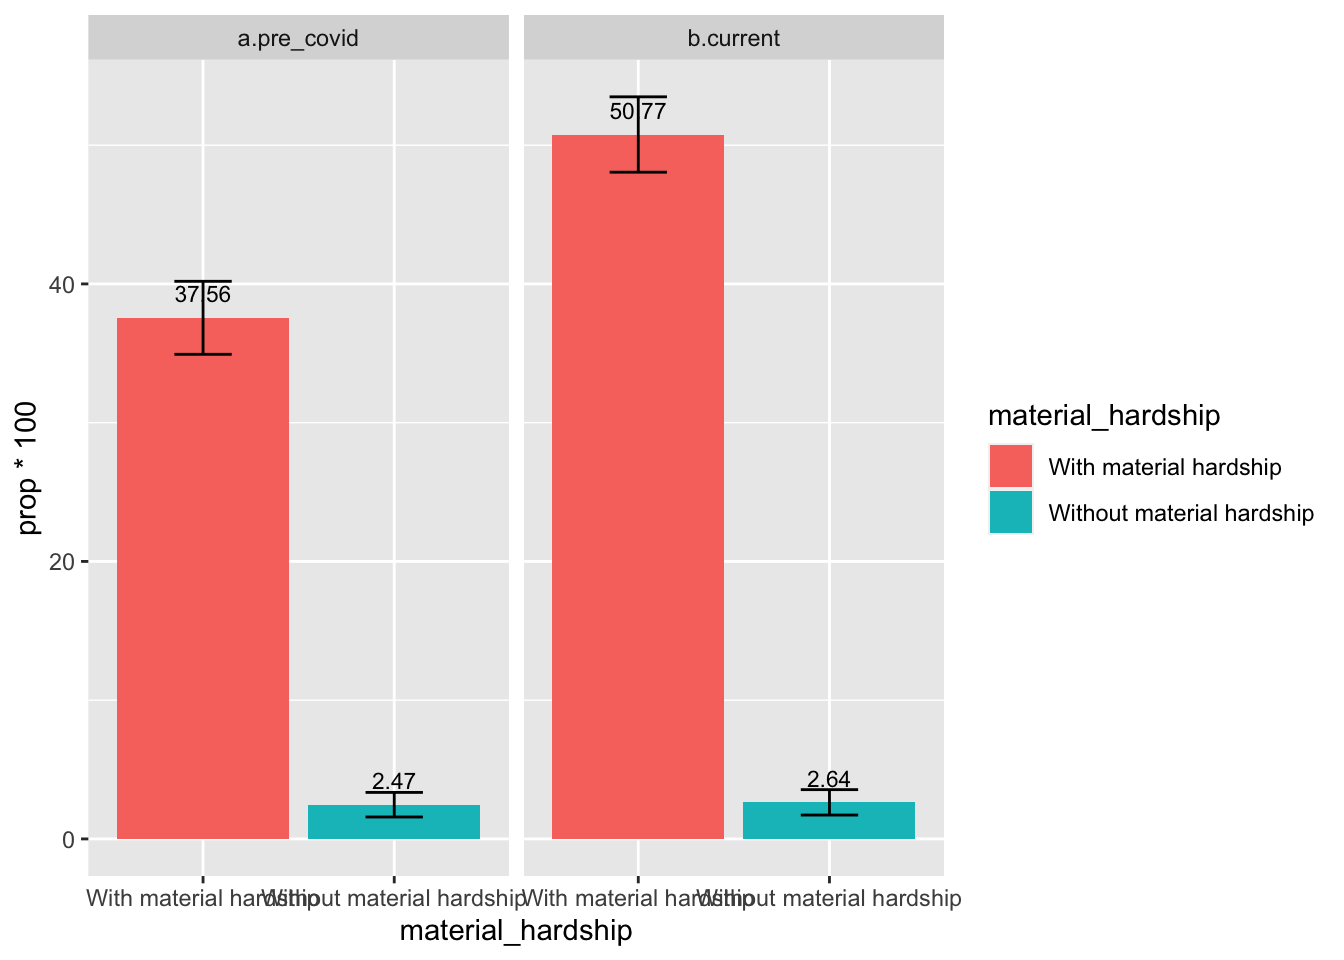
By Material Hardship Status
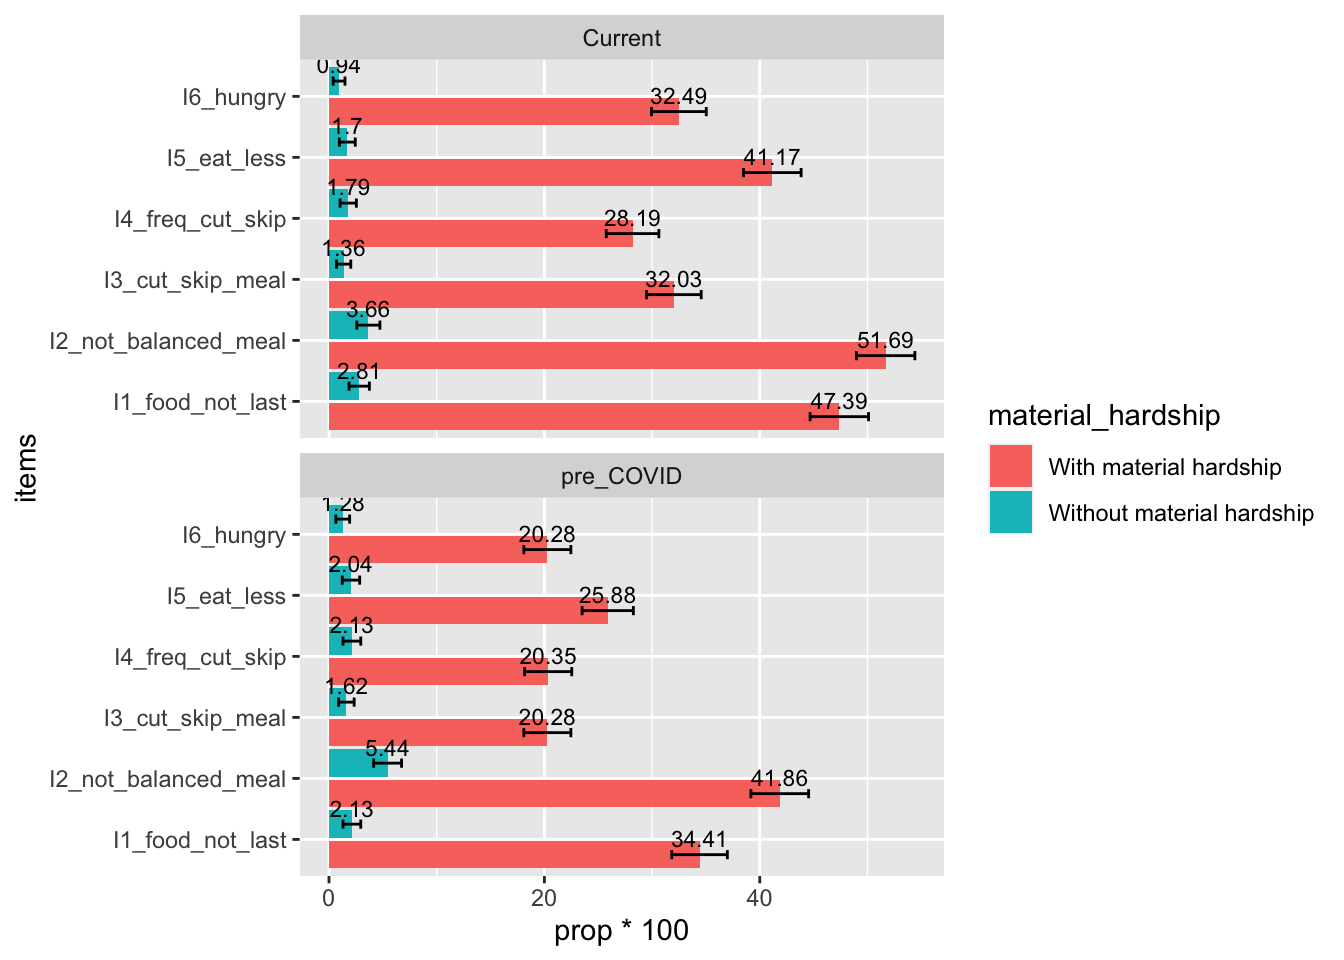
- During both pre-COVID-19 and current situation, significantly larger percentage of families with material hardship experienced food insecurity compared to families without material hardship
- The percentage of food insecurity in families with material hardship significantly increased from pre-COVID to current.
Item-Level Descriptives
- Significantly higher percentage of families with material hardship reported experiencing the six items of food insecurity compared to families without material hardship
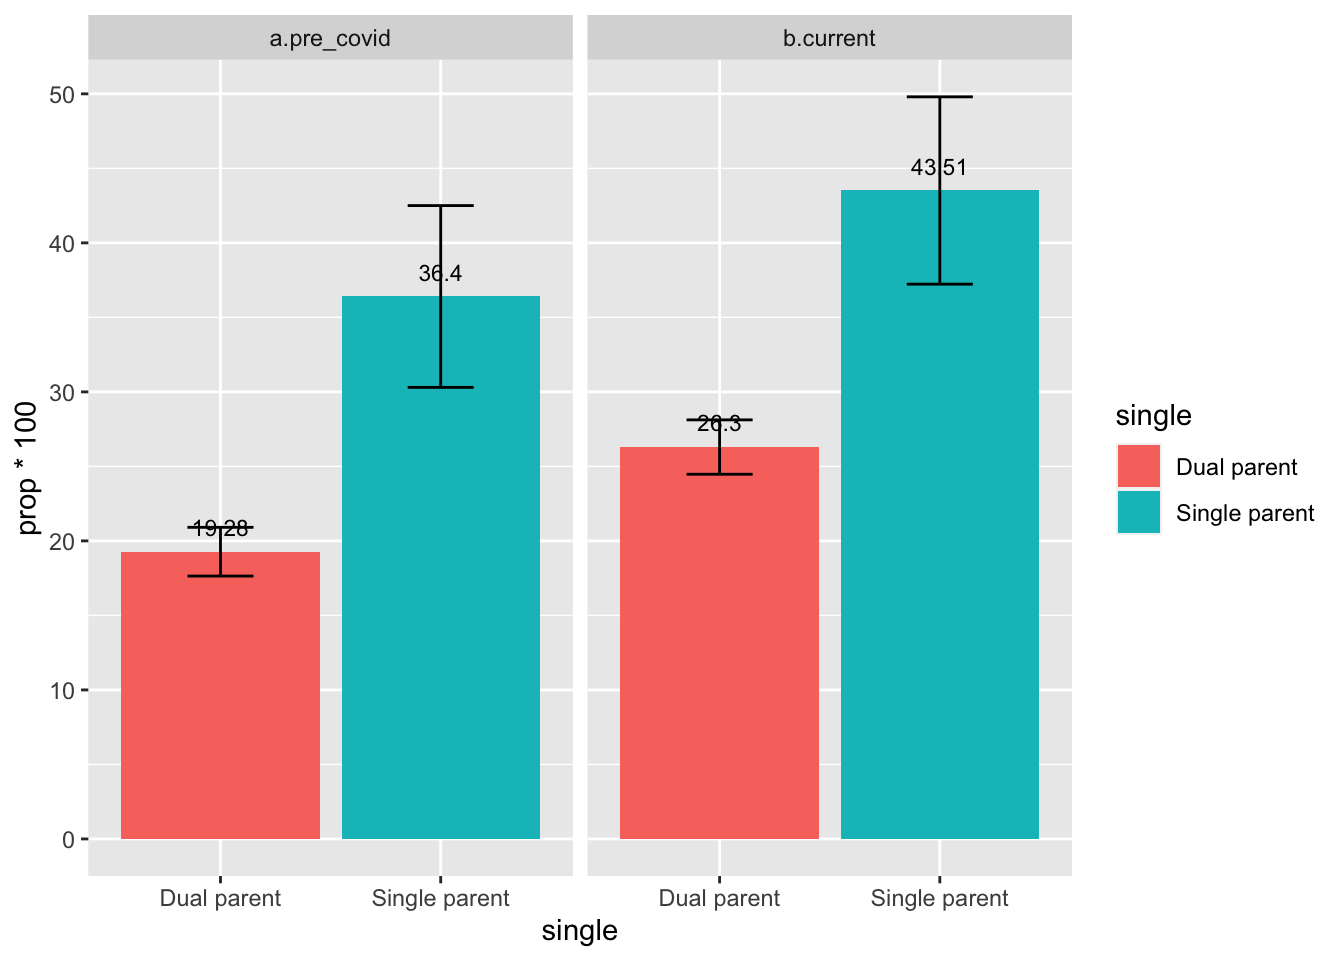
By Single Parent Status
- During both pre-COVID-19 and current situation, significantly larger percentage of single-parent families experienced food insecurity compared to dual-parent families
- The percentage of food insecurity in dual-parent families significantly increased from pre-COVID to current; the increase of food insecurity percentage in single-parent household was marginally significant
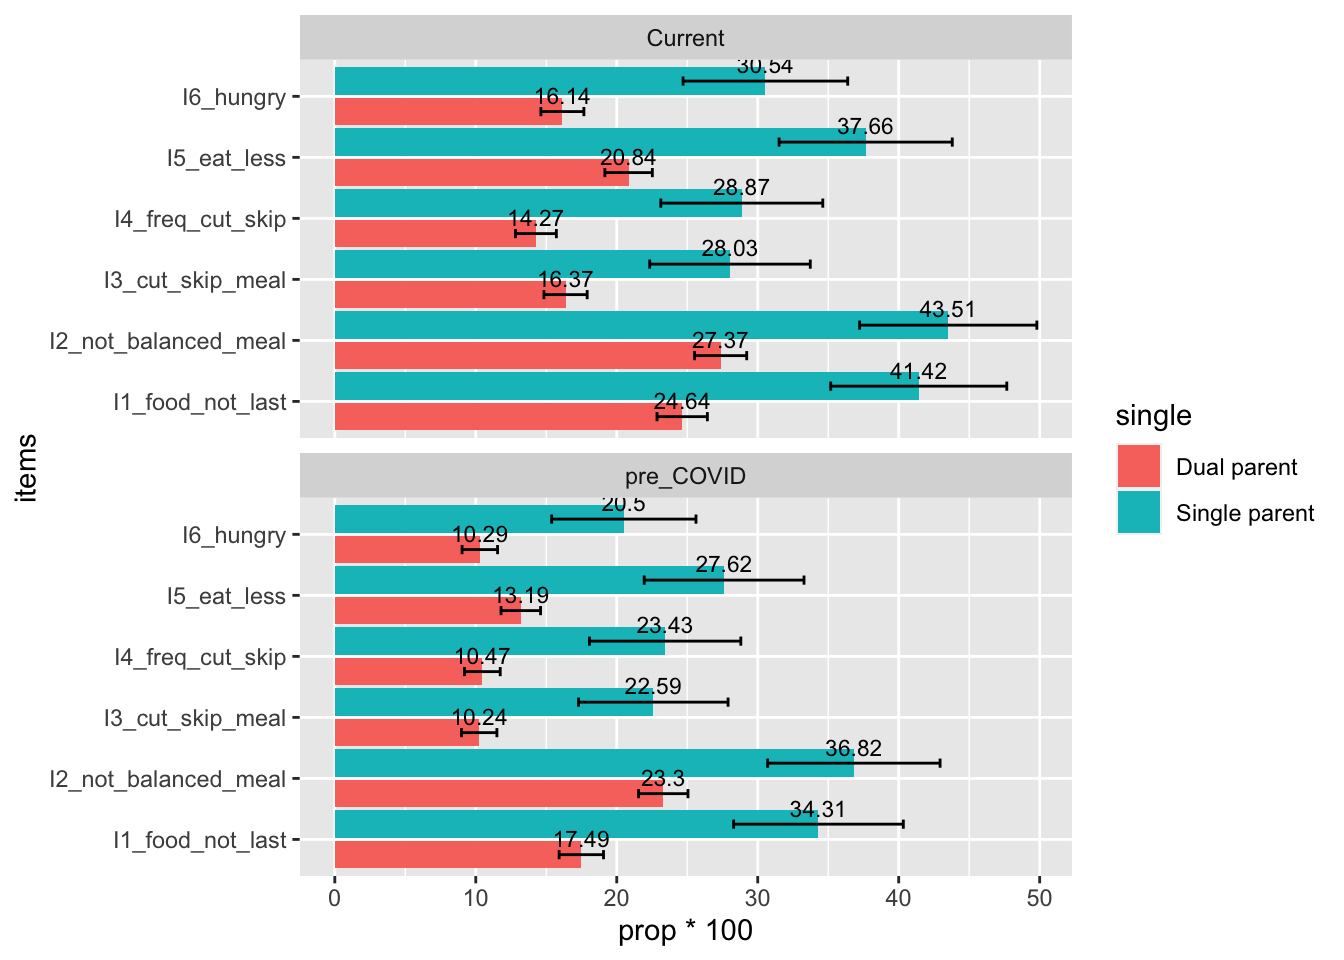
Item-Level Descriptives
- Significantly higher percentage of single-parent household reported experiencing the six items of food insecurity compared to dual-parent household
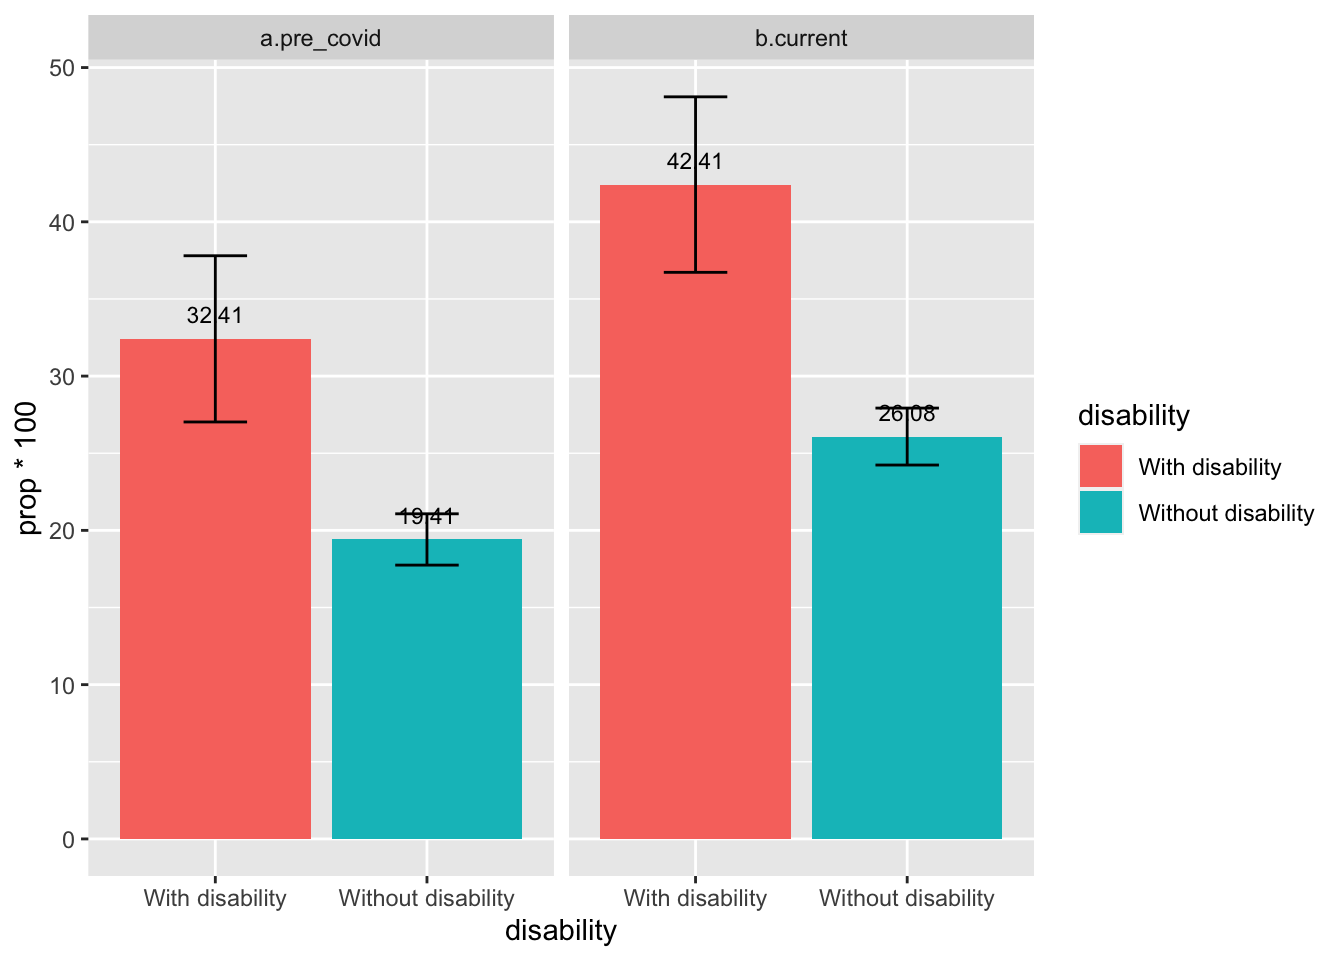
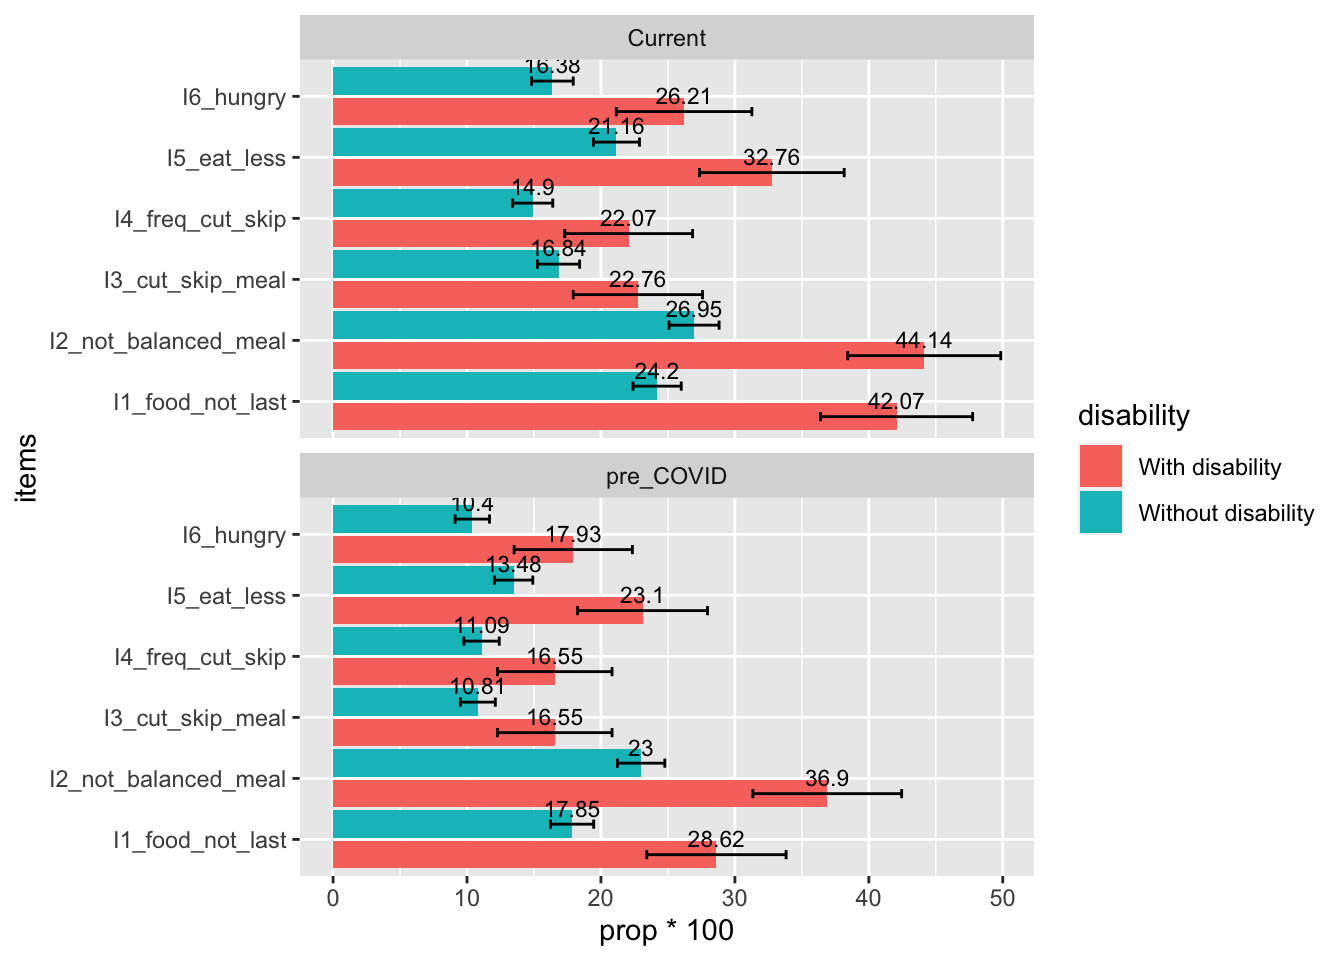
By Children with Special Needs Status
- During both pre-COVID-19 and current situation, significantly larger percentage of families of children with special needs experienced food insecurity compared to families of children without special needs
- The percentage of food insecurity in families of children without special needs significantly increased from pre-COVID to current; the increase of food insecurity percentage in families of children with special needs was marginally significant
Item-Level Descriptives
- Significantly higher percentage of families of children with special needs reported experiencing the six items of food insecurity compared to families of children without special needs
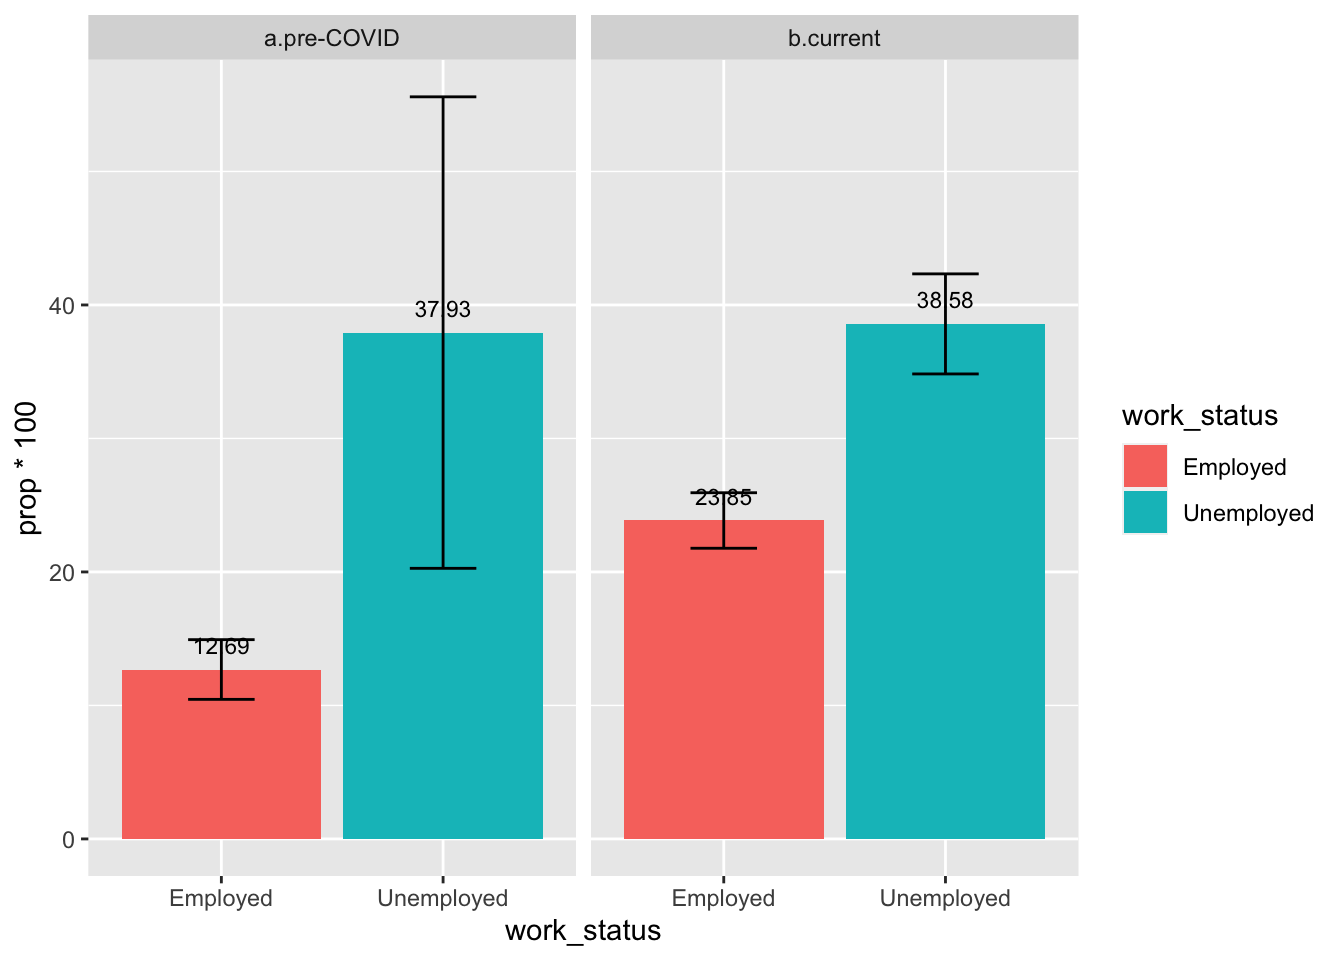
By Caregivers’ Employment Status
- During both pre-COVID-19 and current situation, significantly larger percentage of unemployed caregivers reported food insecurity compared to employed caregivers
- The percentage of food insecurity in families with employed caregivers significantly increased from pre-COVID to current; the increase of food insecurity percentage in families with unemployed caregivers was positive but not statistically significant (due to the small sample size of unemployed caregiers during pre-COVID)
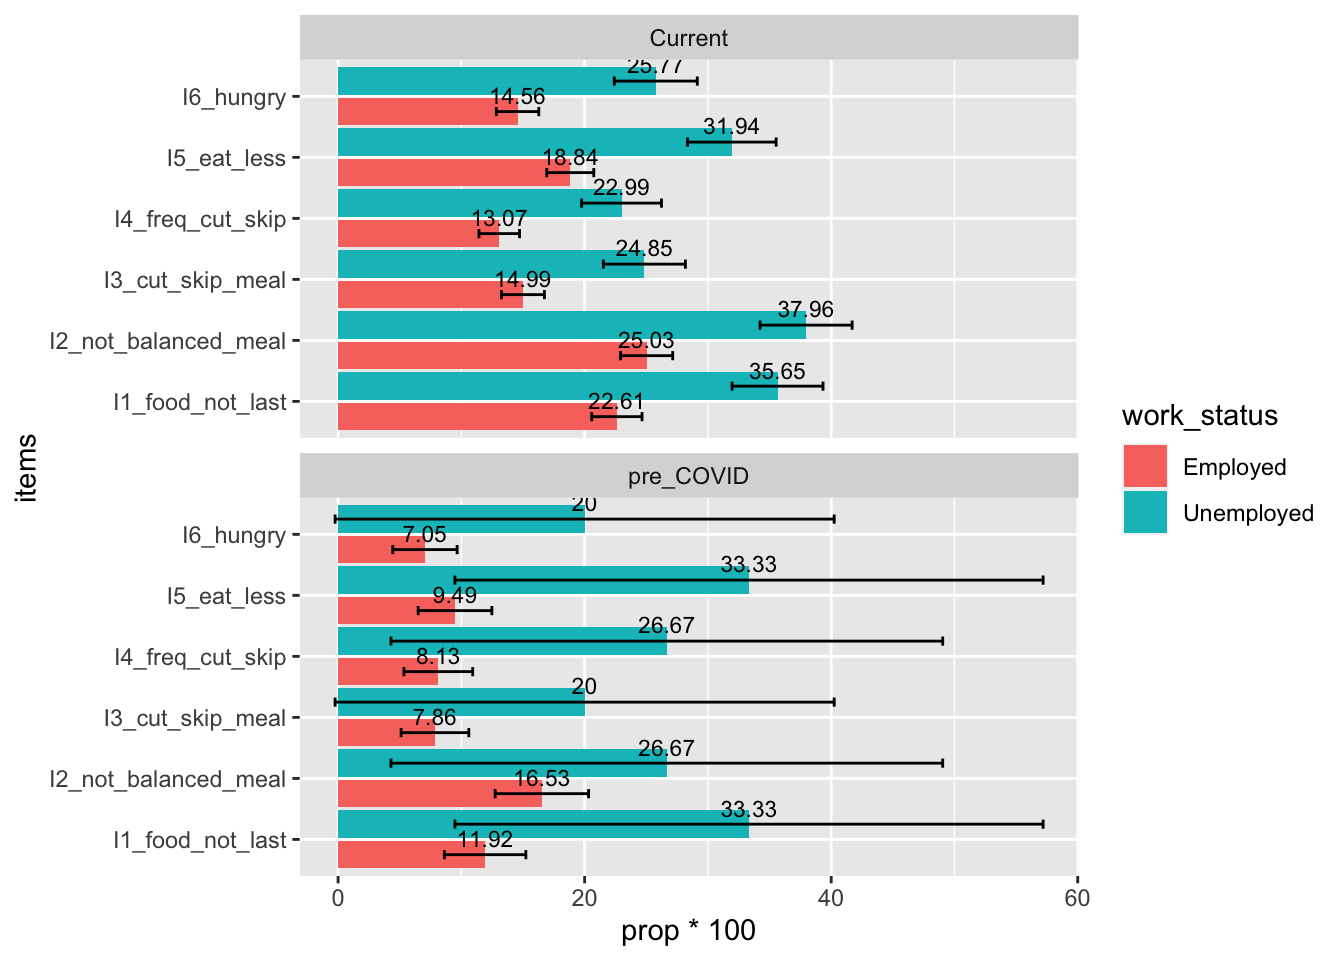
Item-Level Descriptives
- Significantly higher percentage of unemployed caregivers reported experiencing the six items of food insecurity compared to employed caregivers
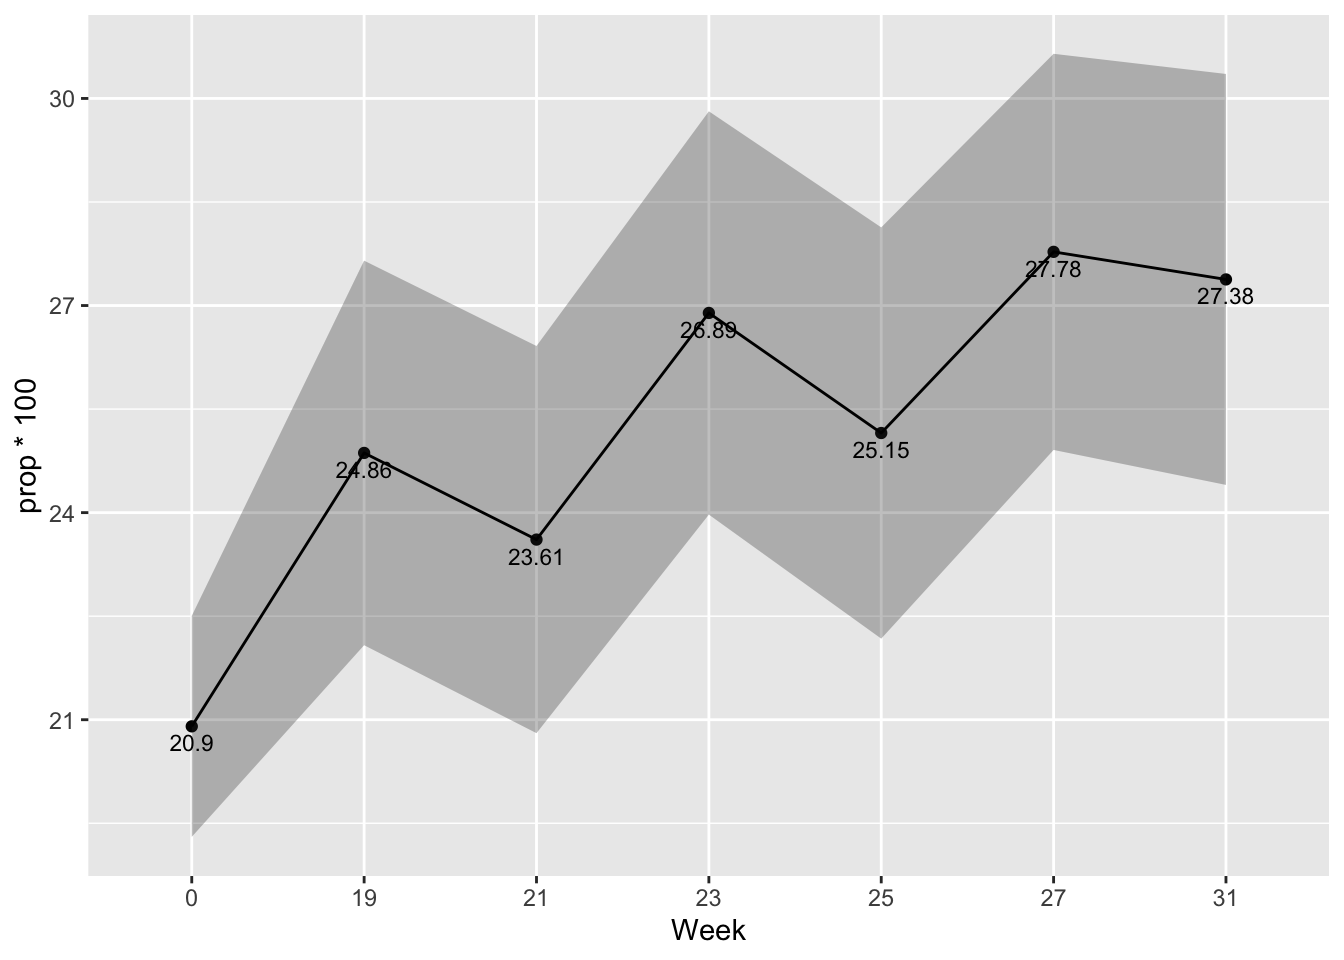
Trend of Change Over Time
- Overall, the percentage of families reporting food insecurity fluctuated but showed an increasing trend from pre-COVID to Week 19 (August 10th) to Week 31 (November 19th)
Within-Subject Analayses - Changes from Pre- to Post-COVID
- Note: based on participants’ most recent responses
Overall
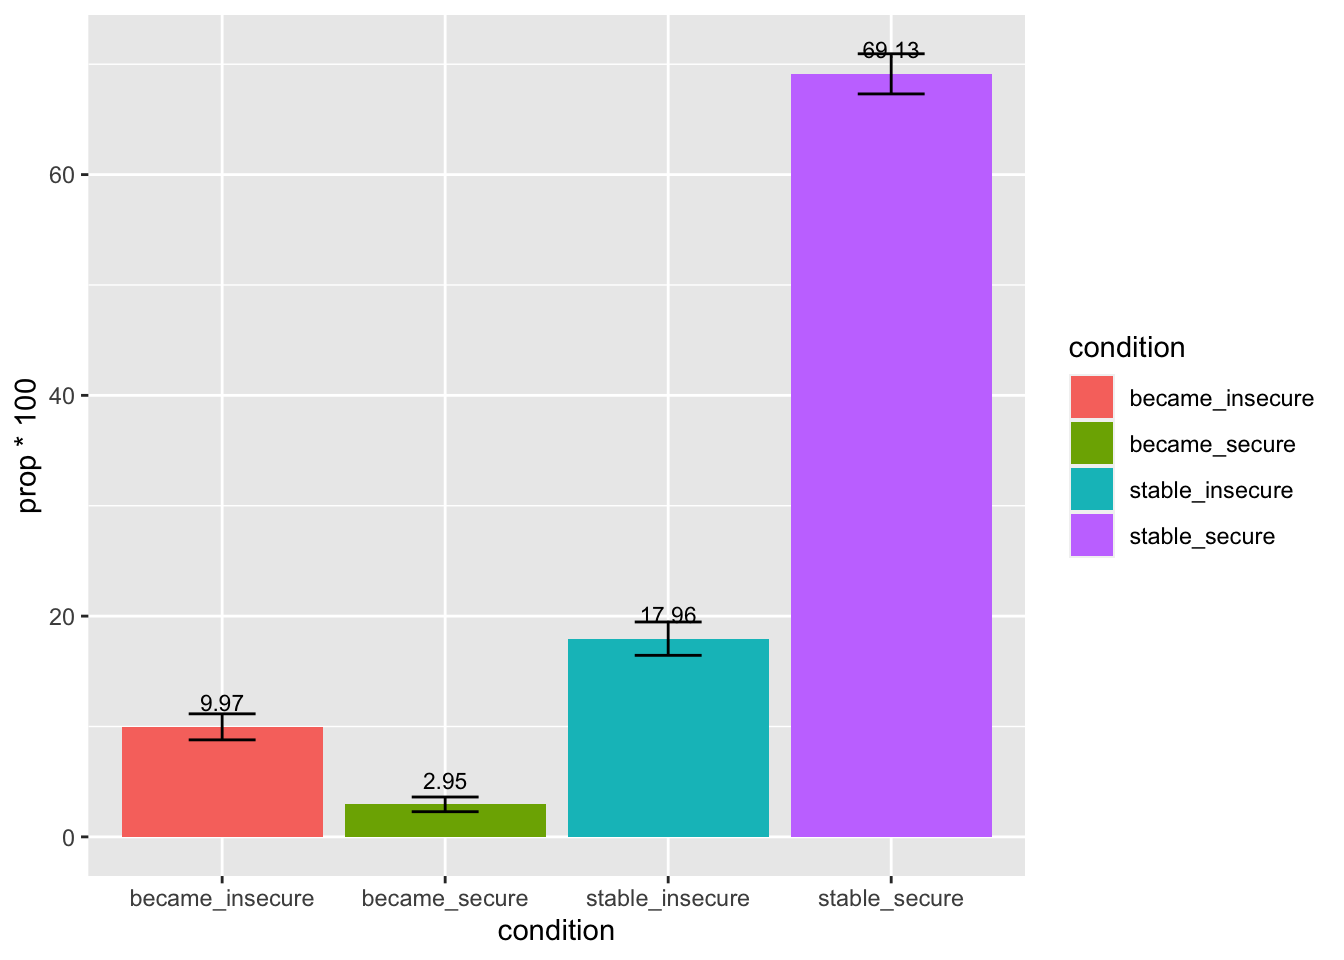
By Race/Ethnicity Groups
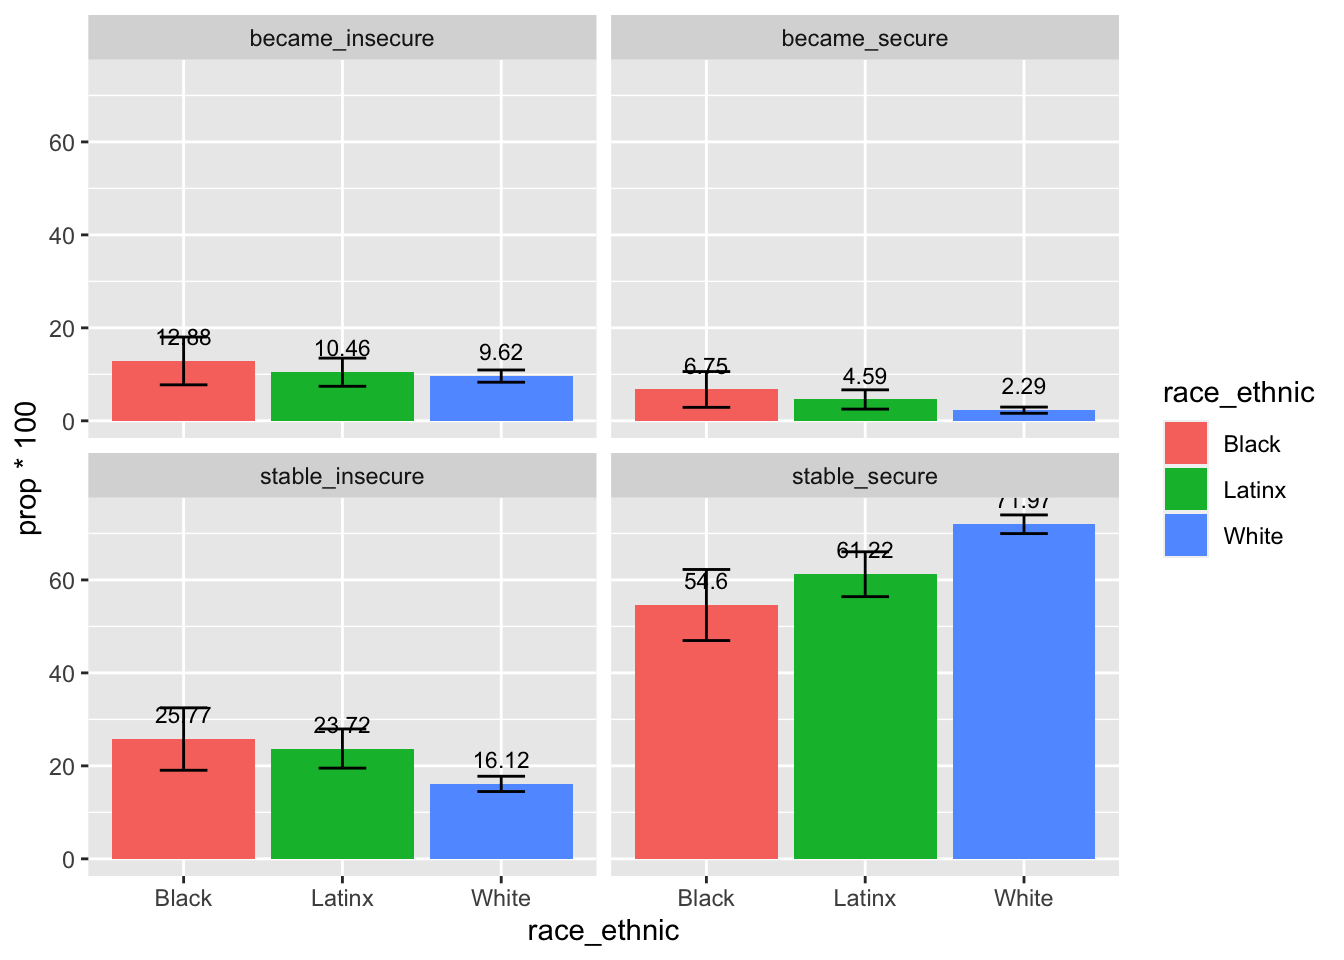
- Significantly higher percentage of White families reported remaining high food security status compared to Black and Latinx families; significantly low percentage of White families reported remaining high food insecurity status compared to Black and Latinx families
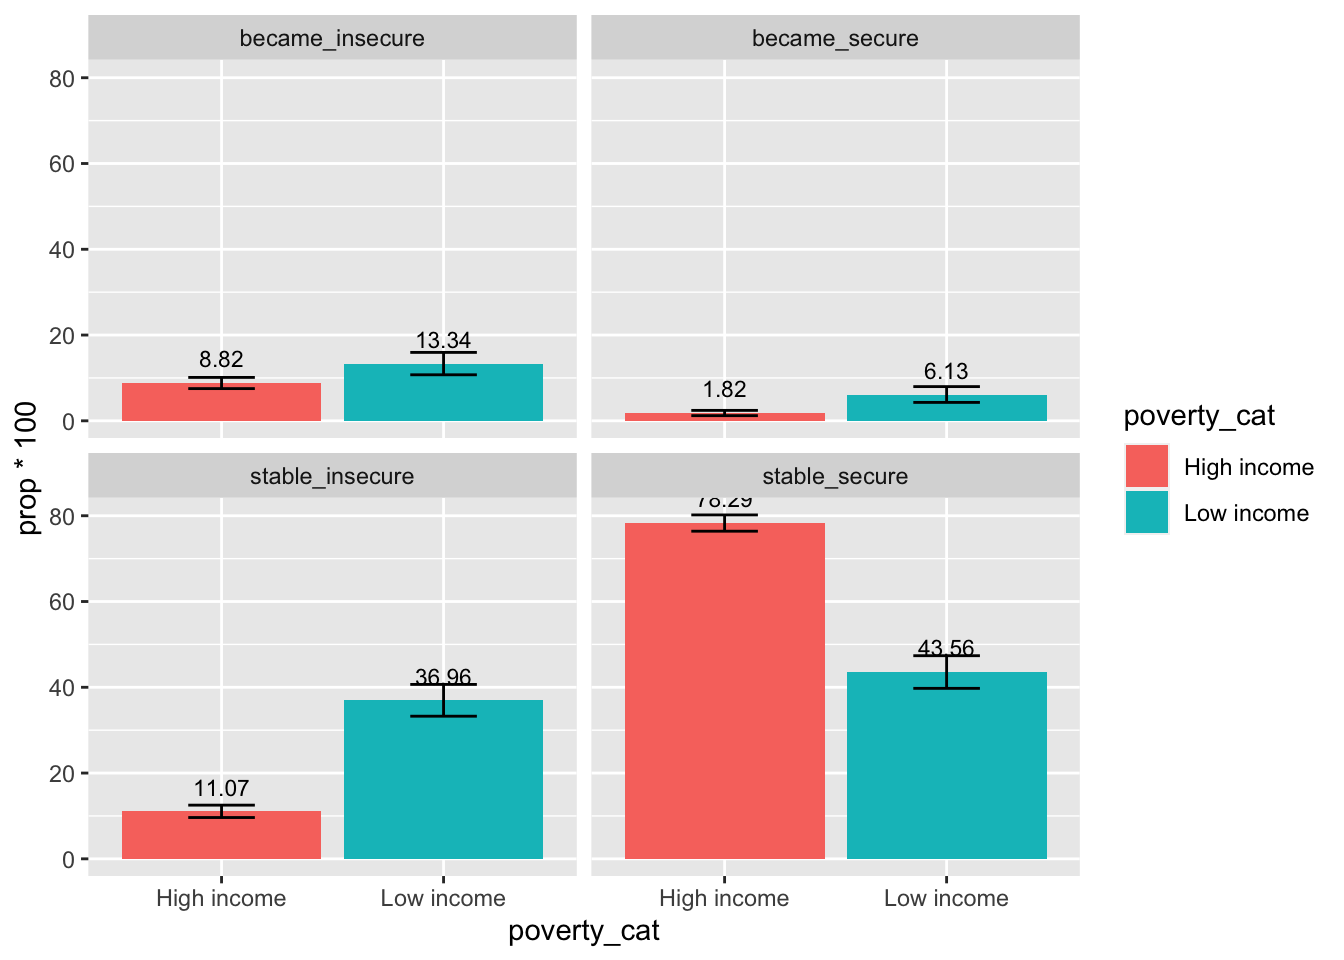
By Poverty Level
- Compared to high-income families, there were significantly higher percentage of low-income families reporting remaining high food insecurity status,and significantly lower percentage of low-income families reporting remaining high food security status.
- Additionally, a small but significantly higher percentage of low-income families also reported becoming food insecure, and becoming secure, compared to high-income families
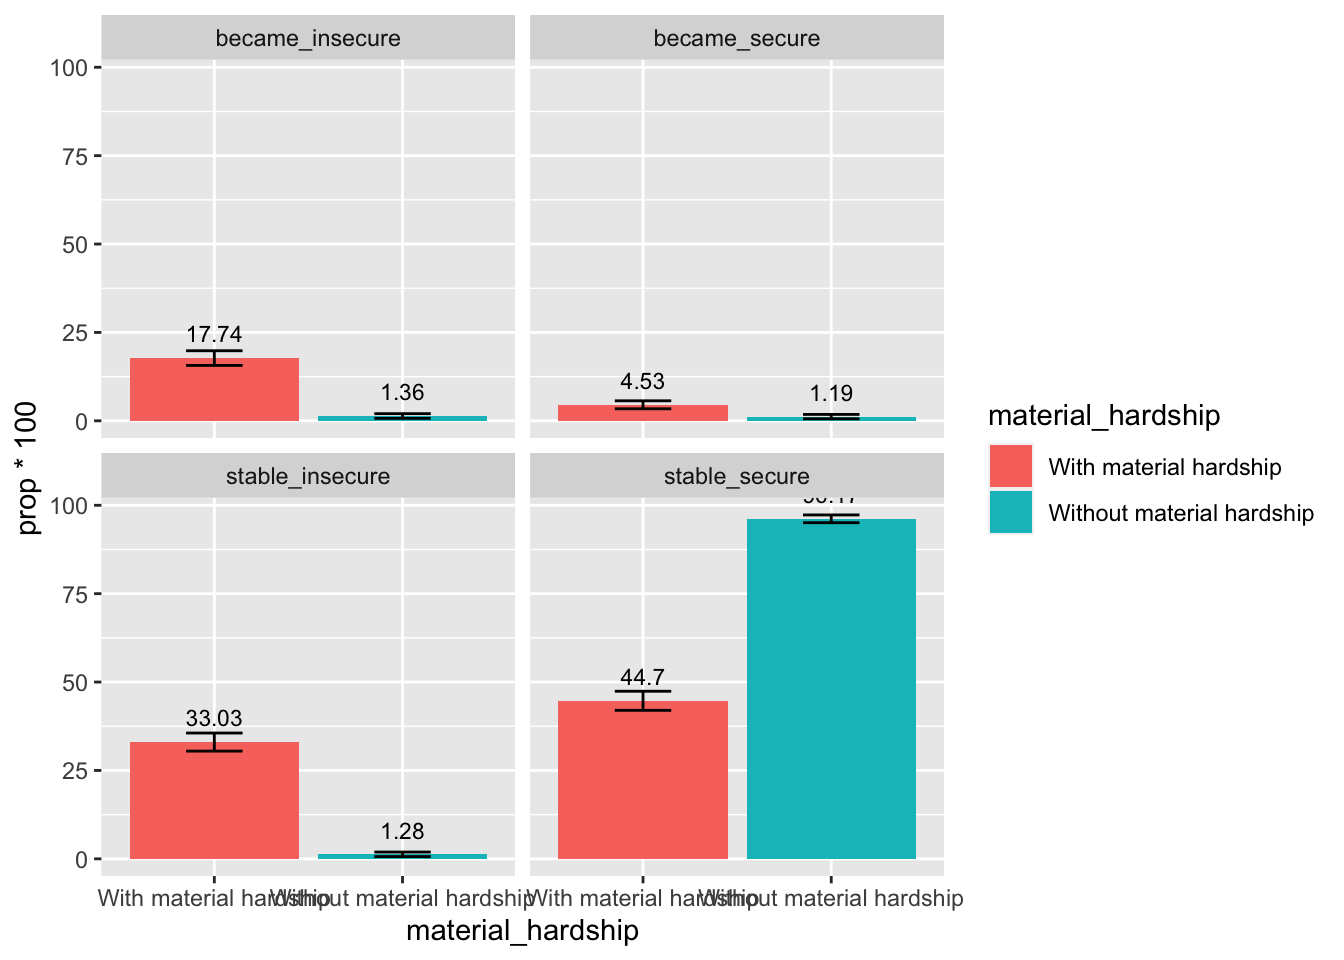
By Material Hardship Status
- Compared to families without material hardship, there were significantly higher percentage of families with material hardship reporting remaining high food insecurity status and becoming food insecure, and significantly lower percentage of families with material hardship reporting high remaining food security status.
- Additionally, a small but significantly higher percentage of families with material hardship also reported becoming food secure, compared to families without material hardship
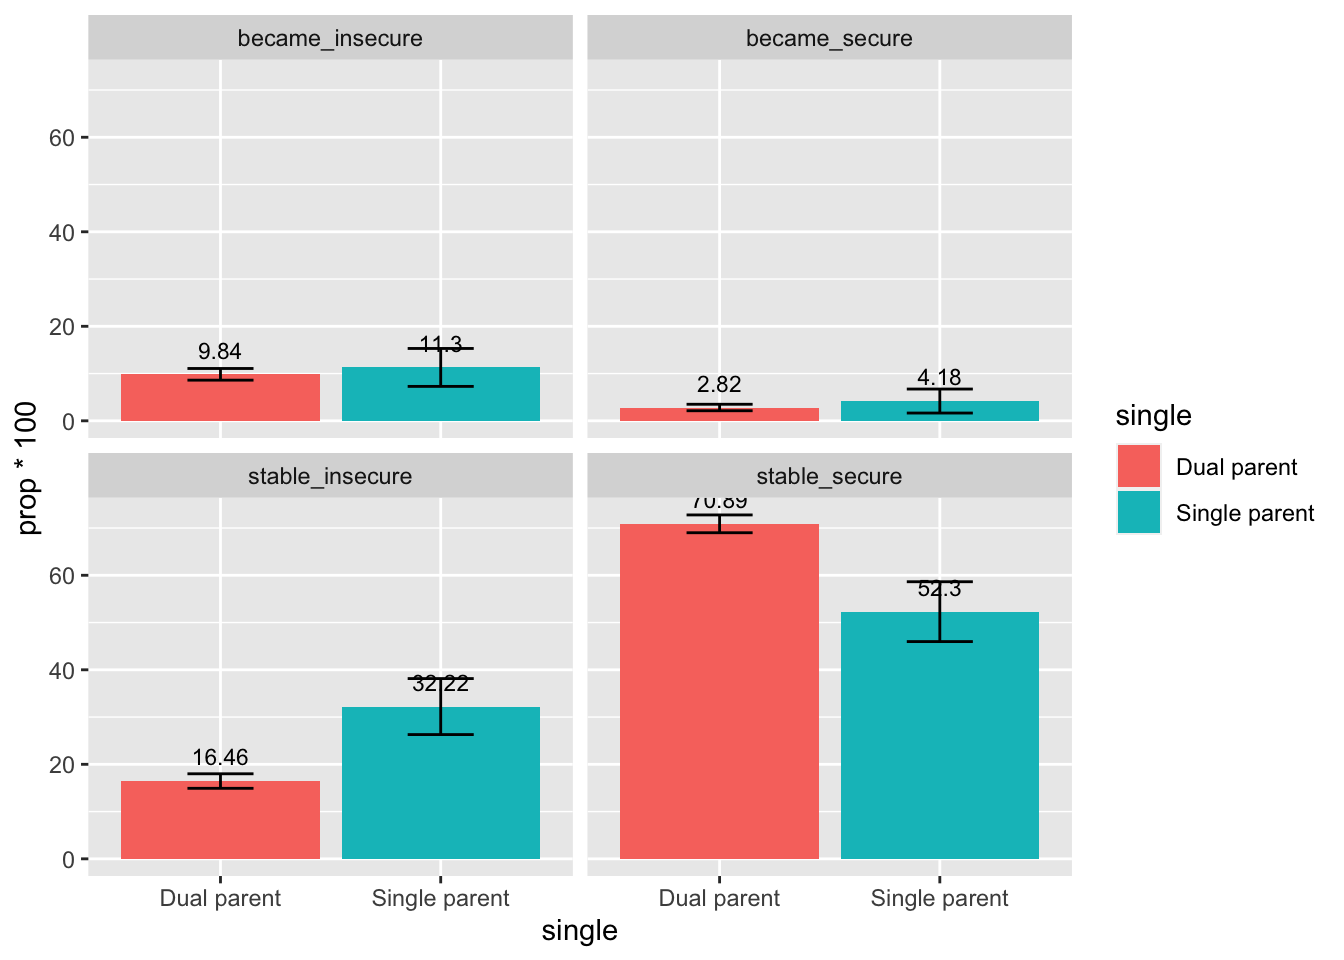
By Single Parent Status
- Compared to dual-parent families, there were significantly higher percentage of single-parent families reporting remaining high food insecurity status, and significantly lower percentage of single-parent families reporting remaining high food security status.
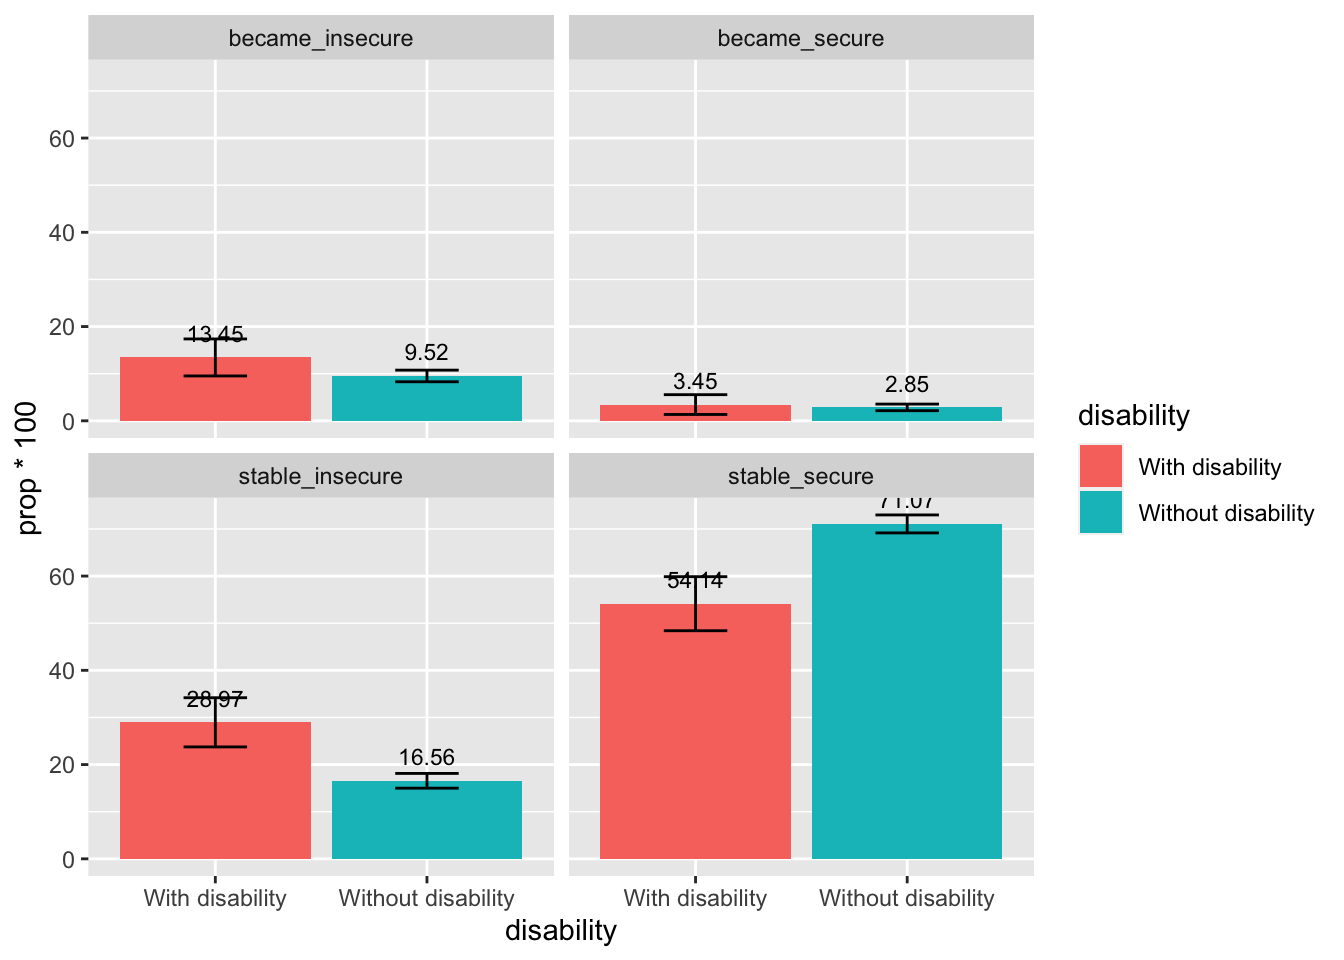
By Children’s Special Needs Status
- Compared to families of children without special needs, there were significantly higher percentage of families of children with special needs reporting remaining high food insecurity status, and significantly lower percentage of families of children with special needs reporting remaining high food security status.
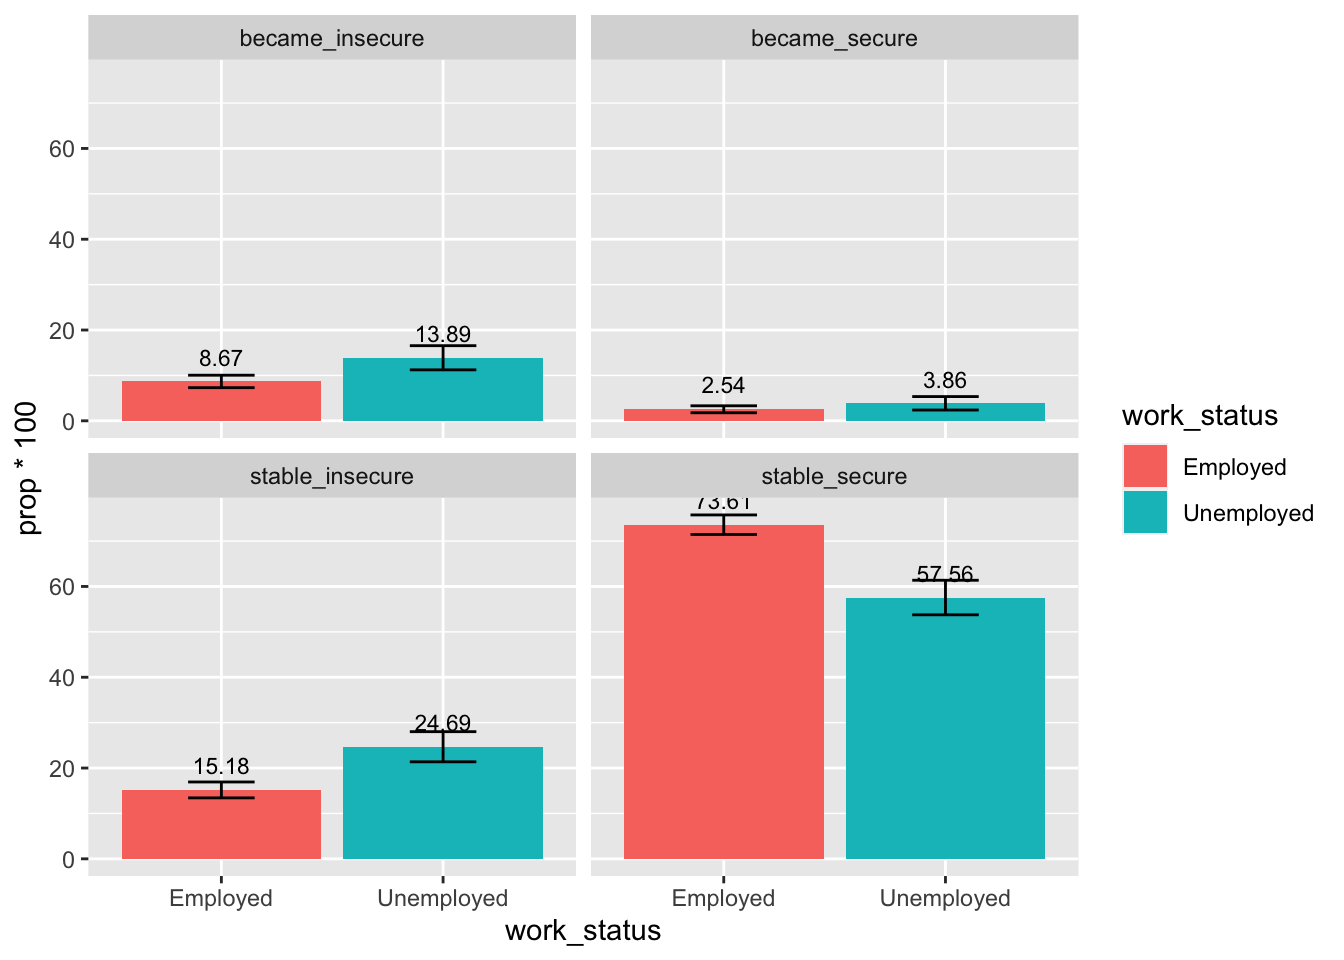
By Caregivers’ Post-COVID Employment Status
- Compared to employed caregivers, there were significantly higher percentage of unemployed caregivers reporting remaining high food insecurity status or becoming food insecure, and significantly lower percentage of unemployed caregivers reporting remaining high food security status.
Association Analyses - Food Security & Mental Health
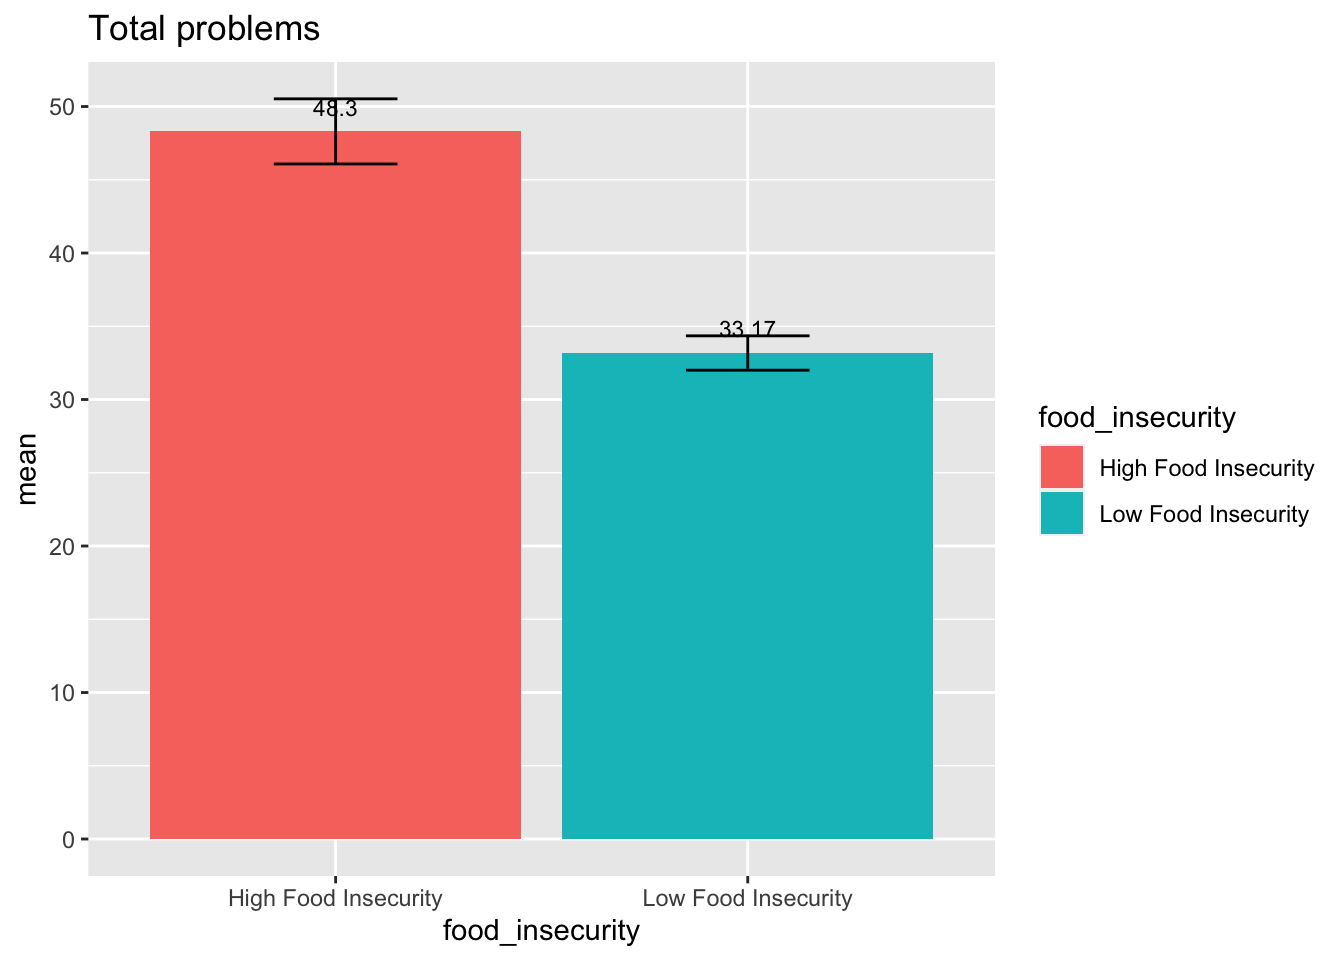
Caregivers’ Mental Health
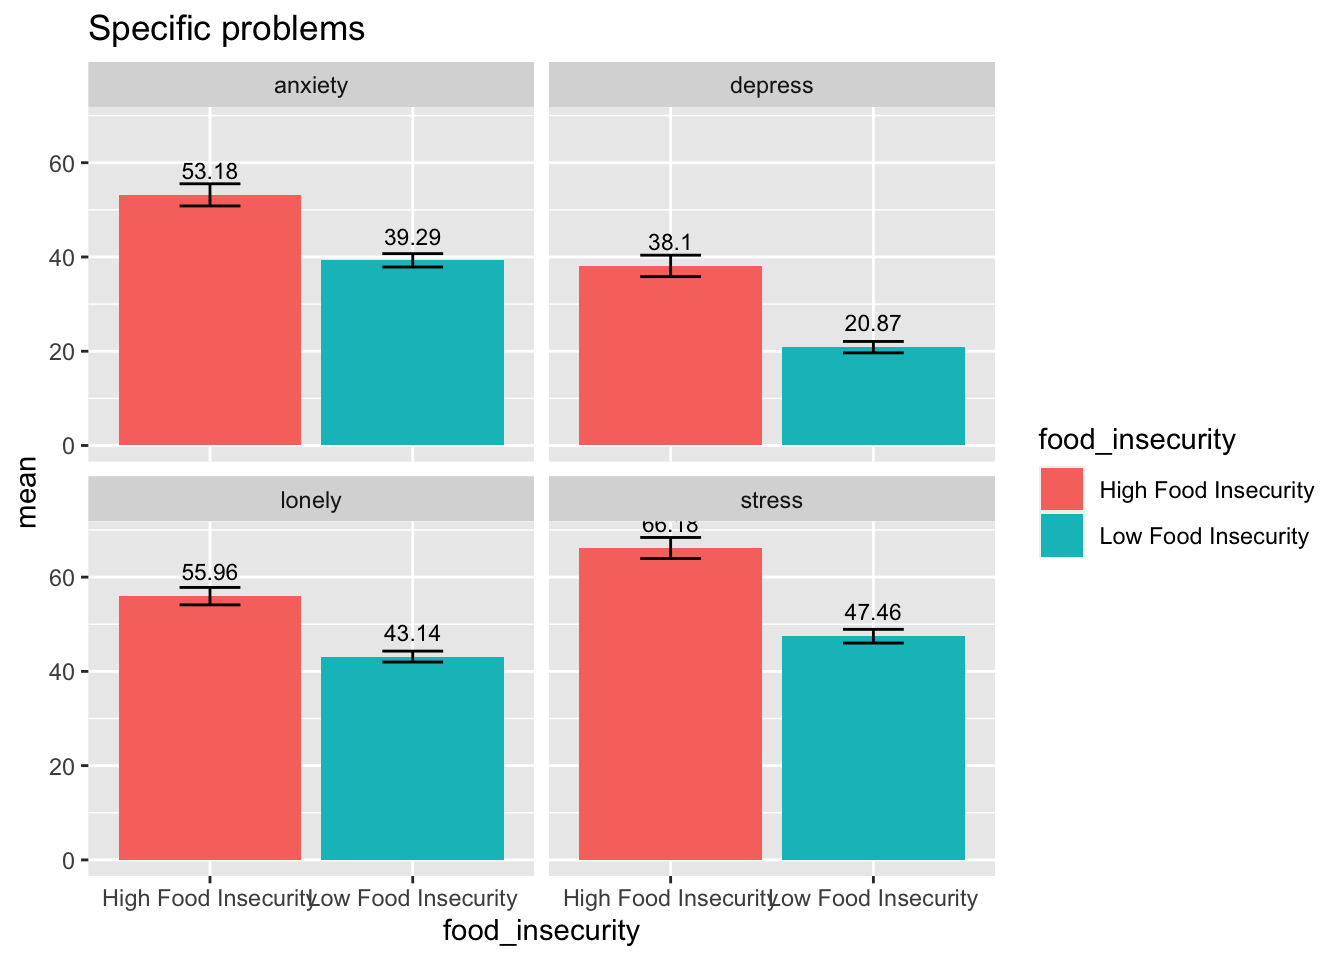
Caregivers’ Mental Health Breakdown by Low & High Food Security Status
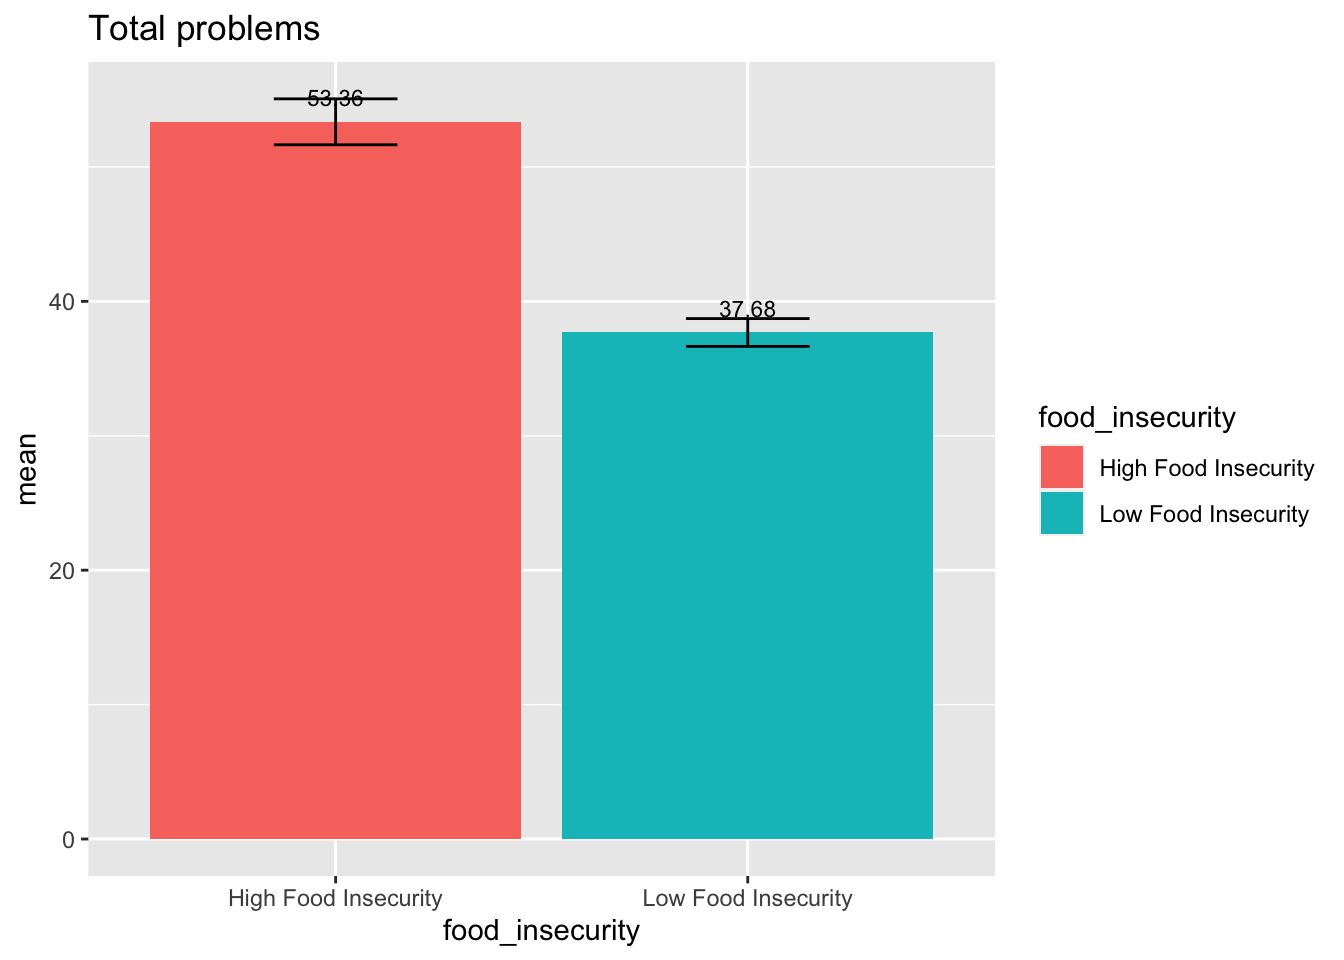
- Note: analyses done based on most recent responses; mental health problems ranged 0-100
- Caregivers in families experiencing high food insecurity reported higher levels of total mental health problems, compared to caregivers in families not experiencing food insecurity.
- Caregivers in families experiencing high food insecurity reported higher levels of depression, anxiety, loneliness, and stress, compared to caregivers in families not experiencing food insecurity.
Cross-Sectional Correlations between Food Insecurity Raw Scores & Caregivers’ Mental Health
- Food insecurity raw score was significantly and positively correlated with caregivers’ mental health problems, including depression, anxiety, loneliness, stress, and total problems
##             fi_raw_crt total_crt depress_crt anxiety_crt stress_crt lonely_crt
## fi_raw_crt        1.00      0.32        0.29        0.21       0.27       0.24
## total_crt         0.32      1.00        0.79        0.85       0.85       0.70
## depress_crt       0.29      0.79        1.00        0.54       0.52       0.47
## anxiety_crt       0.21      0.85        0.54        1.00       0.69       0.43
## stress_crt        0.27      0.85        0.52        0.69       1.00       0.44
## lonely_crt        0.24      0.70        0.47        0.43       0.44       1.00
##
## n
##             fi_raw_crt total_crt depress_crt anxiety_crt stress_crt lonely_crt
## fi_raw_crt        2478      2478        2478        2478       2477       2478
## total_crt         2478      2478        2478        2478       2477       2478
## depress_crt       2478      2478        2478        2478       2477       2478
## anxiety_crt       2478      2478        2478        2478       2477       2478
## stress_crt        2477      2477        2477        2477       2477       2477
## lonely_crt        2478      2478        2478        2478       2477       2478
##
## P
##             fi_raw_crt total_crt depress_crt anxiety_crt stress_crt lonely_crt
## fi_raw_crt              0         0           0           0          0
## total_crt    0                    0           0           0          0
## depress_crt  0          0                     0           0          0
## anxiety_crt  0          0         0                       0          0
## stress_crt   0          0         0           0                      0
## lonely_crt   0          0         0           0           0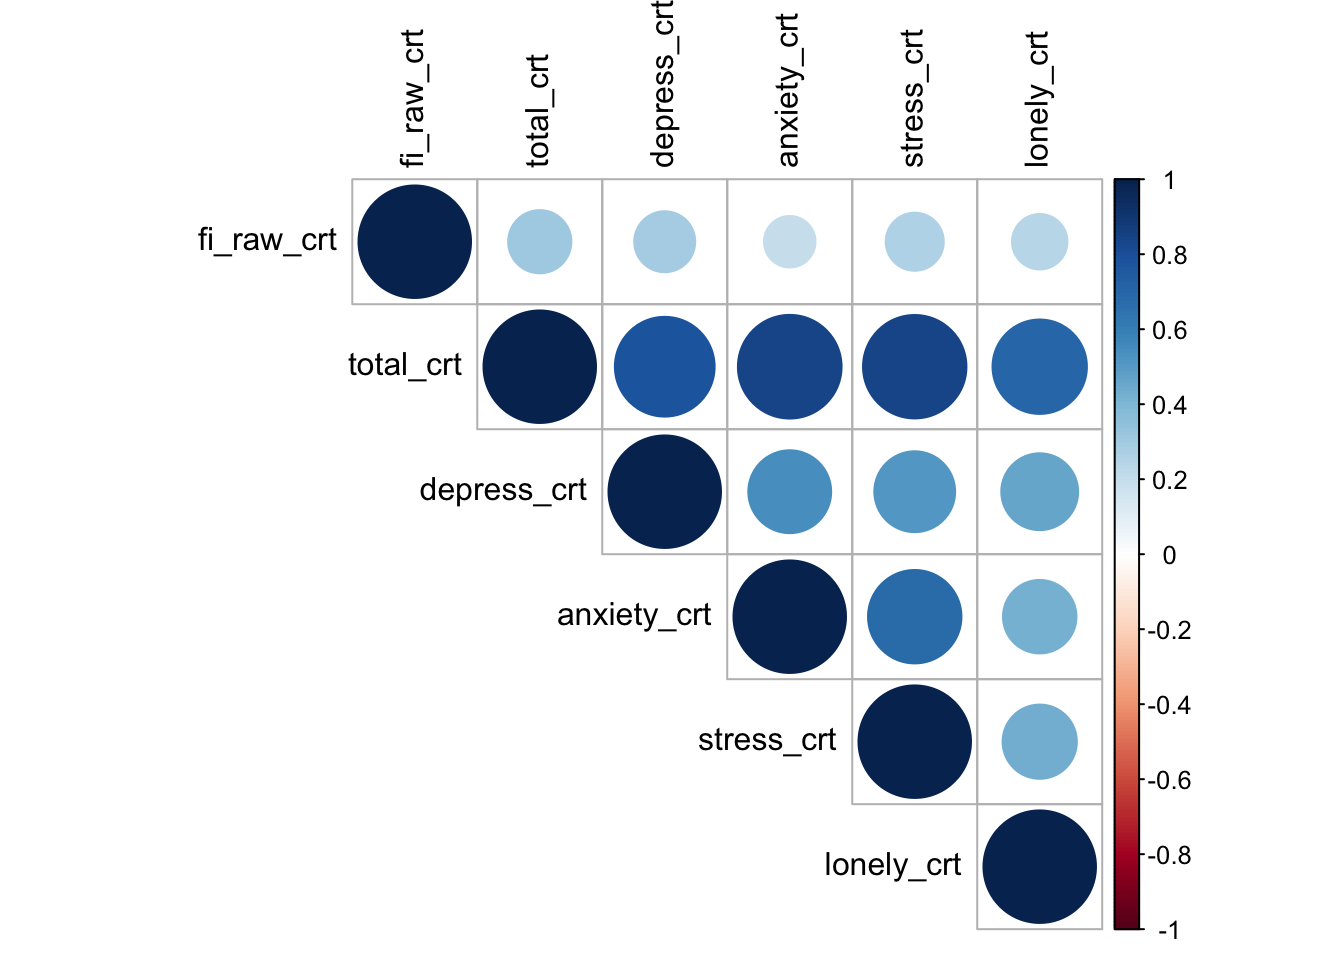
Food Insecurity Raw Score Predicting Subsequent Caregivers’ Mental Health Problems
- Food insecurity significantly predicted increased total mental health problems among caregivers during the subsequent response(b = .84, p < .001), controlling for the current total mental health problems score (b = .76, p < .001)
##
## Call:
## lm(formula = total_fl ~ fi_raw_crt + total_crt, data = fi_pmh_fl)
##
## Residuals:
##     Min      1Q  Median      3Q     Max
## -87.447  -9.649  -0.770   9.403  67.434
##
## Coefficients:
##             Estimate Std. Error t value Pr(>|t|)
## (Intercept) 9.649372   0.447803  21.548  < 2e-16 ***
## fi_raw_crt  0.938908   0.119622   7.849 5.13e-15 ***
## total_crt   0.731029   0.009979  73.254  < 2e-16 ***
## ---
## Signif. codes:  0 '***' 0.001 '**' 0.01 '*' 0.05 '.' 0.1 ' ' 1
##
## Residual standard error: 15.45 on 4809 degrees of freedom
##   (492 observations deleted due to missingness)
## Multiple R-squared:  0.5665, Adjusted R-squared:  0.5663
## F-statistic: 3142 on 2 and 4809 DF, p-value: < 2.2e-16- Food insecurity significantly predicted increased depressive symptoms among caregivers during the subsequent response(b = 1.78, p < .001), controlling for the current depressive symptoms score (b = .60, p < .001)
##
## Call:
## lm(formula = depress_fl ~ fi_raw_crt + depress_crt, data = fi_pmh_fl)
##
## Residuals:
##     Min      1Q  Median      3Q     Max
## -78.399  -8.164  -8.164   5.350  91.836
##
## Coefficients:
##             Estimate Std. Error t value Pr(>|t|)
## (Intercept)  8.16394    0.43364   18.83   <2e-16 ***
## fi_raw_crt   1.79626    0.17032   10.55   <2e-16 ***
## depress_crt  0.59457    0.01193   49.85   <2e-16 ***
## ---
## Signif. codes:  0 '***' 0.001 '**' 0.01 '*' 0.05 '.' 0.1 ' ' 1
##
## Residual standard error: 22.02 on 4803 degrees of freedom
##   (498 observations deleted due to missingness)
## Multiple R-squared:  0.3952, Adjusted R-squared:  0.395
## F-statistic: 1569 on 2 and 4803 DF, p-value: < 2.2e-16- Food insecurity significantly predicted increased anxiety symptoms among caregivers during the subsequent response(b = 1.22, p < .001), controlling for the current anxiety symptoms score (b = .60, p < .001)
##
## Call:
## lm(formula = anxiety_fl ~ fi_raw_crt + anxiety_crt, data = fi_pmh_fl)
##
## Residuals:
##     Min      1Q  Median      3Q     Max
## -79.894 -15.657  -0.952  17.676  84.343
##
## Coefficients:
##             Estimate Std. Error t value Pr(>|t|)
## (Intercept) 15.65741    0.62139  25.197  < 2e-16 ***
## fi_raw_crt   1.39231    0.19166   7.265 4.35e-13 ***
## anxiety_crt  0.55883    0.01201  46.541  < 2e-16 ***
## ---
## Signif. codes:  0 '***' 0.001 '**' 0.01 '*' 0.05 '.' 0.1 ' ' 1
##
## Residual standard error: 25.42 on 4805 degrees of freedom
##   (496 observations deleted due to missingness)
## Multiple R-squared:  0.3346, Adjusted R-squared:  0.3343
## F-statistic: 1208 on 2 and 4805 DF, p-value: < 2.2e-16- Food insecurity significantly predicted increased stress among caregivers during the subsequent response(b = 1.40, p < .001), controlling for the current stress score (b = .62, p < .001)
##
## Call:
## lm(formula = stress_fl ~ fi_raw_crt + stress_crt, data = fi_pmh_fl)
##
## Residuals:
##    Min     1Q Median     3Q    Max
## -86.49 -18.89   0.43  16.55  81.11
##
## Coefficients:
##             Estimate Std. Error t value Pr(>|t|)
## (Intercept) 18.88838    0.69624  27.129  < 2e-16 ***
## fi_raw_crt   1.56034    0.19211   8.122 5.78e-16 ***
## stress_crt   0.58243    0.01181  49.302  < 2e-16 ***
## ---
## Signif. codes:  0 '***' 0.001 '**' 0.01 '*' 0.05 '.' 0.1 ' ' 1
##
## Residual standard error: 25.03 on 4757 degrees of freedom
##   (544 observations deleted due to missingness)
## Multiple R-squared:  0.3763, Adjusted R-squared:  0.3761
## F-statistic: 1435 on 2 and 4757 DF, p-value: < 2.2e-16- Food insecurity significantly predicted increased loneliness among caregivers during the subsequent response (b = .63, p < .001), controlling for the current loneliness score (b = .76, p < .001)
##
## Call:
## lm(formula = lonely_fl ~ fi_raw_crt + lonely_crt, data = fi_pmh_fl)
##
## Residuals:
##     Min      1Q  Median      3Q     Max
## -90.699 -11.769   0.799   7.083  88.231
##
## Coefficients:
##              Estimate Std. Error t value Pr(>|t|)
## (Intercept) 11.769406   0.508037   23.17  < 2e-16 ***
## fi_raw_crt   0.677625   0.130068    5.21 1.97e-07 ***
## lonely_crt   0.748638   0.009833   76.14  < 2e-16 ***
## ---
## Signif. codes:  0 '***' 0.001 '**' 0.01 '*' 0.05 '.' 0.1 ' ' 1
##
## Residual standard error: 17.12 on 4805 degrees of freedom
##   (496 observations deleted due to missingness)
## Multiple R-squared:  0.5669, Adjusted R-squared:  0.5667
## F-statistic:  3145 on 2 and 4805 DF,  p-value: < 2.2e-16
Children’ Mental Health
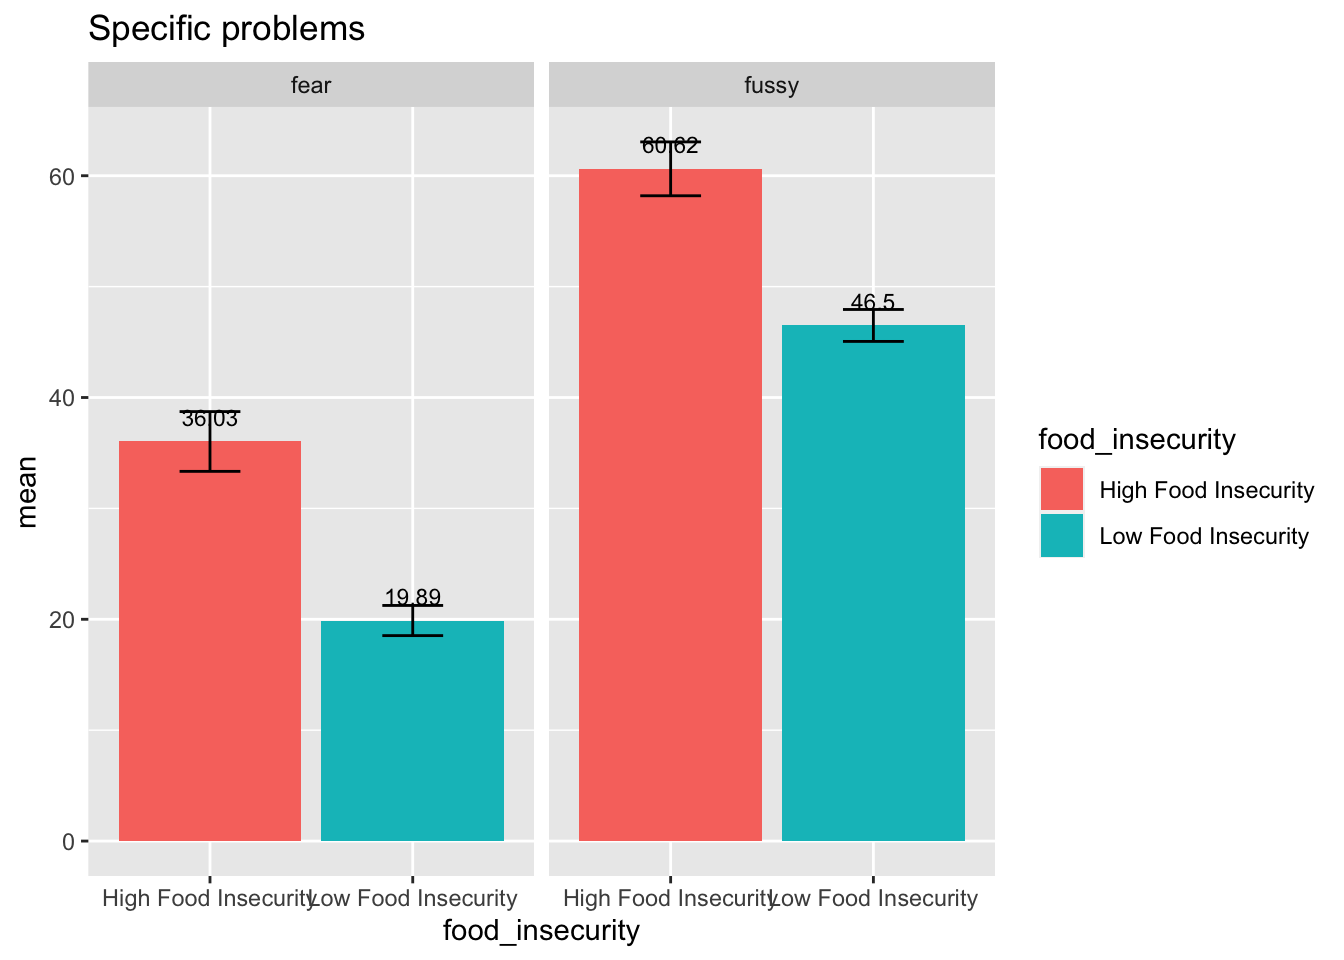
Children’s Mental Health Breakdown by Low & High Food Security Status
- Note: analyses done based on most recent responses; mental health problems ranged 0-100
- Caregivers in families experiencing high food insecurity reported higher levels of children’s total mental health problems, compared to caregivers in families not experiencing food insecurity.
- Caregivers in families experiencing high food insecurity reported higher levels of children’s fussiness/defiance and fear/anxiety, compared to caregivers in families not experiencing food insecurity.
Cross-Sectional Correlations between Food Insecurity Raw Scores & Children’ Mental Health
- Food insecurity raw score was significantly and positively correlated with children’ mental health problems, including fussiness/defiance, fear/anxiety, and total problems
##            fi_raw_crt ctotal_crt fussy_crt fear_crt
## fi_raw_crt       1.00       0.25      0.20     0.23
## ctotal_crt       0.25       1.00      0.85     0.85
## fussy_crt        0.20       0.85      1.00     0.46
## fear_crt         0.23       0.85      0.46     1.00
##
## n
##            fi_raw_crt ctotal_crt fussy_crt fear_crt
## fi_raw_crt       2478       2478      2477     2476
## ctotal_crt       2478       2478      2477     2476
## fussy_crt        2477       2477      2477     2476
## fear_crt         2476       2476      2476     2476
##
## P
##            fi_raw_crt ctotal_crt fussy_crt fear_crt
## fi_raw_crt             0          0         0
## ctotal_crt  0                     0         0
## fussy_crt   0          0                    0
## fear_crt    0          0          0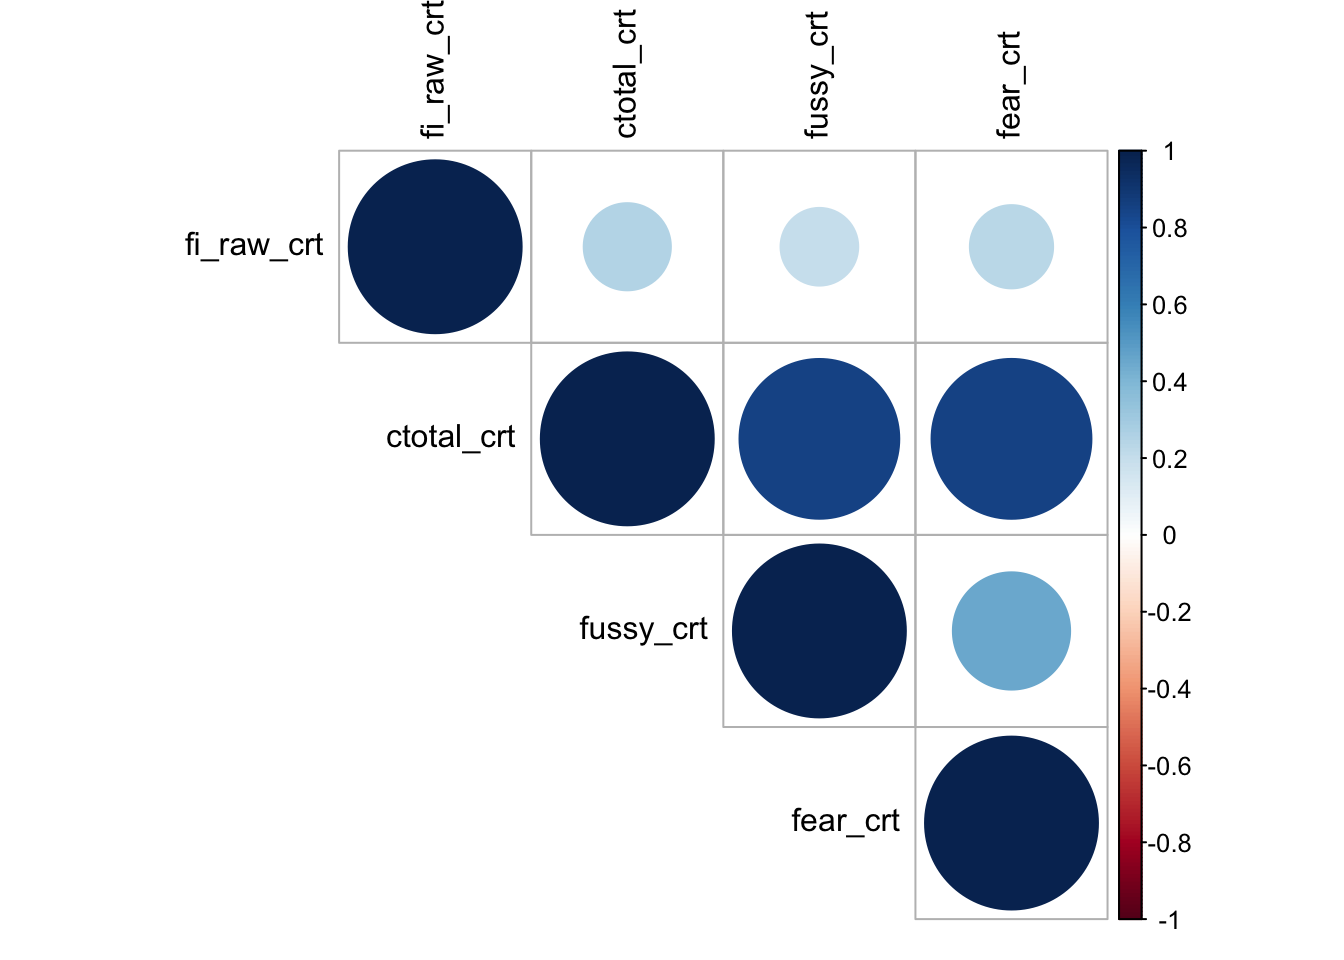
Food Insecurity Raw Score Predicting Subsequent Caregivers’ Mental Health Problems
- Food insecurity significantly predicted increased total mental health problems among children during the subsequent response(b = 1.09, p < .001), controlling for the current total mental health problems score (b = .65, p < .001)
##
## Call:
## lm(formula = ctotal_fl ~ fi_raw_crt + ctotal_crt, data = fi_cp_fl)
##
## Residuals:
##     Min      1Q  Median      3Q     Max
## -80.215 -12.620  -3.132  12.380  87.380
##
## Coefficients:
##             Estimate Std. Error t value Pr(>|t|)
## (Intercept) 12.61985    0.51104  24.695  < 2e-16 ***
## fi_raw_crt   1.10892    0.15850   6.996 2.99e-12 ***
## ctotal_crt   0.62050    0.01136  54.641  < 2e-16 ***
## ---
## Signif. codes:  0 '***' 0.001 '**' 0.01 '*' 0.05 '.' 0.1 ' ' 1
##
## Residual standard error: 20.8 on 4809 degrees of freedom
##   (492 observations deleted due to missingness)
## Multiple R-squared:  0.4136, Adjusted R-squared:  0.4133
## F-statistic: 1696 on 2 and 4809 DF, p-value: < 2.2e-16- Food insecurity significantly predicted increased fussiness/defiance among children during the subsequent response(b = 1.17, p < .001), controlling for the current fussiness/defiance score (b = .59, p < .001)
##
## Call:
## lm(formula = fussy_fl ~ fi_raw_crt + fussy_crt, data = fi_cp_fl)
##
## Residuals:
##     Min      1Q  Median      3Q     Max
## -82.128 -20.705   1.624  19.088  79.295
##
## Coefficients:
##             Estimate Std. Error t value Pr(>|t|)
## (Intercept) 20.70537    0.71888  28.802  < 2e-16 ***
## fi_raw_crt   1.21638    0.20123   6.045 1.61e-09 ***
## fussy_crt    0.55341    0.01216  45.493  < 2e-16 ***
## ---
## Signif. codes:  0 '***' 0.001 '**' 0.01 '*' 0.05 '.' 0.1 ' ' 1
##
## Residual standard error: 26.7 on 4801 degrees of freedom
##   (500 observations deleted due to missingness)
## Multiple R-squared:  0.3213, Adjusted R-squared:  0.321
## F-statistic: 1136 on 2 and 4801 DF, p-value: < 2.2e-16- Food insecurity significantly predicted increased fear/anxiety among children during the subsequent response(b = 1.35, p < .001), controlling for the current fear/anxiety score (b = .59, p < .001)
##
## Call:
## lm(formula = fear_fl ~ fi_raw_crt + fear_crt, data = fi_cp_fl)
##
## Residuals:
##     Min      1Q  Median      3Q     Max
## -74.186 -10.077  -8.675  12.774  91.325
##
## Coefficients:
##             Estimate Std. Error t value Pr(>|t|)
## (Intercept)  8.67544    0.48261  17.976  < 2e-16 ***
## fi_raw_crt   1.40163    0.19250   7.281 3.85e-13 ***
## fear_crt     0.57101    0.01185  48.196  < 2e-16 ***
## ---
## Signif. codes:  0 '***' 0.001 '**' 0.01 '*' 0.05 '.' 0.1 ' ' 1
##
## Residual standard error: 25.33 on 4800 degrees of freedom
##   (501 observations deleted due to missingness)
## Multiple R-squared:  0.3559, Adjusted R-squared:  0.3556
## F-statistic:  1326 on 2 and 4800 DF,  p-value: < 2.2e-16
Mediation Analyses: Food Insecurity -> Caregivers’ Mental Health -> Children’s Mental Health
Path c (direct effect): food insecurity -> children’s mental health problems at second subsequent response
- Food insecurity significantly predicted increased total mental health problems among children during the second subsequent response(b = 1.27, p < .001), controlling for the current total mental health problems score (b = .65, p < .001)
##
## Call:
## lm(formula = ctotal_fl2 ~ fi_raw_crt + ctotal_crt, data = fi_pmh_cp)
##
## Residuals:
##     Min      1Q  Median      3Q     Max
## -74.722 -13.075  -3.487  11.925  81.752
##
## Coefficients:
##             Estimate Std. Error t value Pr(>|t|)
## (Intercept) 13.07533    0.55417   23.59  < 2e-16 ***
## fi_raw_crt   1.29321    0.17716    7.30 3.43e-13 ***
## ctotal_crt   0.61646    0.01238   49.80  < 2e-16 ***
## ---
## Signif. codes:  0 '***' 0.001 '**' 0.01 '*' 0.05 '.' 0.1 ' ' 1
##
## Residual standard error: 21.13 on 4173 degrees of freedom
##   (1128 observations deleted due to missingness)
## Multiple R-squared:  0.4051, Adjusted R-squared:  0.4049
## F-statistic:  1421 on 2 and 4173 DF,  p-value: < 2.2e-16
Path a: food insecurity -> caregivers’s mental health problems at first subsequent response
- Food insecurity significantly predicted increased total mental health problems among children during the second subsequent response(b = .84, p < .001), controlling for the current total mental health problems score (b = .76, p < .001)
##
## Call:
## lm(formula = total_fl ~ fi_raw_crt + total_crt, data = fi_pmh_cp)
##
## Residuals:
##     Min      1Q  Median      3Q     Max
## -87.447  -9.649  -0.770   9.403  67.434
##
## Coefficients:
##             Estimate Std. Error t value Pr(>|t|)
## (Intercept) 9.649372   0.447803  21.548  < 2e-16 ***
## fi_raw_crt  0.938908   0.119622   7.849 5.13e-15 ***
## total_crt   0.731029   0.009979  73.254  < 2e-16 ***
## ---
## Signif. codes:  0 '***' 0.001 '**' 0.01 '*' 0.05 '.' 0.1 ' ' 1
##
## Residual standard error: 15.45 on 4809 degrees of freedom
##   (492 observations deleted due to missingness)
## Multiple R-squared:  0.5665, Adjusted R-squared:  0.5663
## F-statistic:  3142 on 2 and 4809 DF,  p-value: < 2.2e-16
Path b: caregivers’ mental health problems at first subsequent response -> children’s mental health problems at second subsequent response
- Caregivers’ mental health problems at the first subsequent response significantly predicted increased total mental health problems among children during the second subsequent response(b = .15, p < .001), controlling for children’s total mental health problems score at the first subsequent response (b = .64, p < .001) and current food insecurity (path c’: b = .77, p < .01)
##
## Call:
## lm(formula = ctotal_fl2 ~ total_fl + ctotal_fl + fi_raw_crt,
##     data = fi_pmh_cp)
##
## Residuals:
##     Min      1Q  Median      3Q     Max
## -75.779 -12.277  -1.949  12.538  85.736
##
## Coefficients:
##             Estimate Std. Error t value Pr(>|t|)
## (Intercept)  7.97089    0.65917  12.092  < 2e-16 ***
## total_fl     0.15898    0.01518  10.473  < 2e-16 ***
## ctotal_fl    0.59197    0.01281  46.215  < 2e-16 ***
## fi_raw_crt   0.86719    0.17336   5.002 5.89e-07 ***
## ---
## Signif. codes:  0 '***' 0.001 '**' 0.01 '*' 0.05 '.' 0.1 ' ' 1
##
## Residual standard error: 20.25 on 4172 degrees of freedom
##   (1128 observations deleted due to missingness)
## Multiple R-squared:  0.4538, Adjusted R-squared:  0.4534
## F-statistic:  1156 on 3 and 4172 DF,  p-value: < 2.2e-16
Testing Indirect Effect using RMediation Method
- Indirect effect was statistically significant: a*b = .126, 95%CI[.08, .18], p <.001
## $`97.5% CI`
## [1] 0.07697582 0.18272167
##
## $Estimate
## [1] 0.126
##
## $SE
## [1] 0.02703849