covid Hotspots
Our data
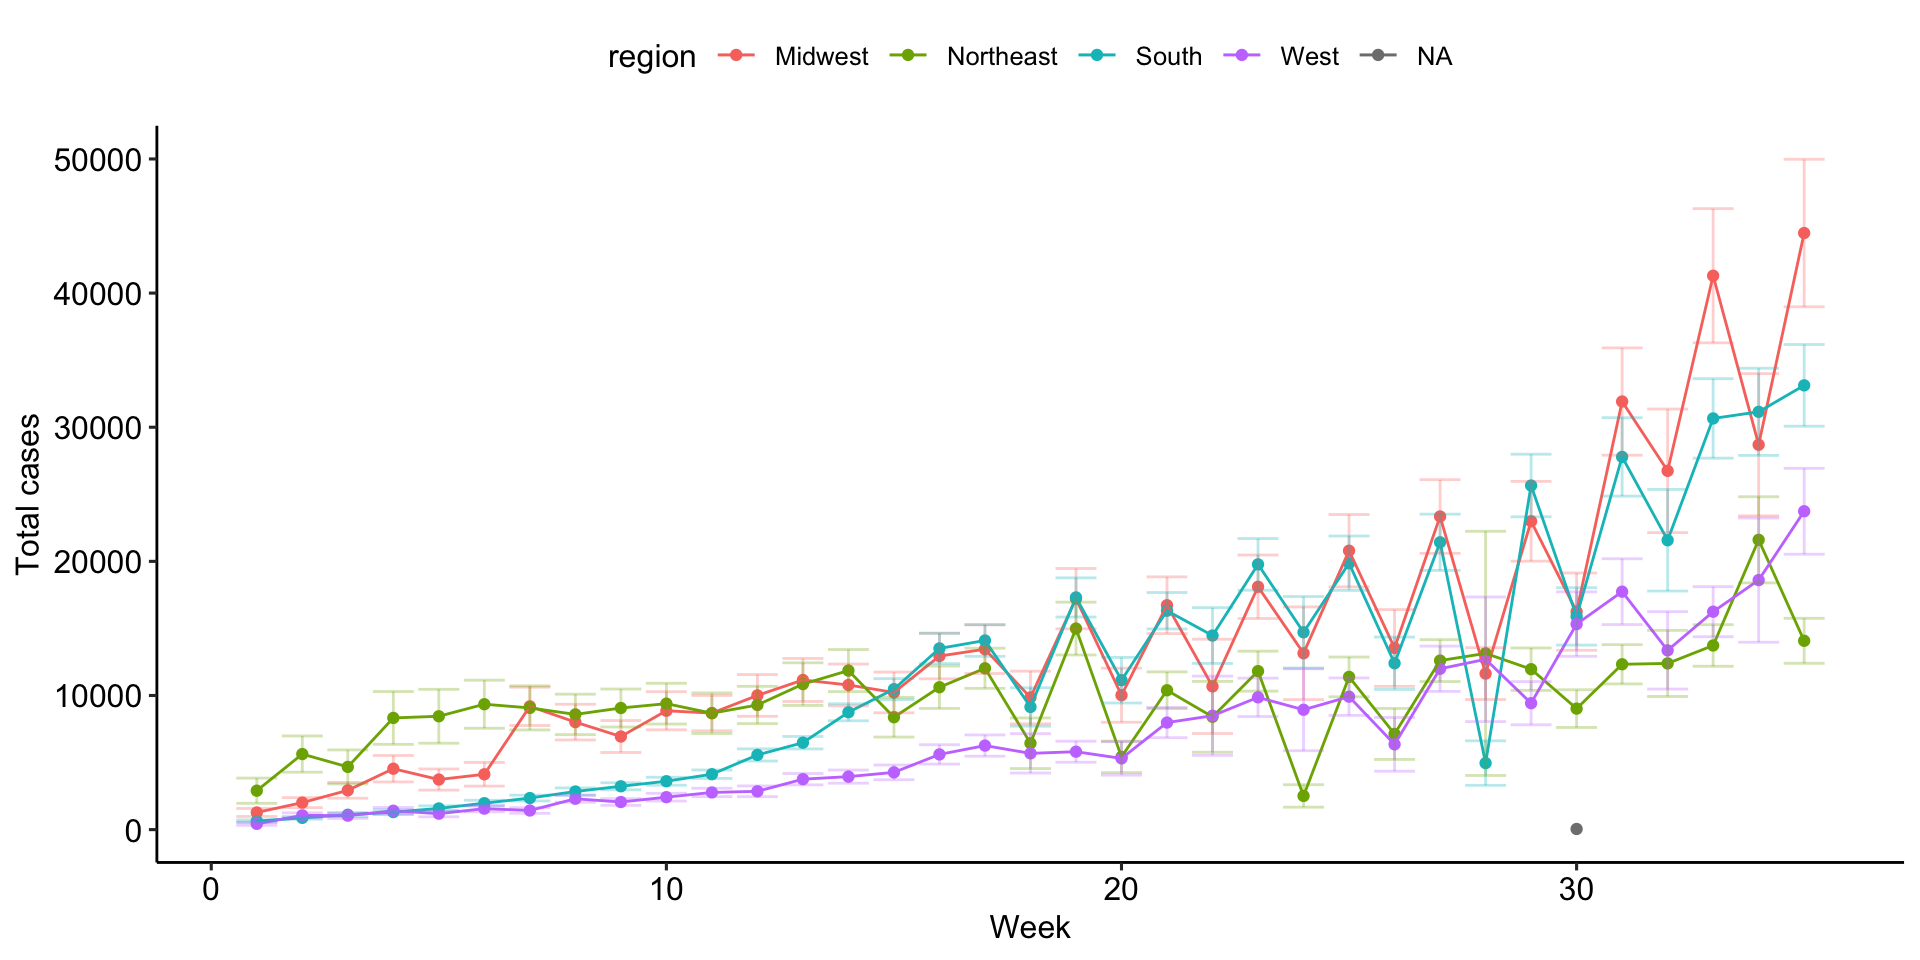
Case and death counts are pulled from the NY Times. We match these data (listed by county) to our particpants’ zipcodes using FIPS codes from the US Census. NYT provides daily total cumulative case and death counts. From these, we calculate several statistics:
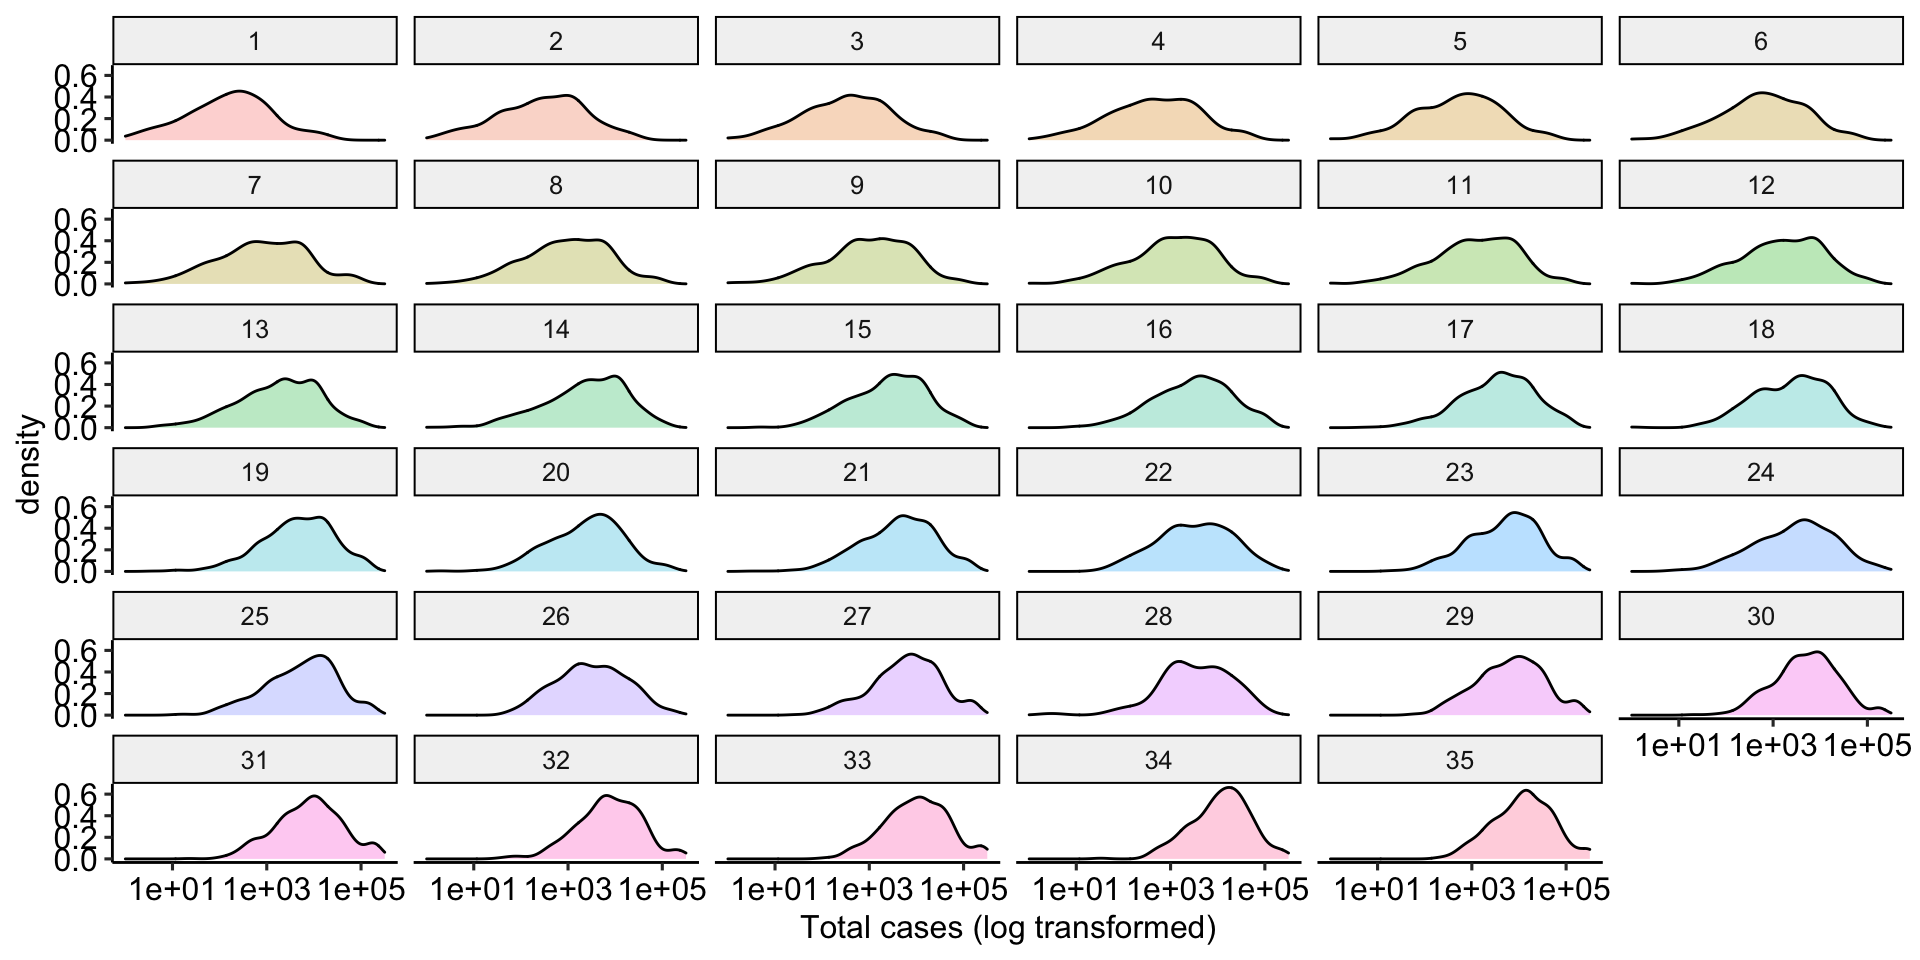
Total cases
This is provided by NYT.
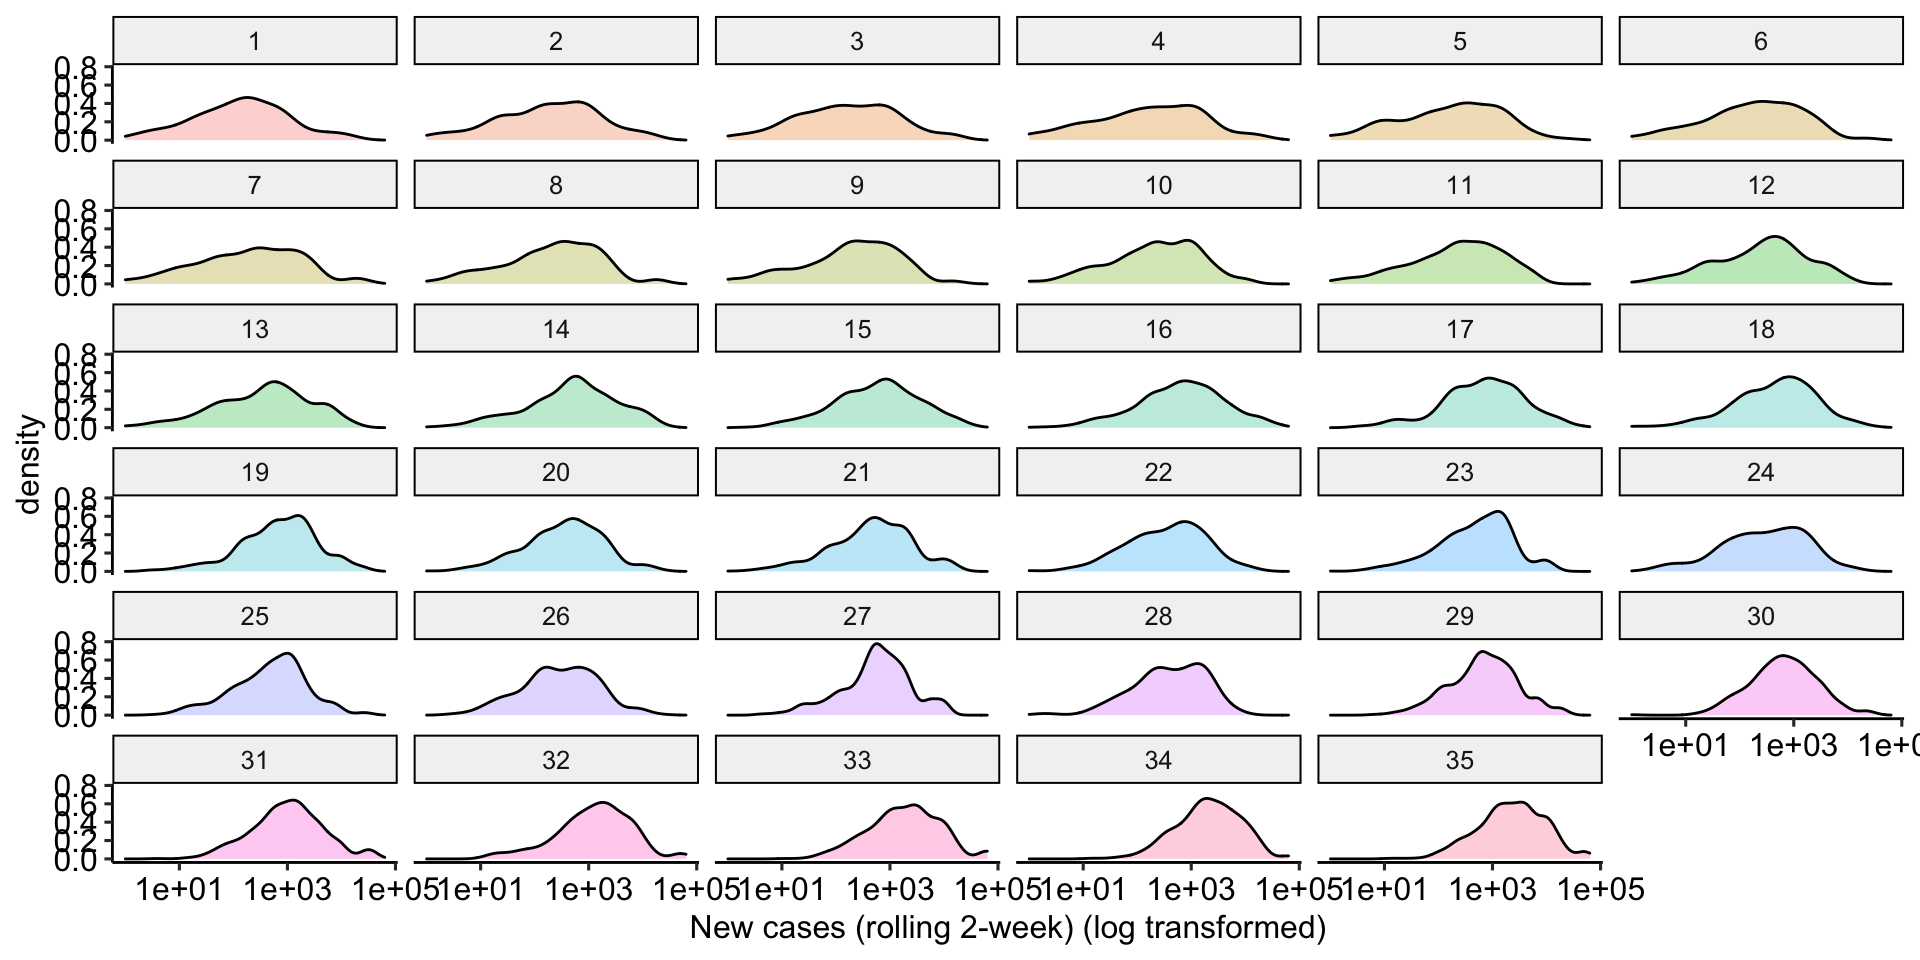
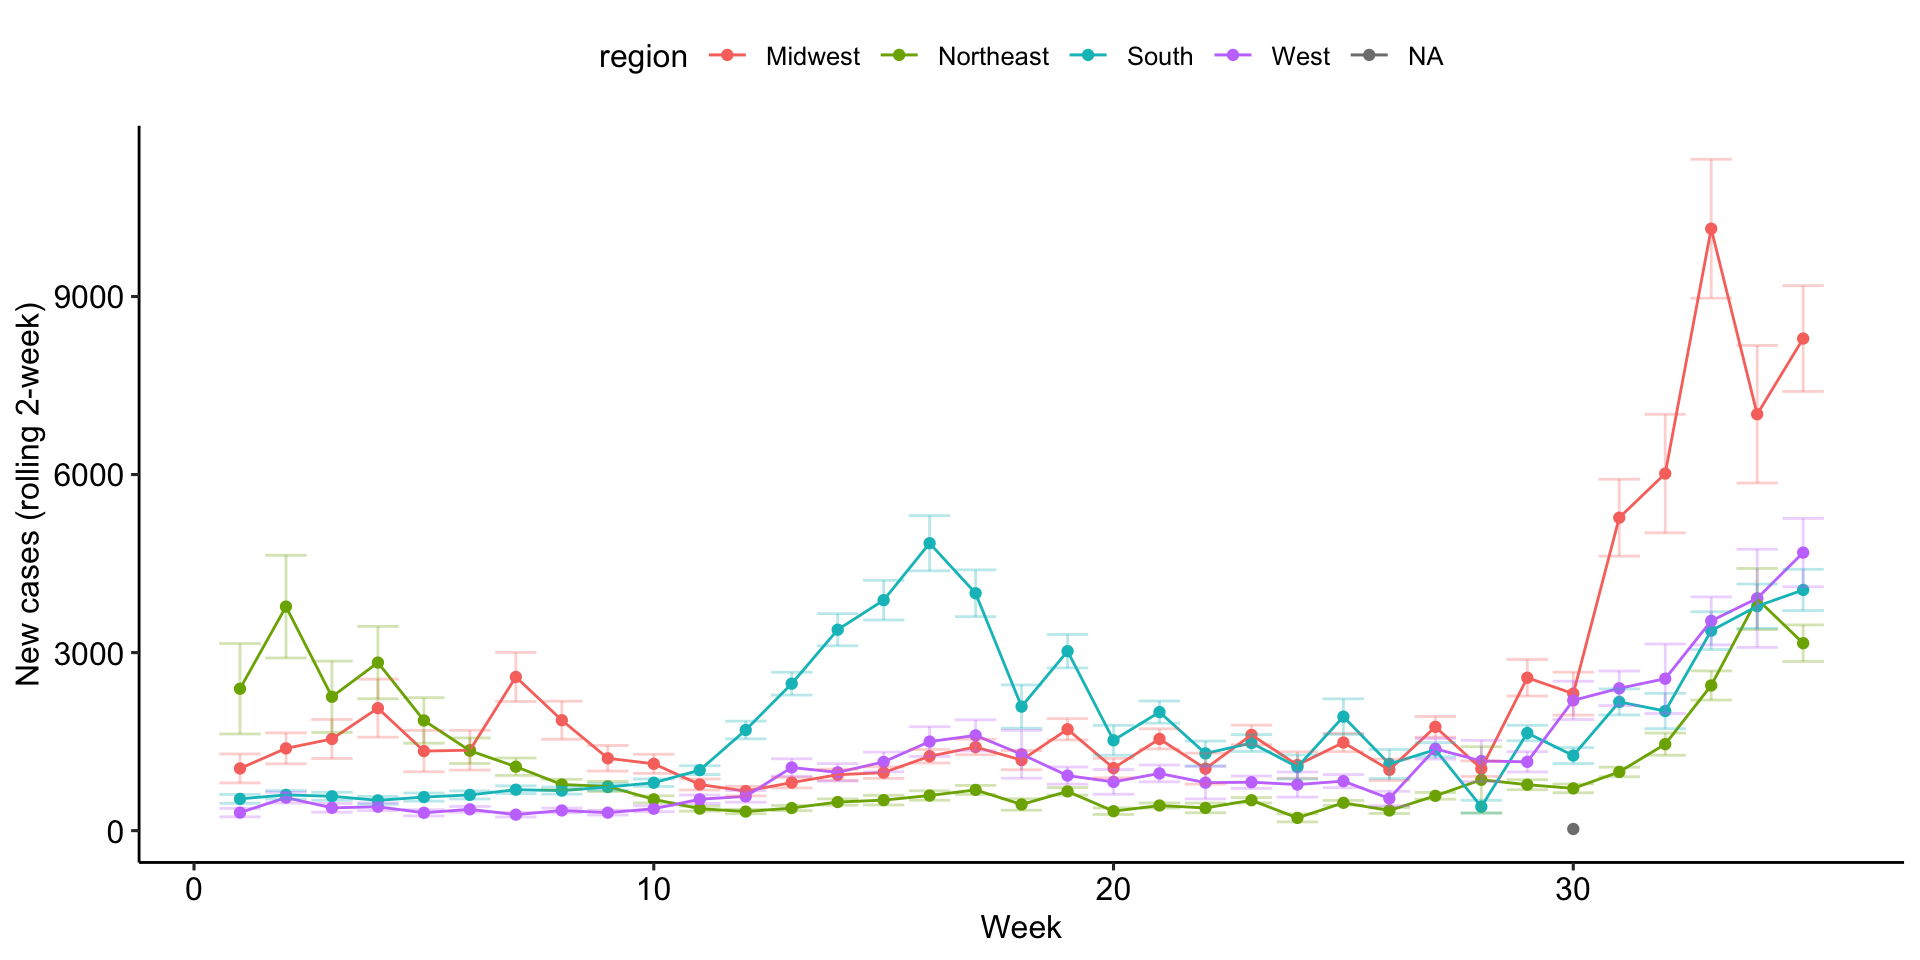
New cases (2-week)
The number of new cases is the number cases on a given day minus the number of cases the prior day. For any day, we sum the prior two weeks of new cases. This number represents the 2-week rolling average of new cases.
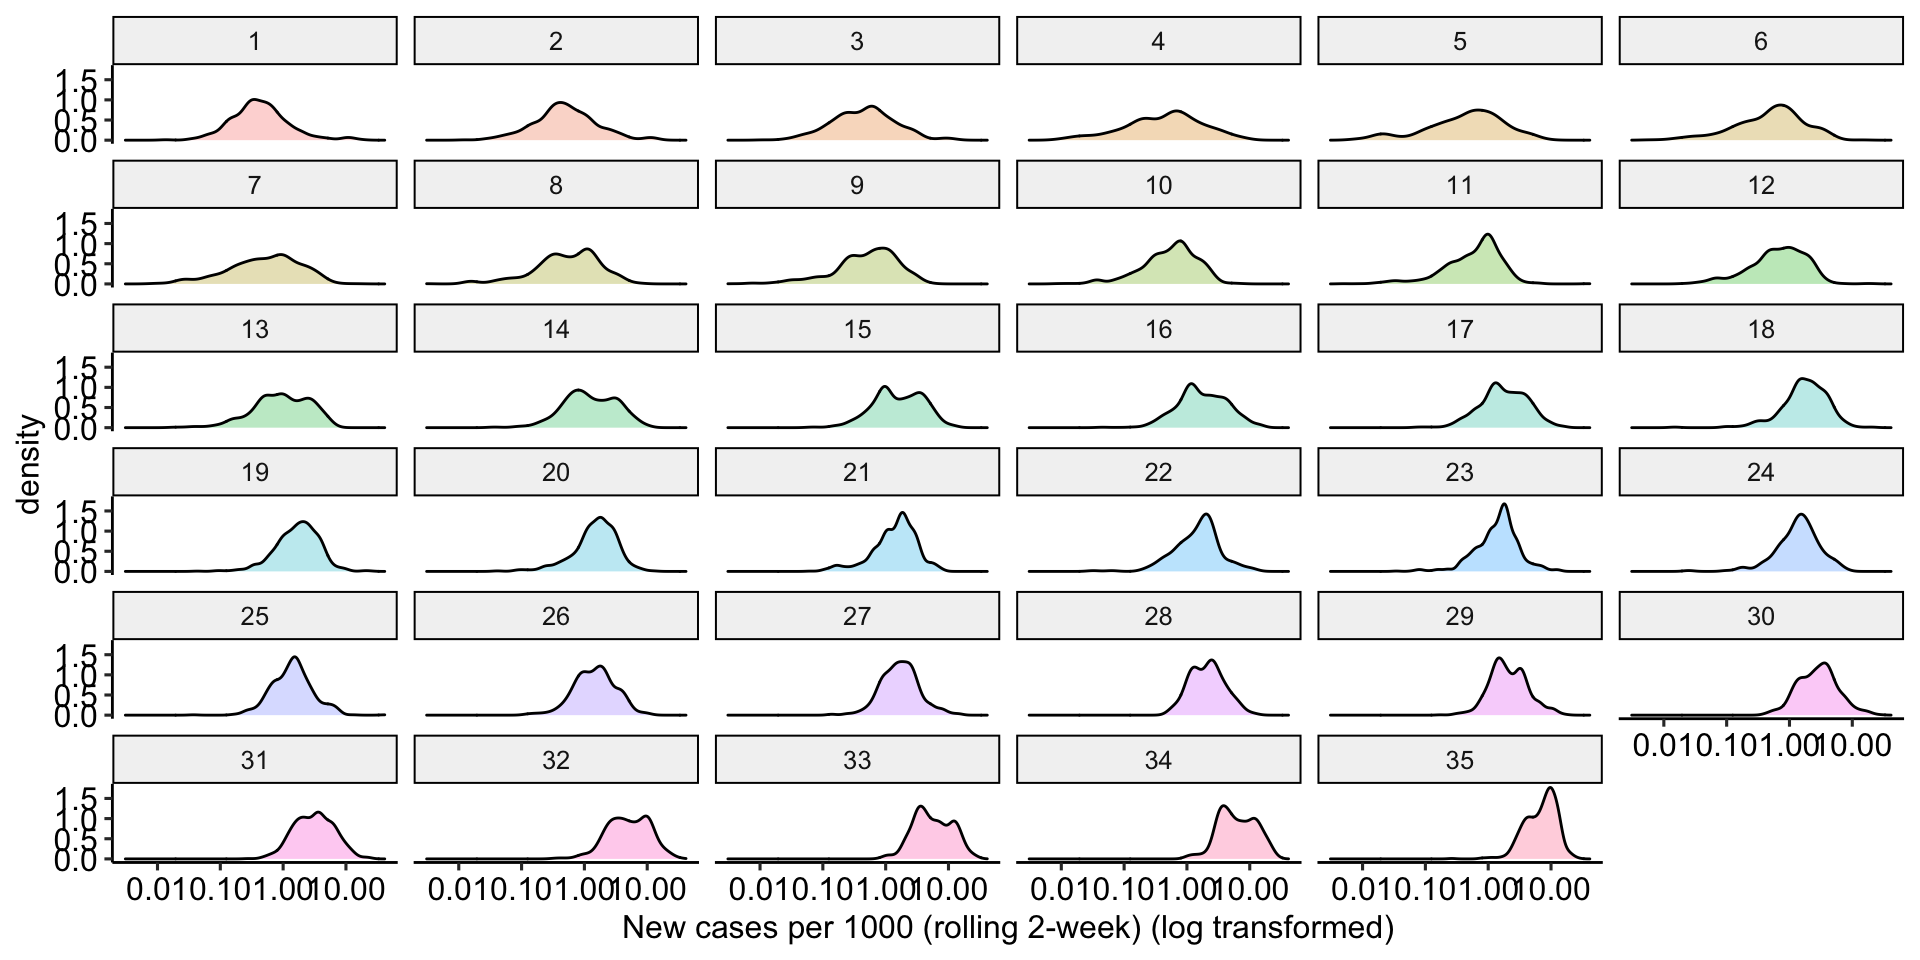
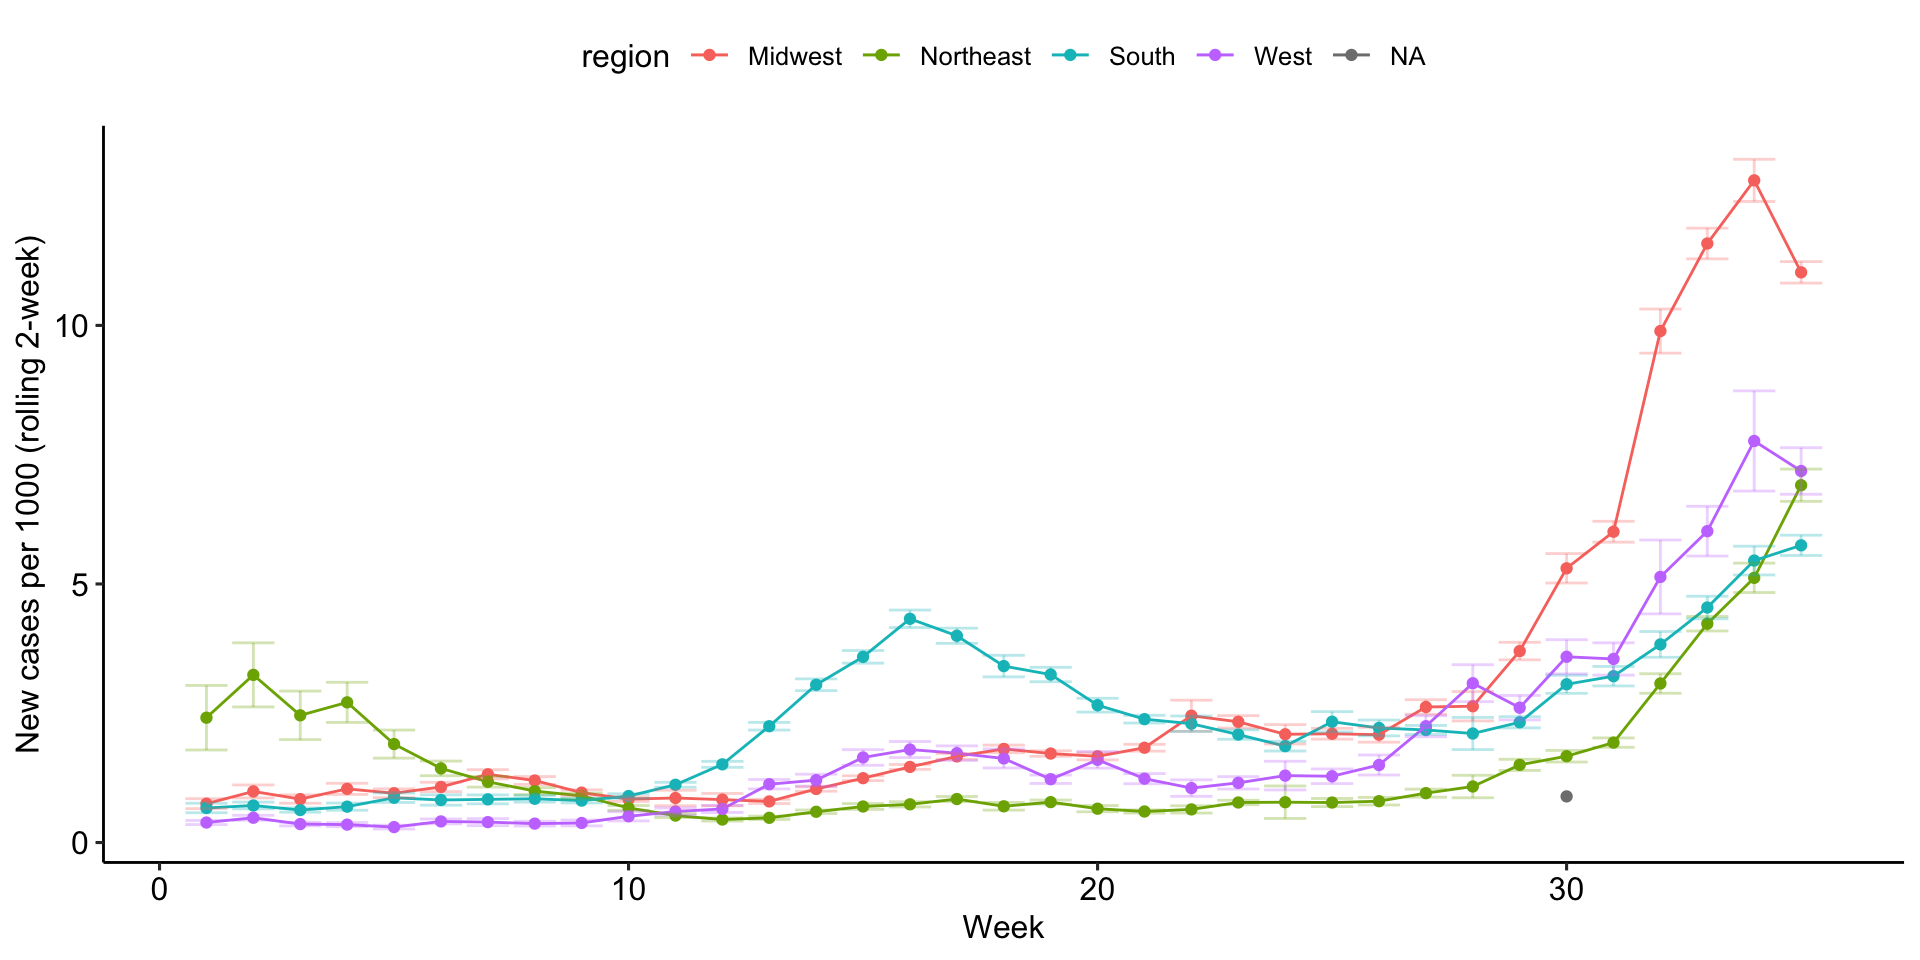
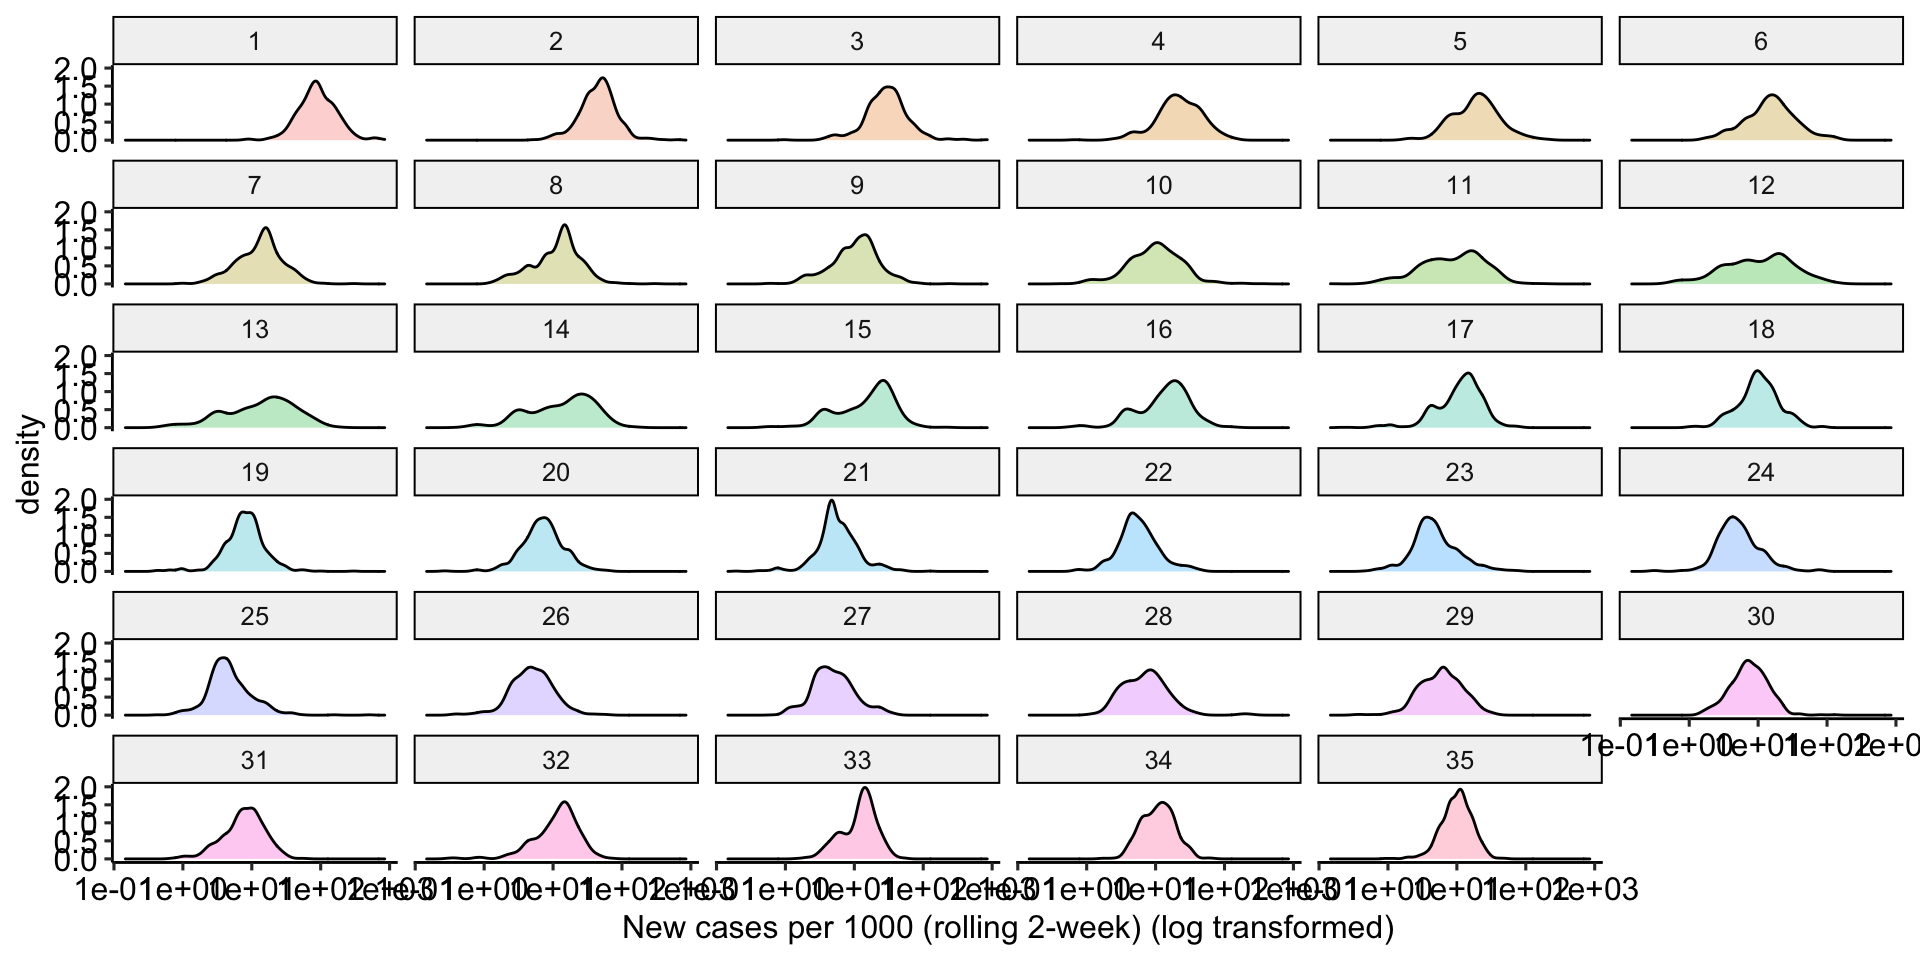
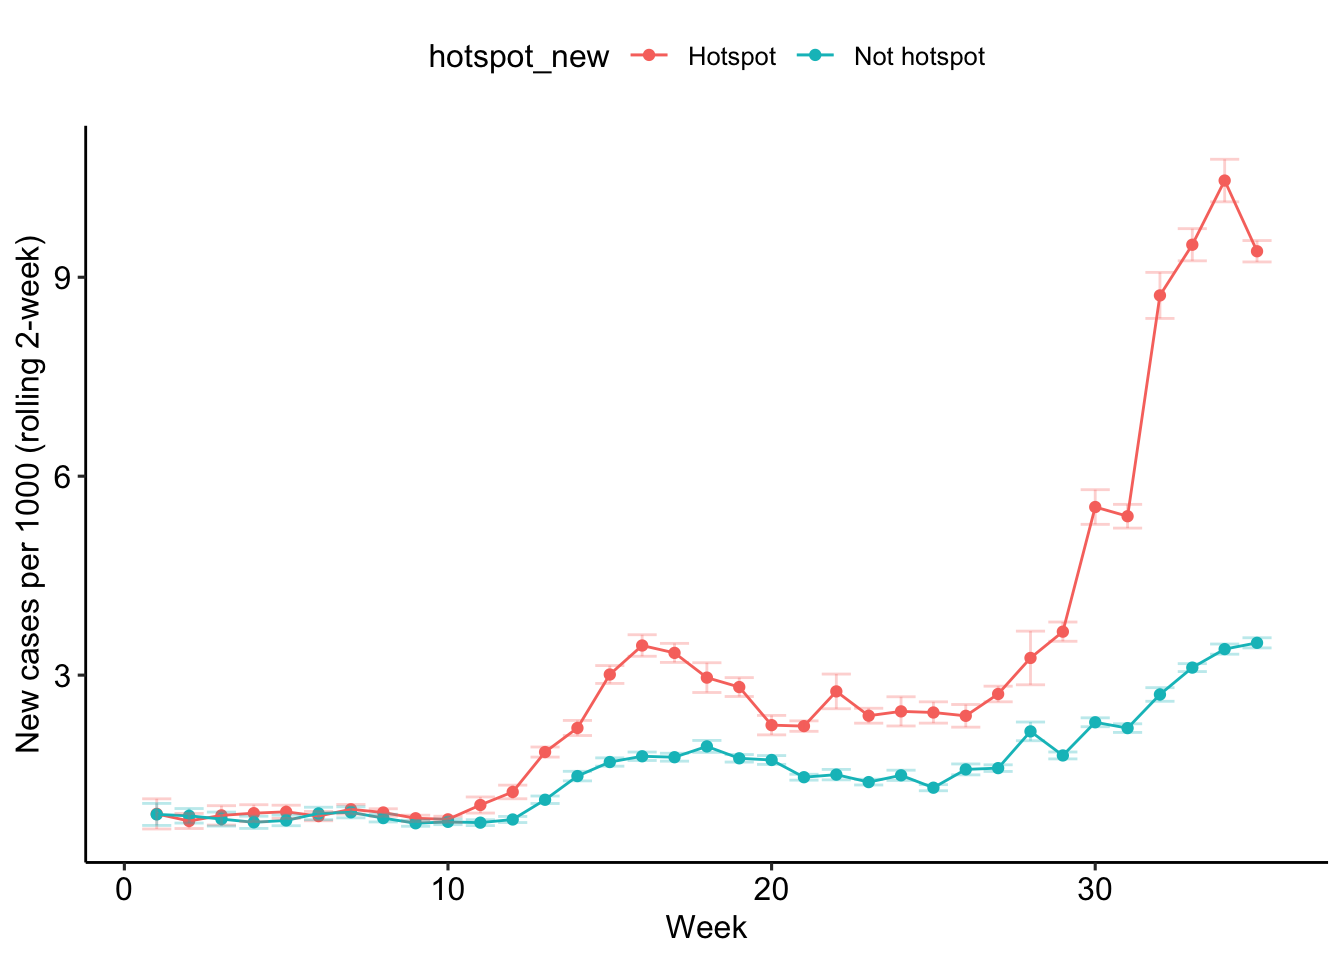
New cases (2-week) per 1000
The number of new cases is the number cases on a given day minus the number of cases the prior day. For any day, we sum the prior two weeks of new cases, divide by the population of that zipcode, and multiply by 1000. This number represents the 2-week rolling average of new cases, per 1000 people, which accounts for population density.
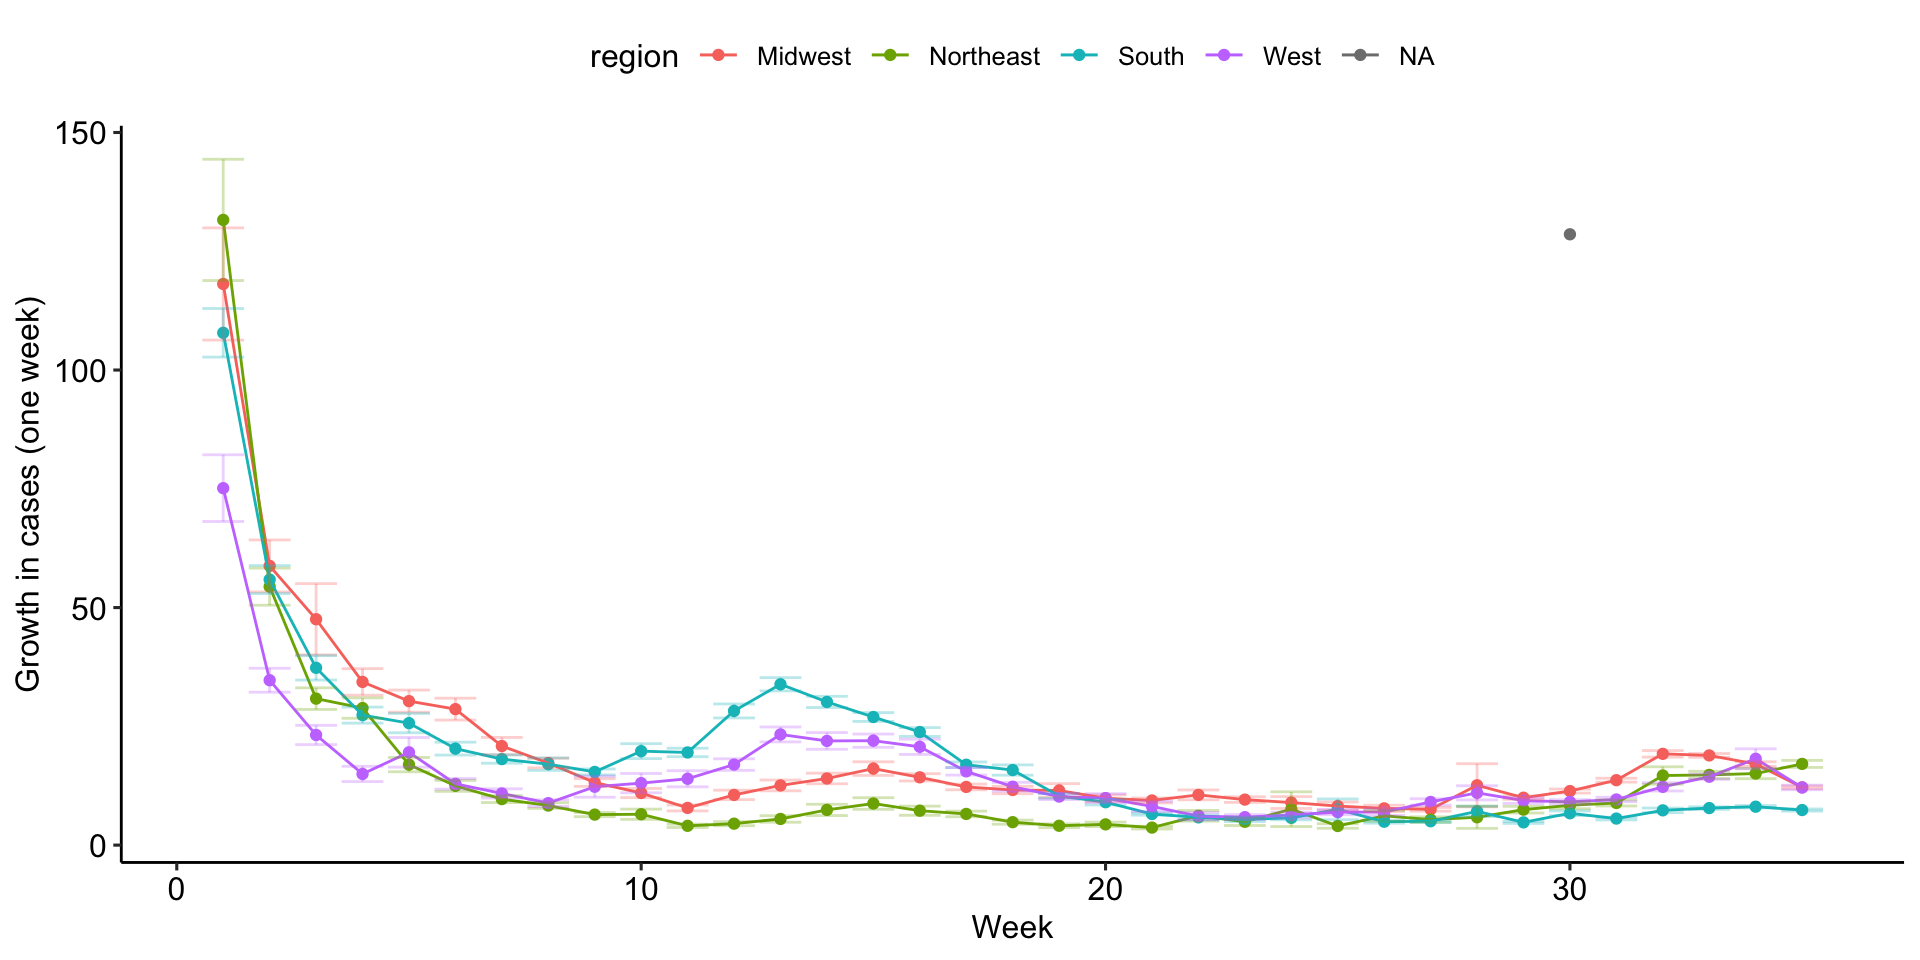
Growth (one-week)
For growth, we sum the number of new cases in the past seven days (ending on the survey date) and divide by the total number of cases one week before. We multiply this number by 100 to yield a percent, specifically, the amount of growth in cases over the past week.
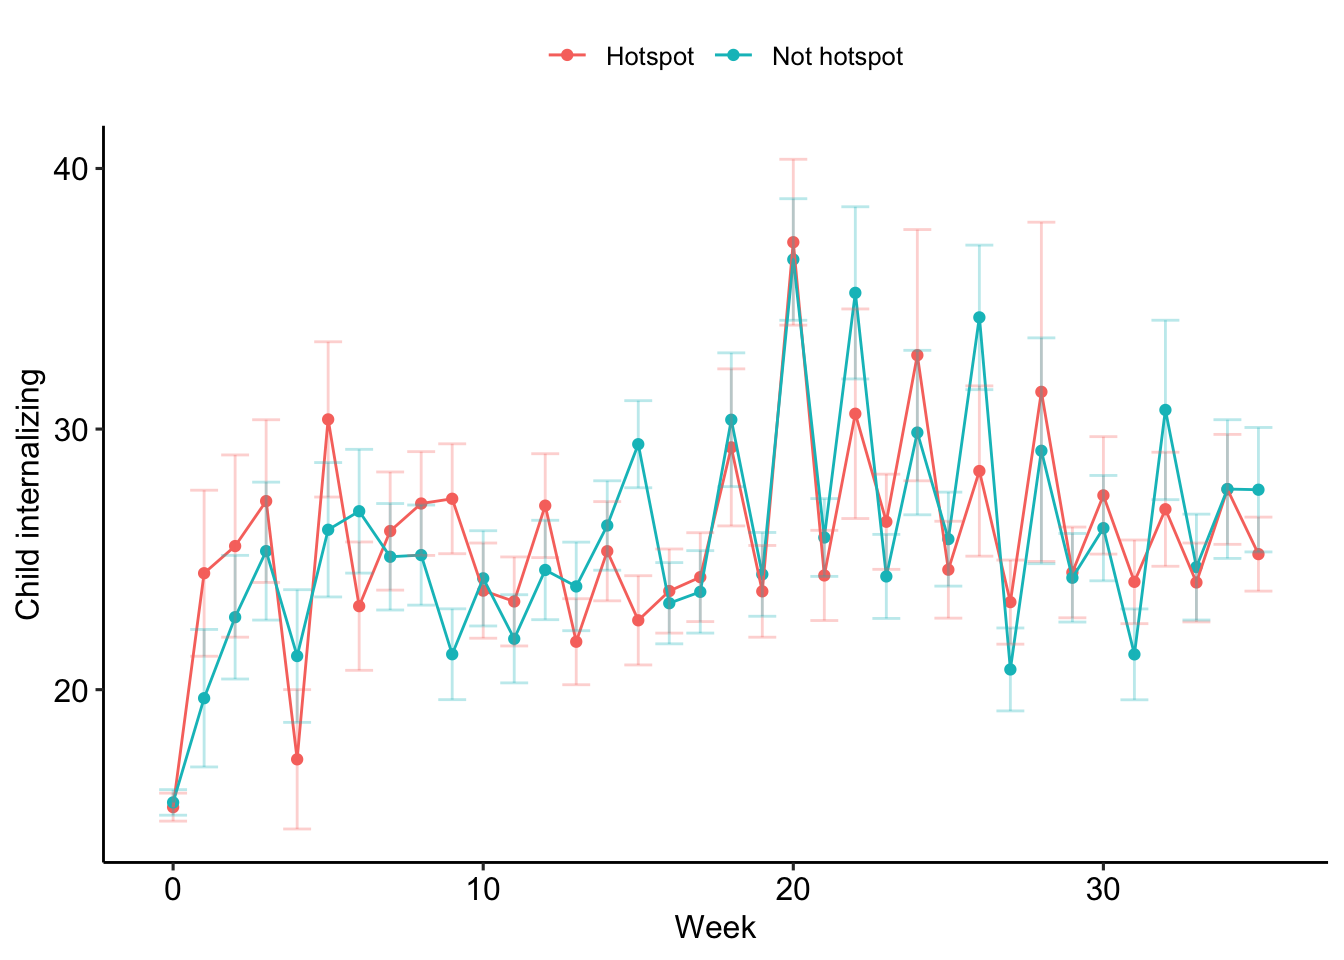
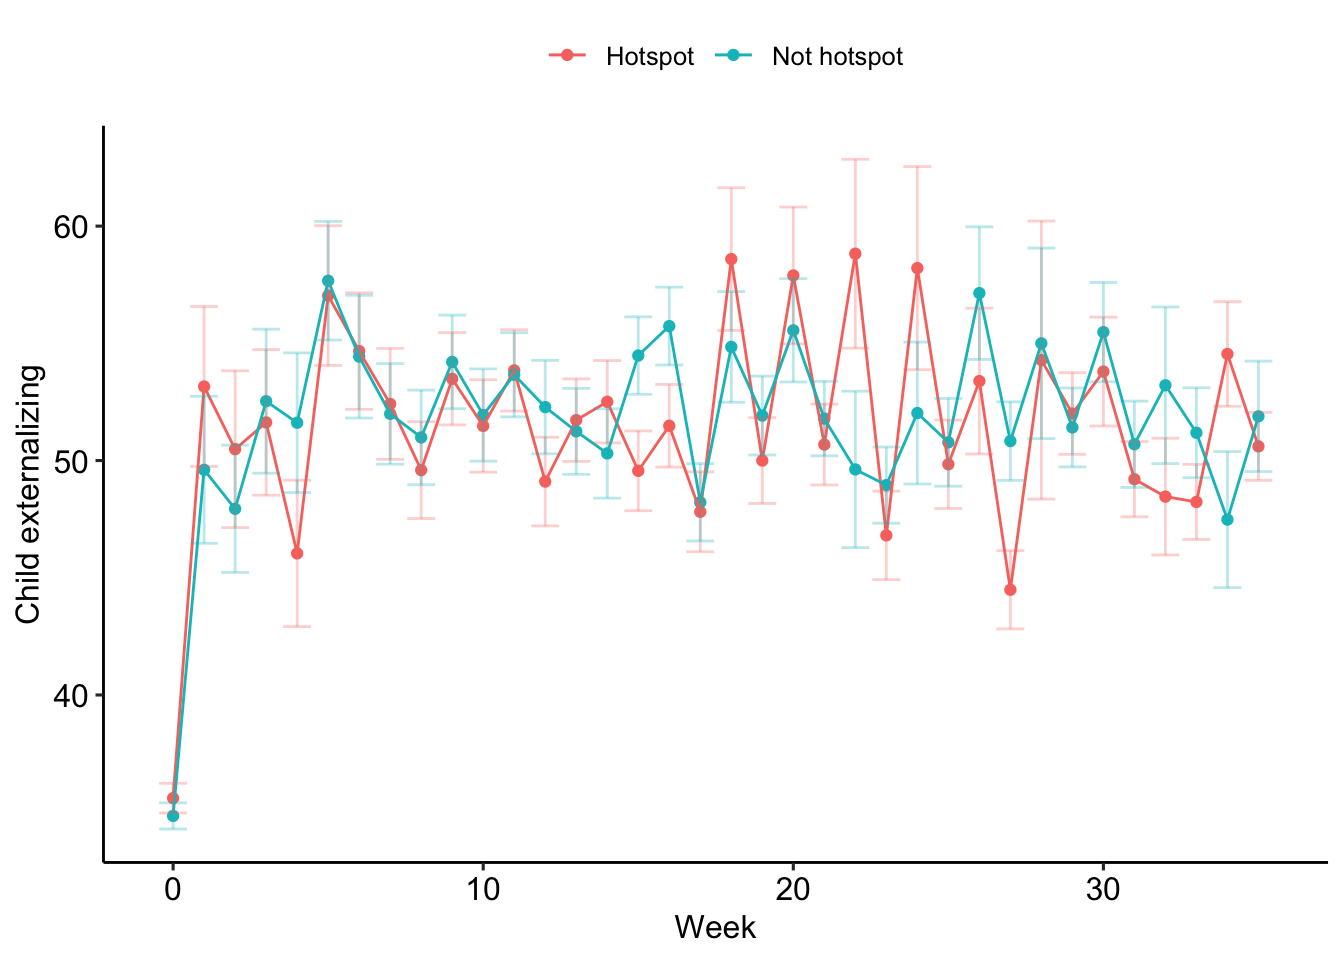
Hotspots
Hotspots are zipcodes that have more than 5 new cases per 1000 in any of Weeks 15, 16, or 17.
New cases
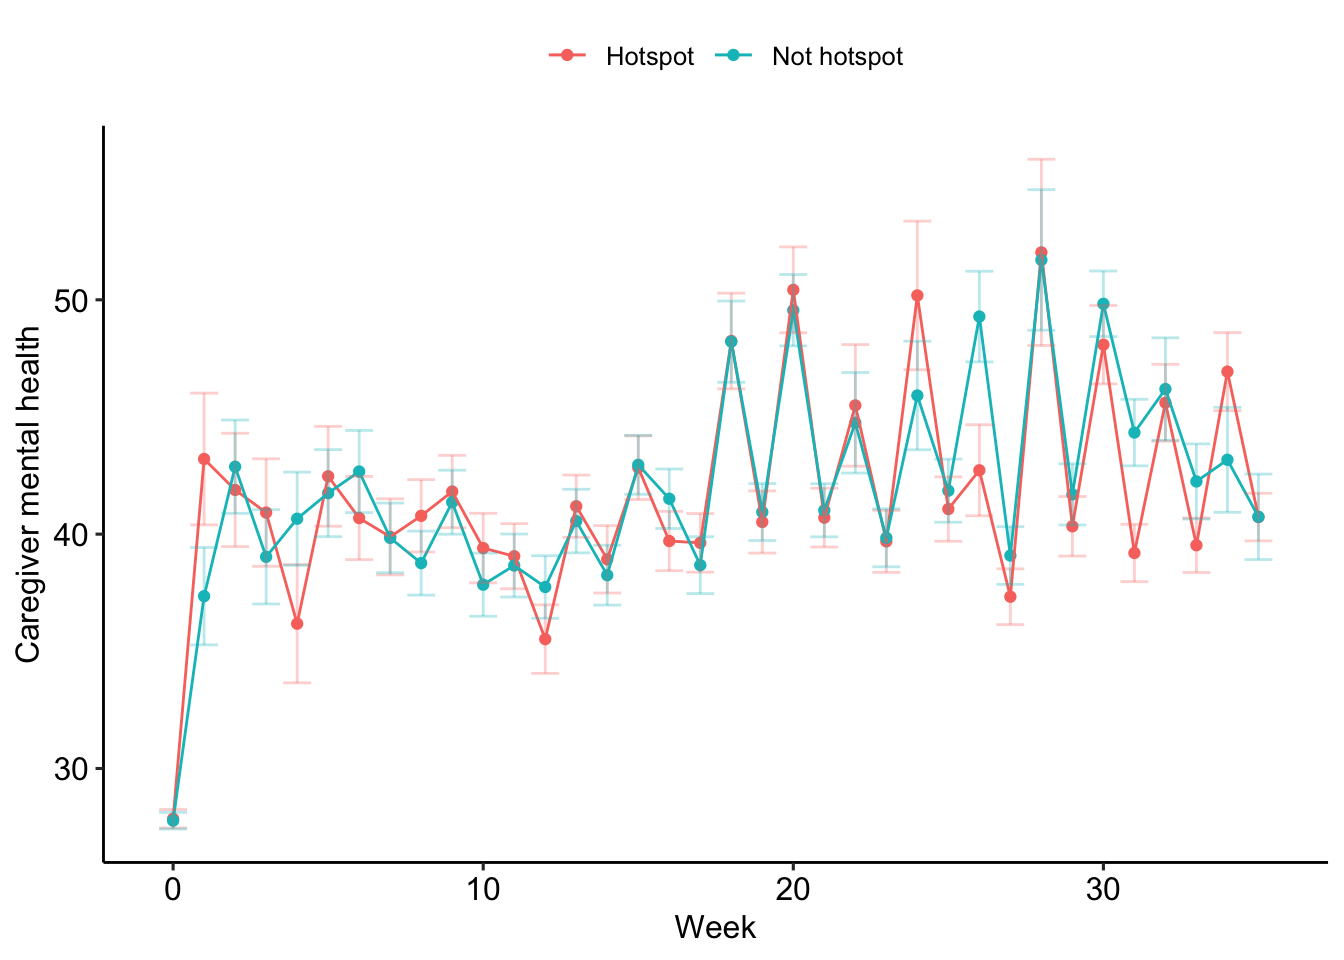
Caregiver mental health
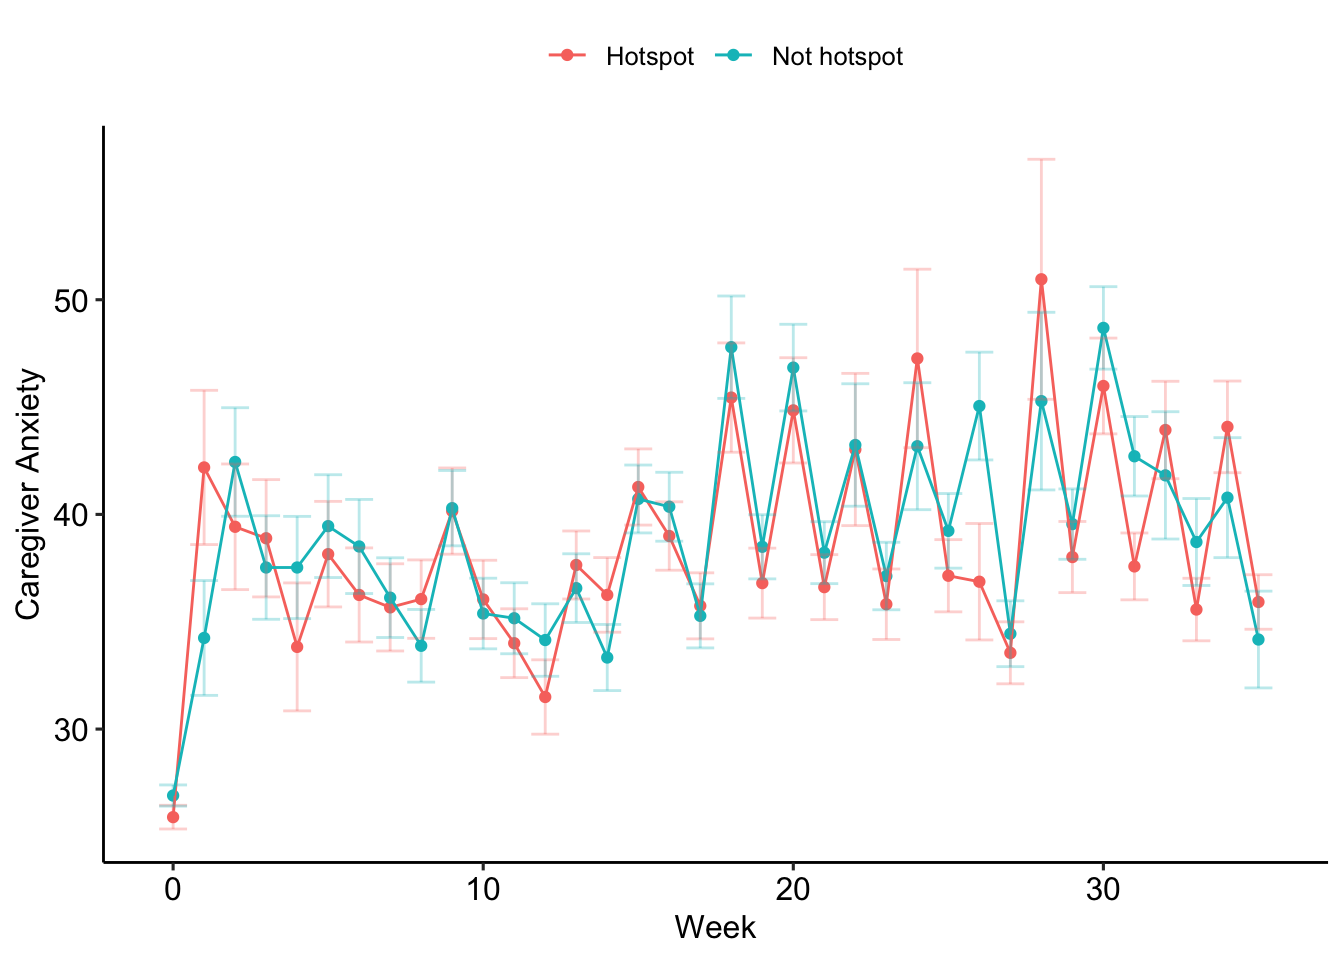
Anxiety
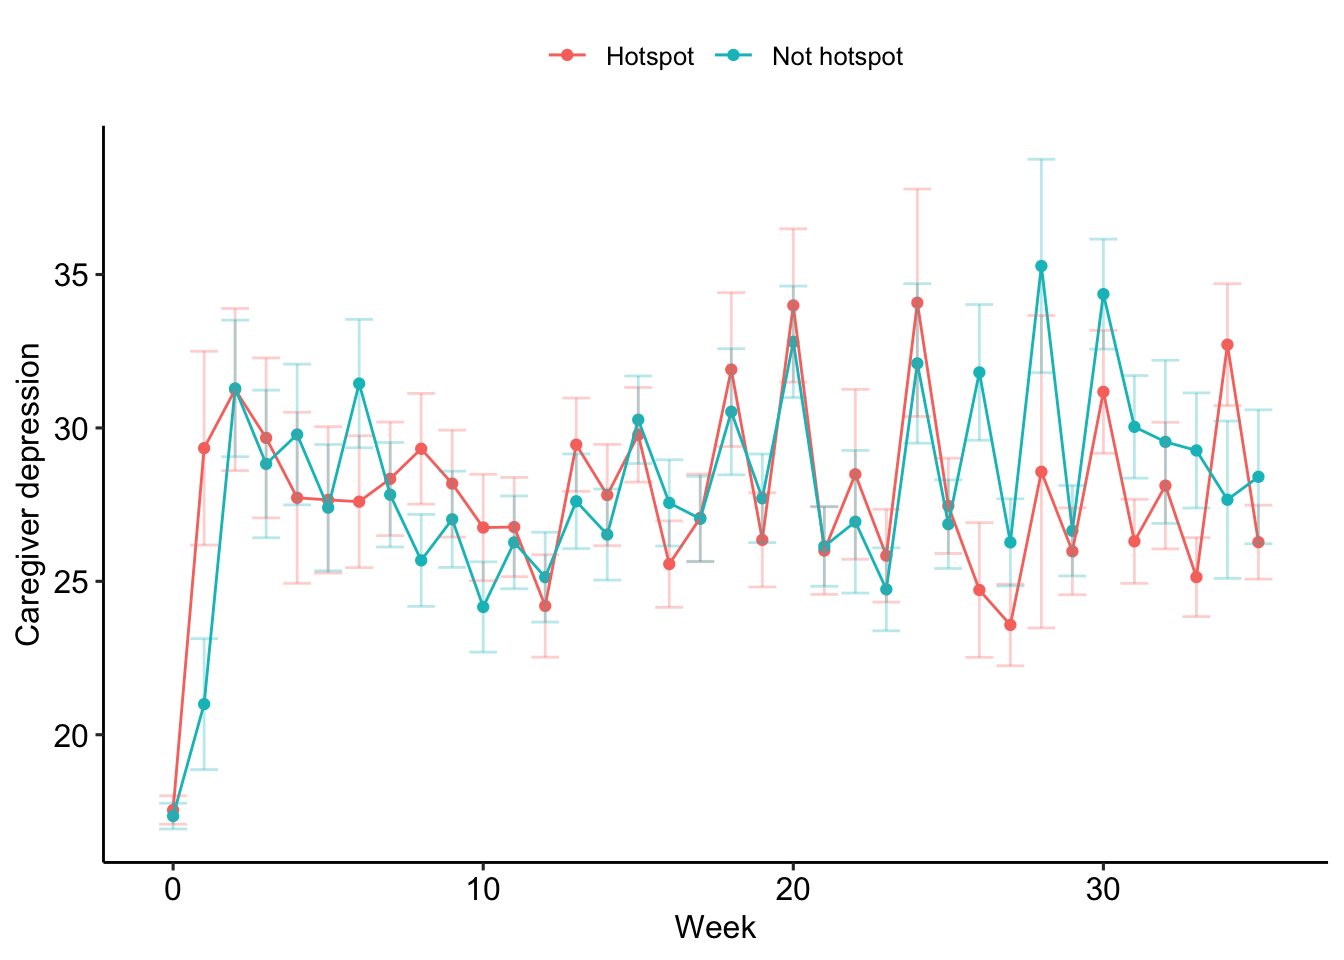
Depression
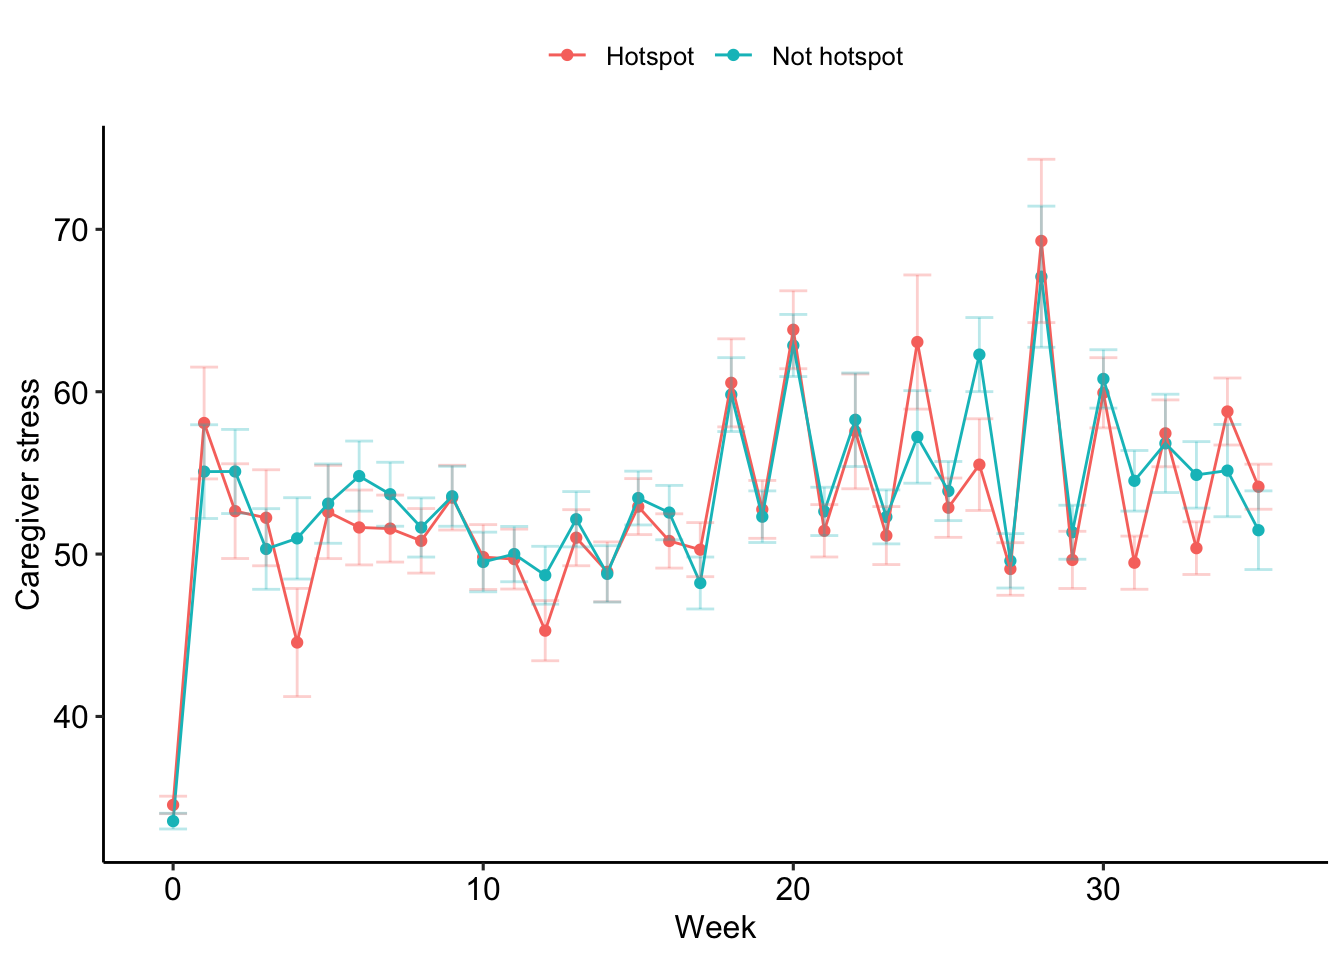
Stress
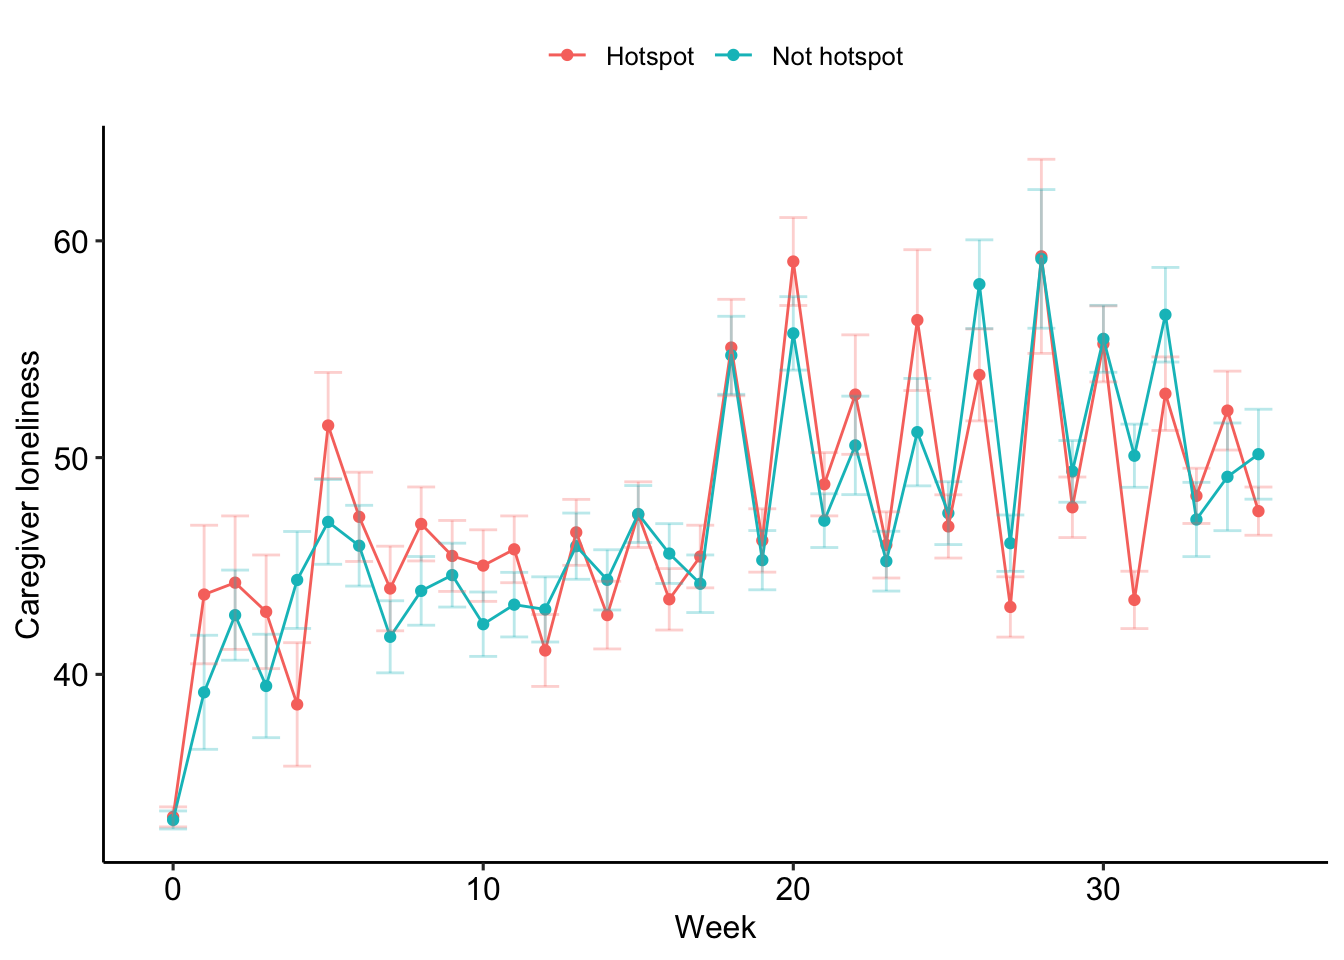
Loneliness
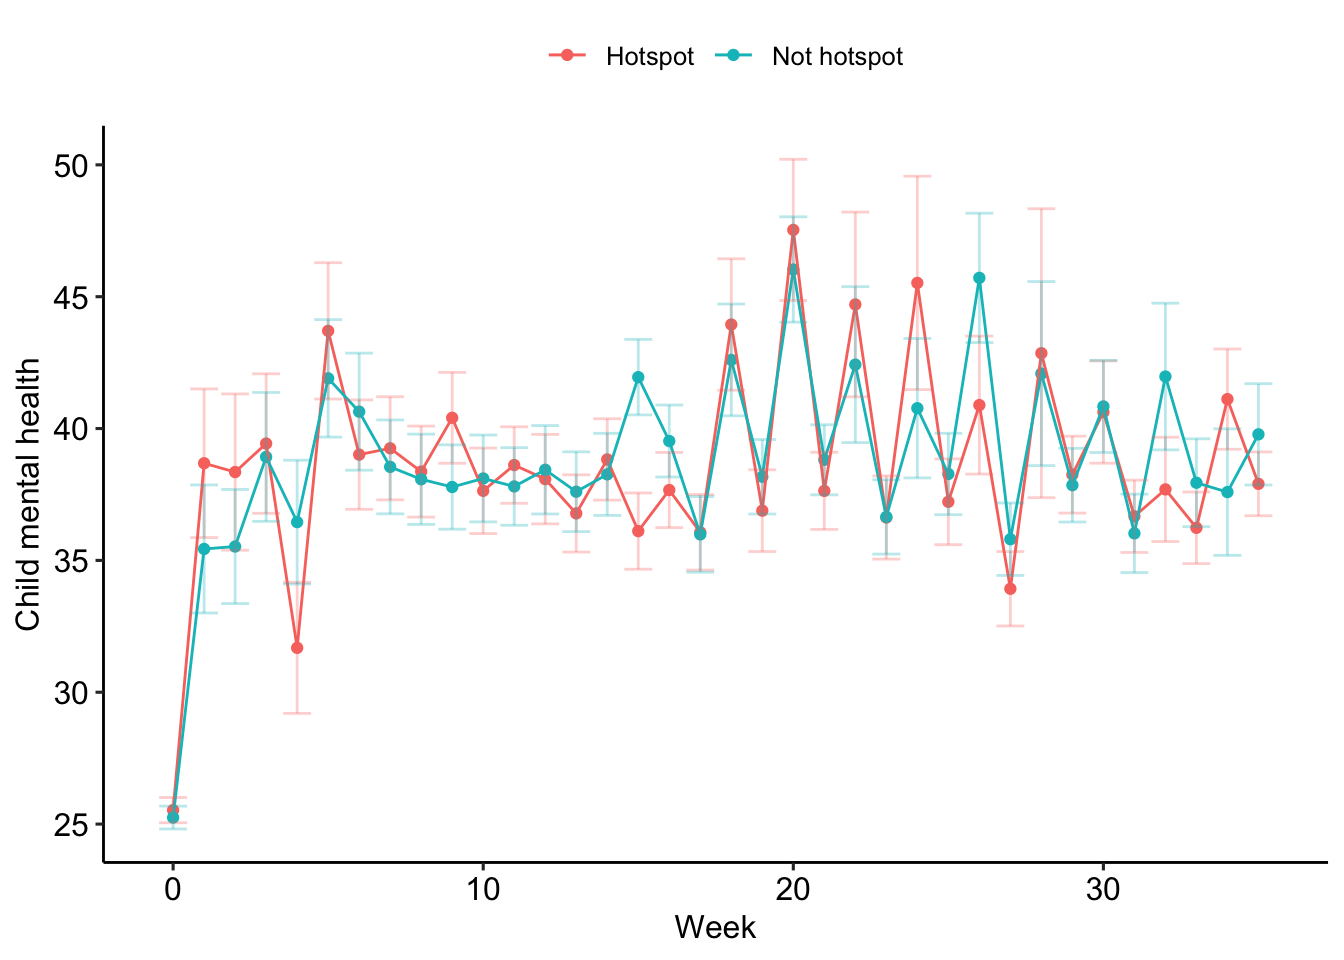
Child mental health
Externalizing
Internalizing