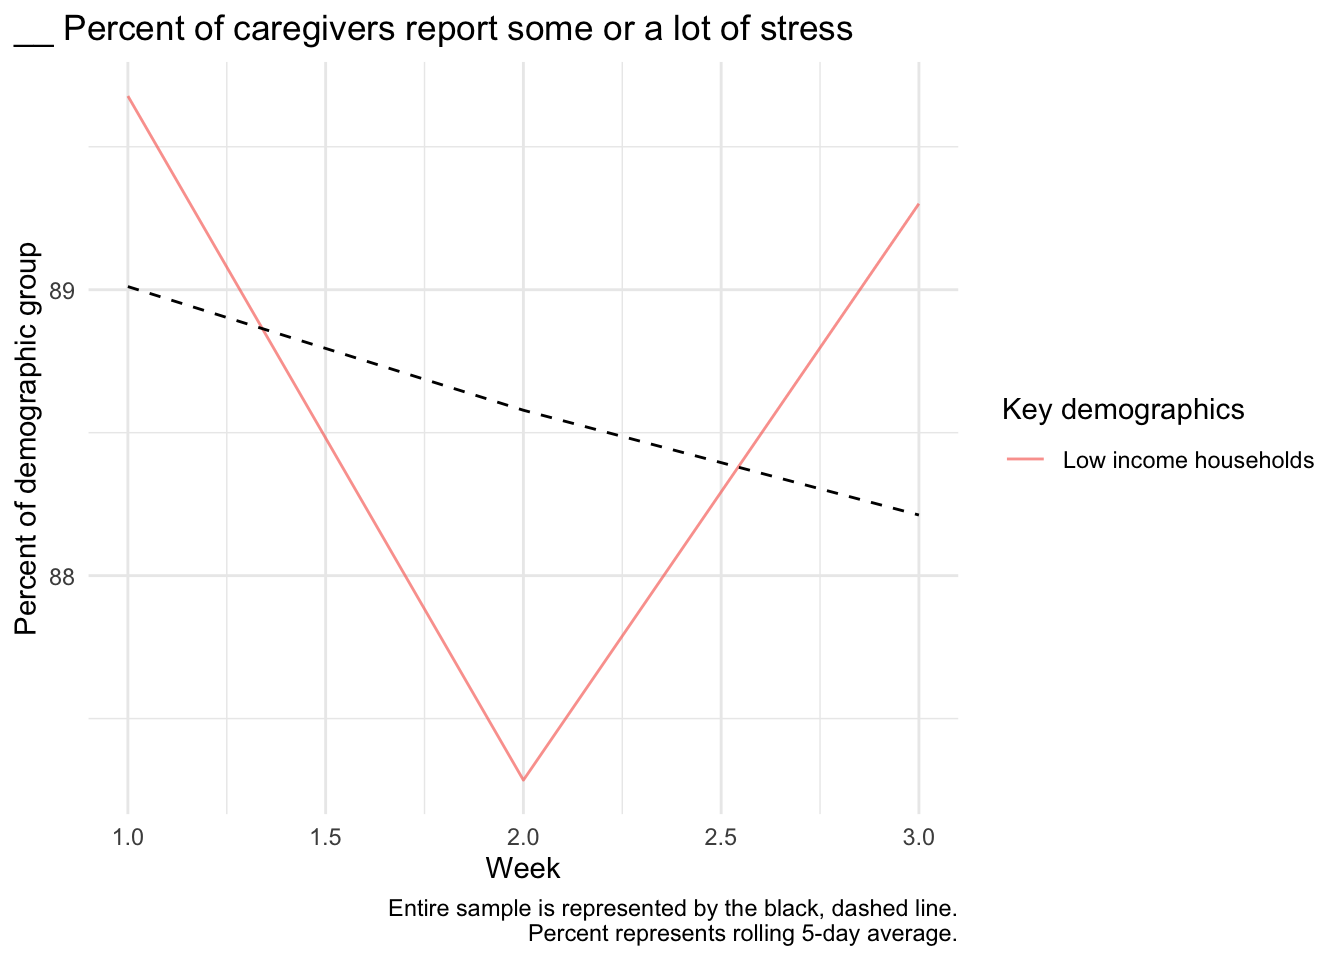
Low income households
In these analyses, families are considered to be a low-income household if their reported annual income is less than 2 times the Federal Poverty Level for a household of their size. Household size is calculated as the number of children in the household plus one (if the caregiver reports being singled, divorced, widowed, romantically involved but living papart, or not in any kind of relationship) or plus two otherwise.
Analyses May 7
Pre-panedemic well-being
** Comparison of income groups at baseline**
| emotion | test |
|---|---|
Well-being during shelter-in-place
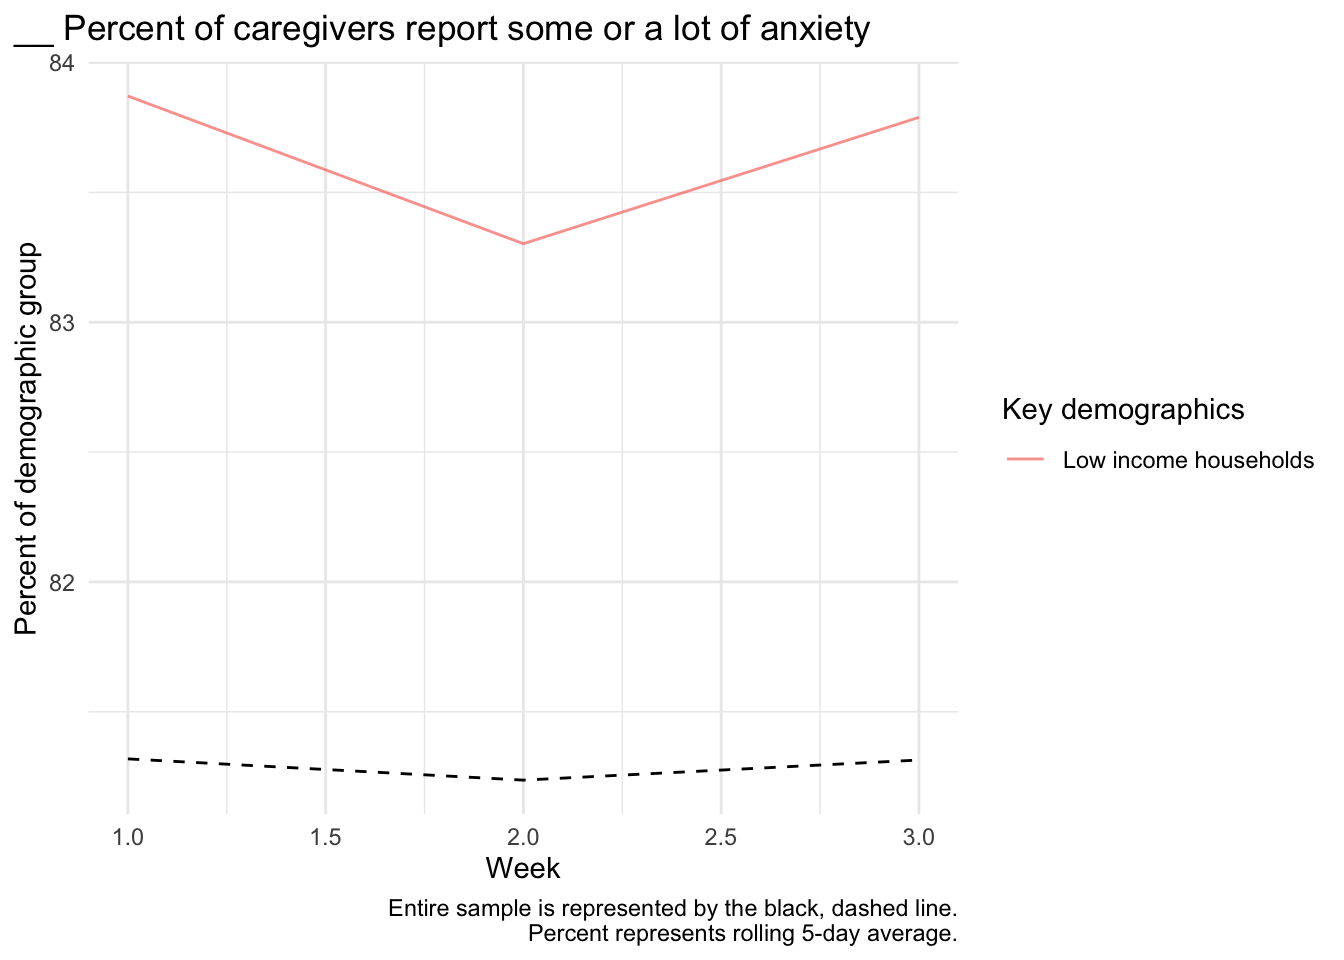
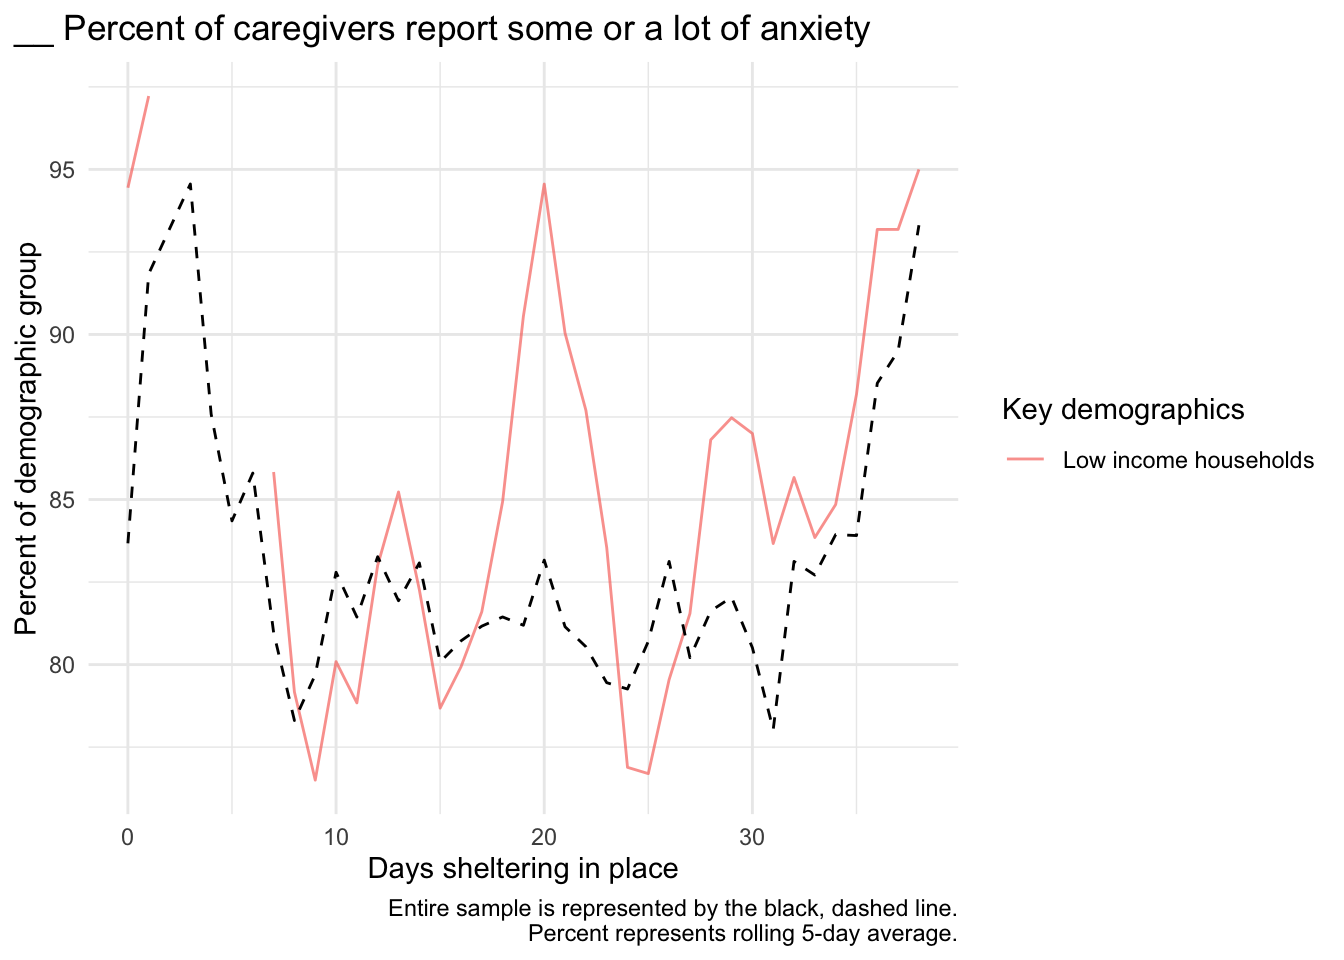
Caregiver anxiety
Plots
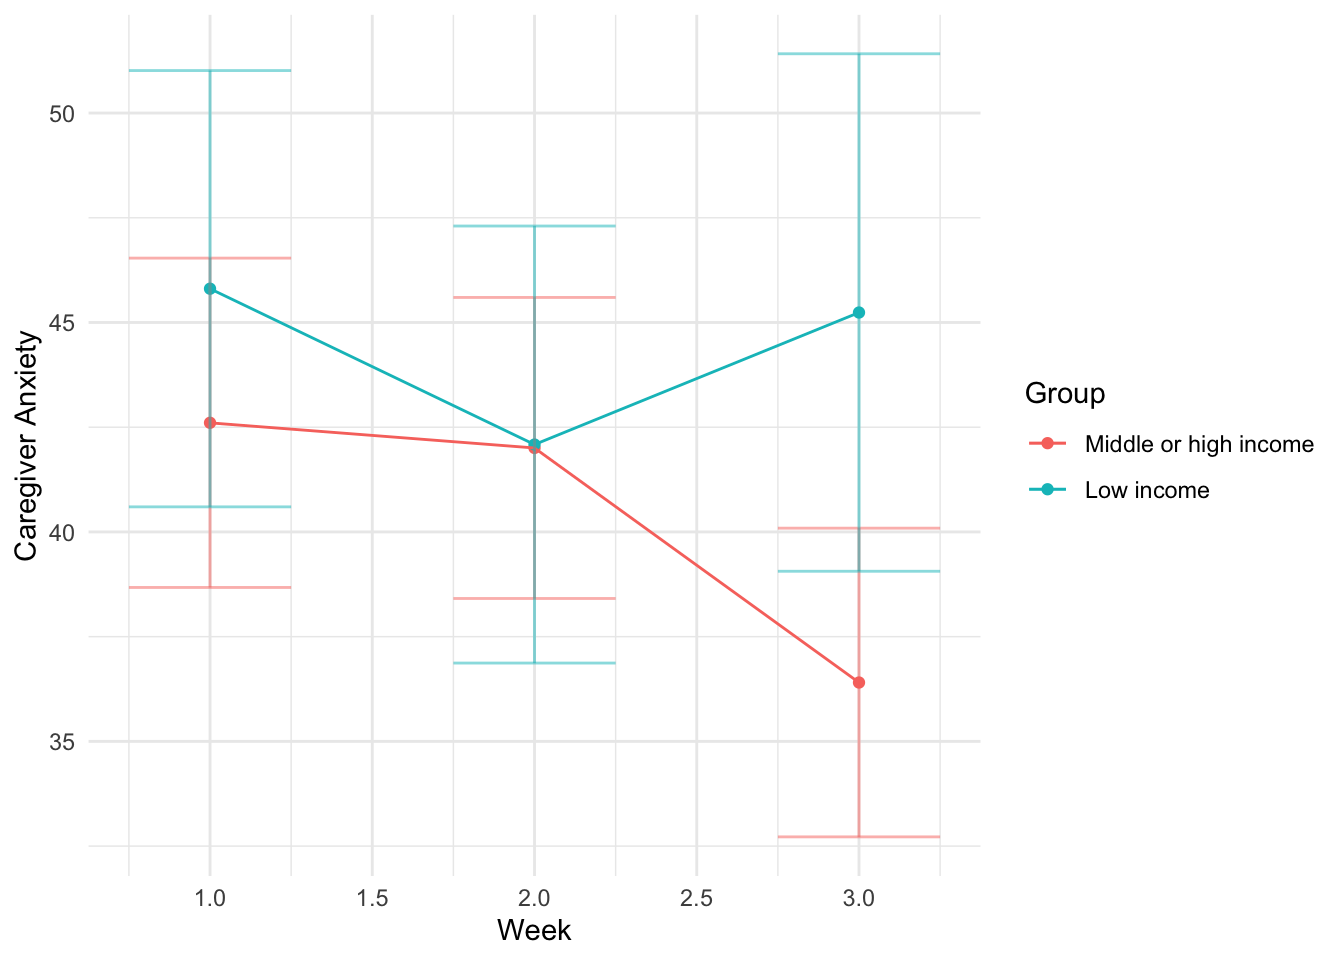
Test of slope
Weeks 1+
Baseline model
| Term | Coef | SE | t | p |
|---|---|---|---|---|
| Fixed effects | ||||
| (Intercept) | 46.50 | 2.91 | 15.96 | 0.000 |
| Week | -3.05 | 1.37 | -2.22 | 0.026 |
| poverty | -1.16 | 5.01 | -0.23 | 0.816 |
| Week:poverty | 2.53 | 2.42 | 1.04 | 0.296 |
| Random effects | ||||
| sd__(Intercept) | 27.63 | |||
| sd__Observation | 15.79 | |||
Can we explain the effect?
| Mediator | Coefficient (Income) | Coefficient of mediator |
|---|---|---|
| access_online | 0.71 | 2.66 |
| black | 2.94 | 2.33 |
| child_insurance | -0.20 | 2.57 |
| decrease_nonfamilyCC | 5.71* | 3.42 |
| difficulty_basics | -1.58 | 3.21 |
| employment_decreased | 2.29 | 4.51 |
| free_food | 3.49 | 0.91 |
| income_decreaed | 0.01 | 2.95 |
| insurance | -0.62 | 2.61 |
| latinx | -2.13 | 3.24 |
| losejob_sickleave | -7.43* | 4.49 |
| lost_free_lunch | -0.67 | 2.53 |
| minority | 0.72 | 2.43 |
| support_decrease | -1.37 | 2.46 |
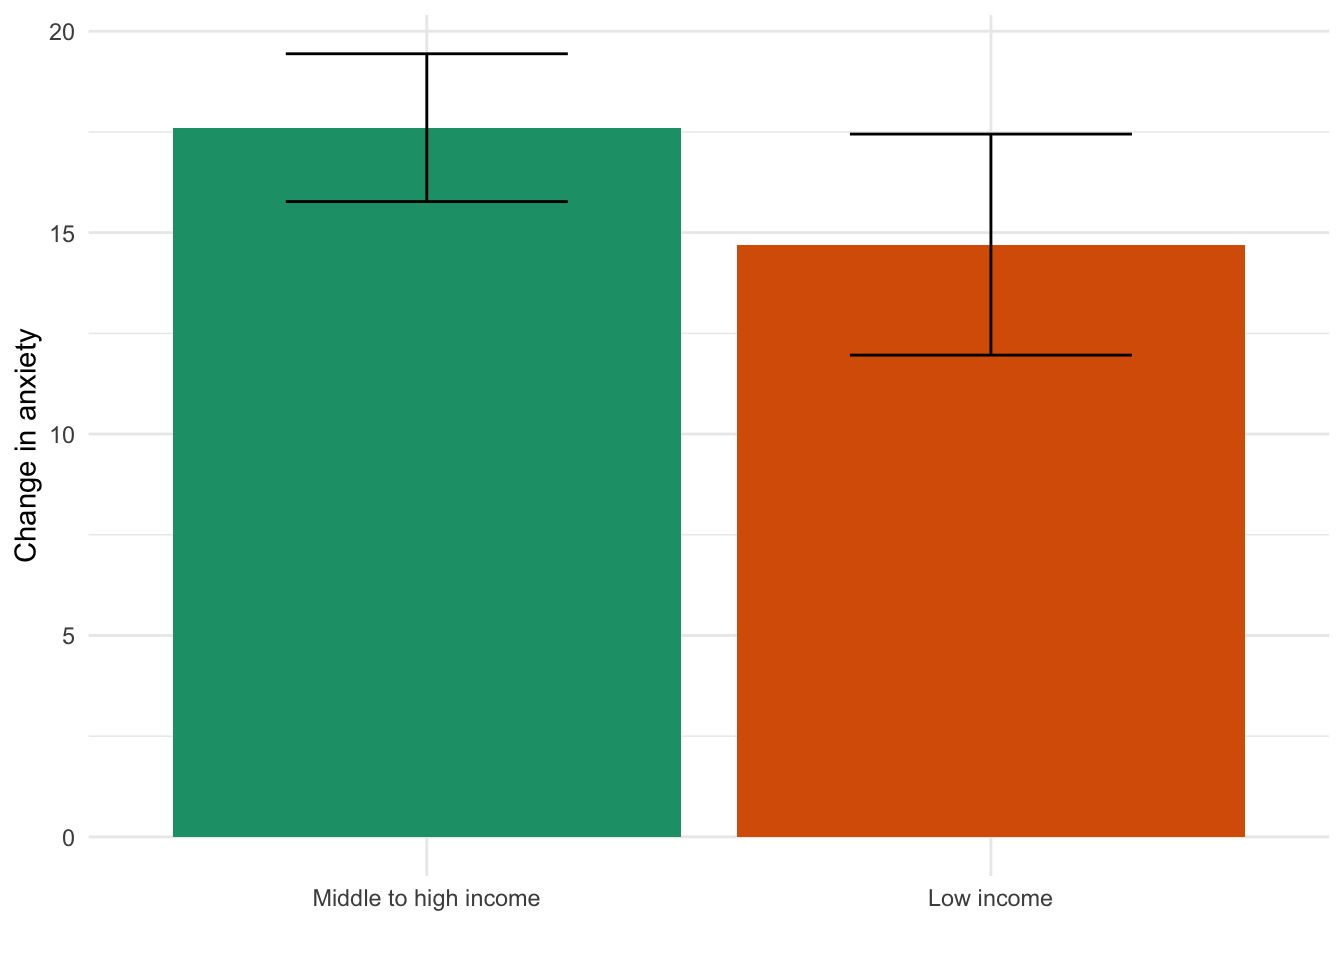
Week 0 to first response
Baseline model
| Term | Coef | SE | t | p |
|---|---|---|---|---|
| (Intercept) | 17.61 | 0.95 | 18.63 | 0.000 |
| poverty | -2.90 | 1.66 | -1.75 | 0.081 |
Can we explain the effect?
| Mediator | Coefficient (Income) | Coefficient of mediator |
|---|---|---|
| access_online | 6.21* | -2.25 |
| black | -2.15 | -2.76 |
| child_insurance | 4.73 | -2.62 |
| decrease_nonfamilyCC | 4.68* | -2.14 |
| difficulty_basics | -0.17 | -2.86 |
| employment_decreased | 3.85* | -4.83* |
| free_food | -4.56* | -1.21 |
| income_decreaed | 3.05 | -3.54* |
| insurance | 2.87 | -2.58 |
| latinx | 1.34 | -2.84 |
| losejob_sickleave | 1.93 | -4.82* |
| lost_free_lunch | 5.04* | -3.29* |
| minority | -0.80 | -2.81 |
| support_decrease | 14.27* | -2.19 |
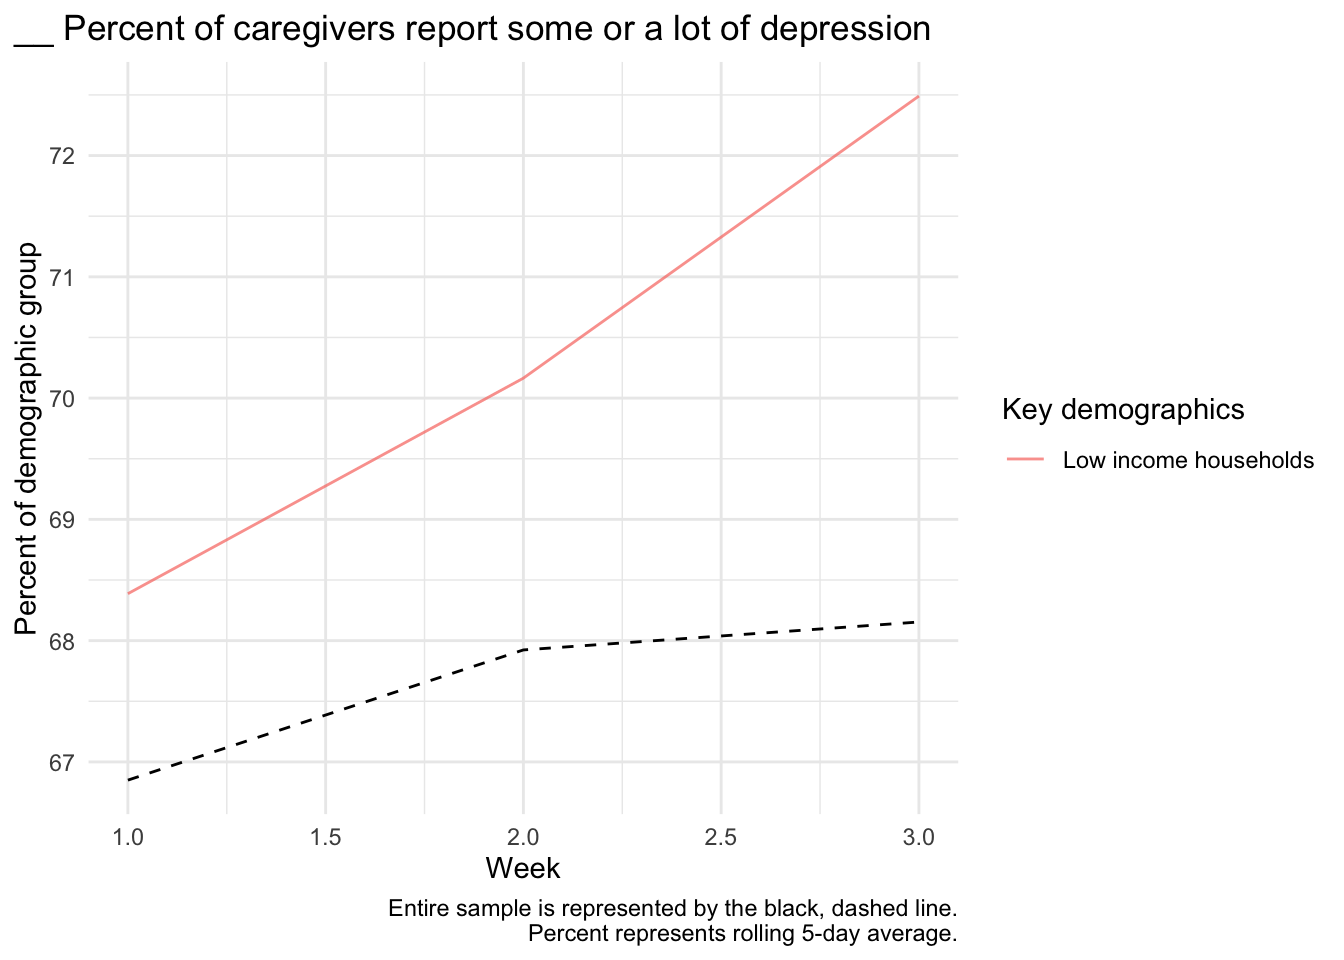
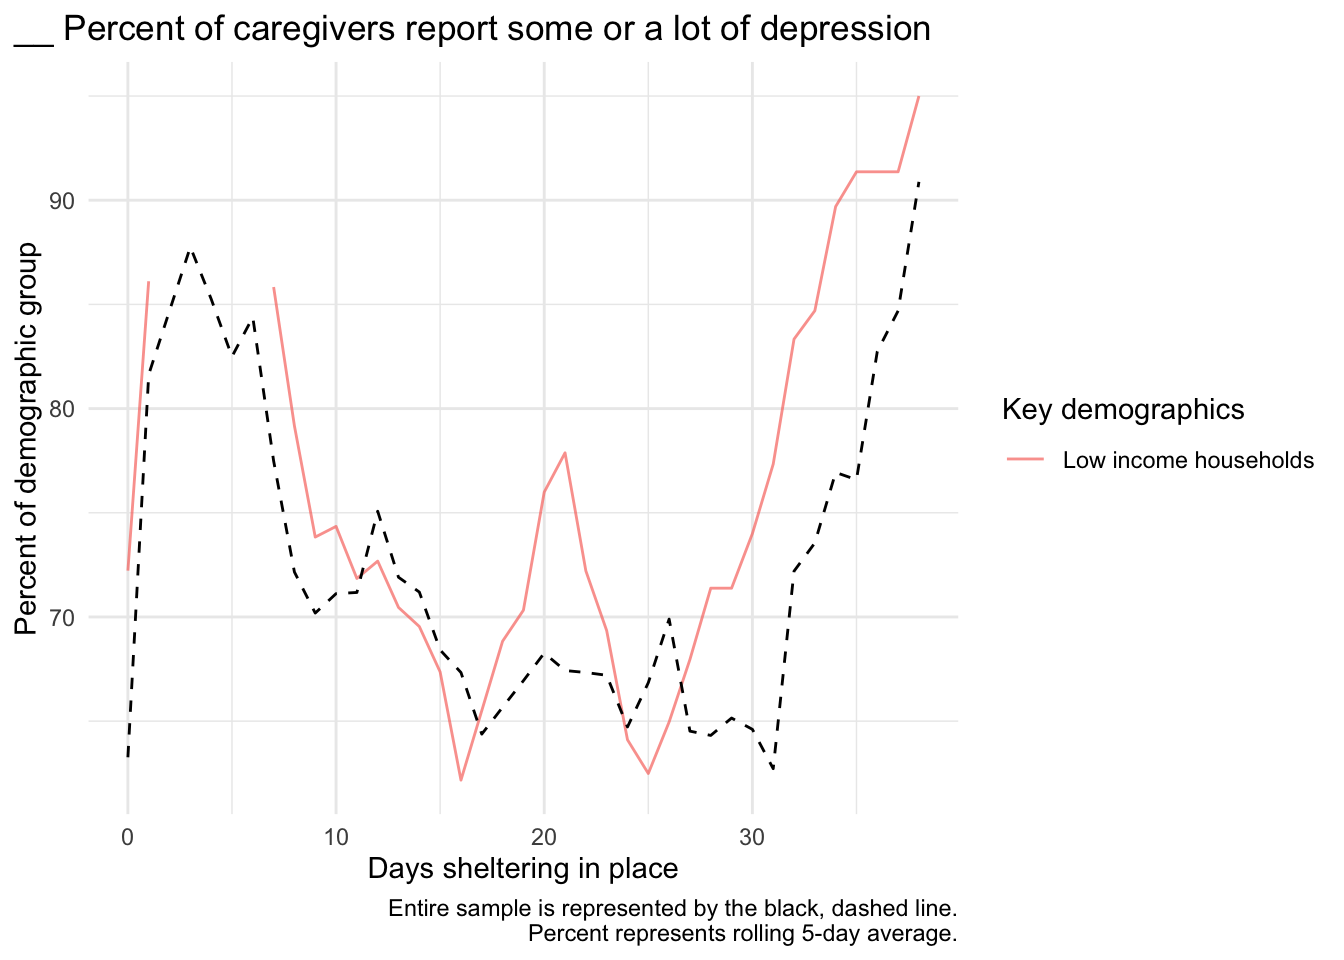
Caregiver depression
Plots
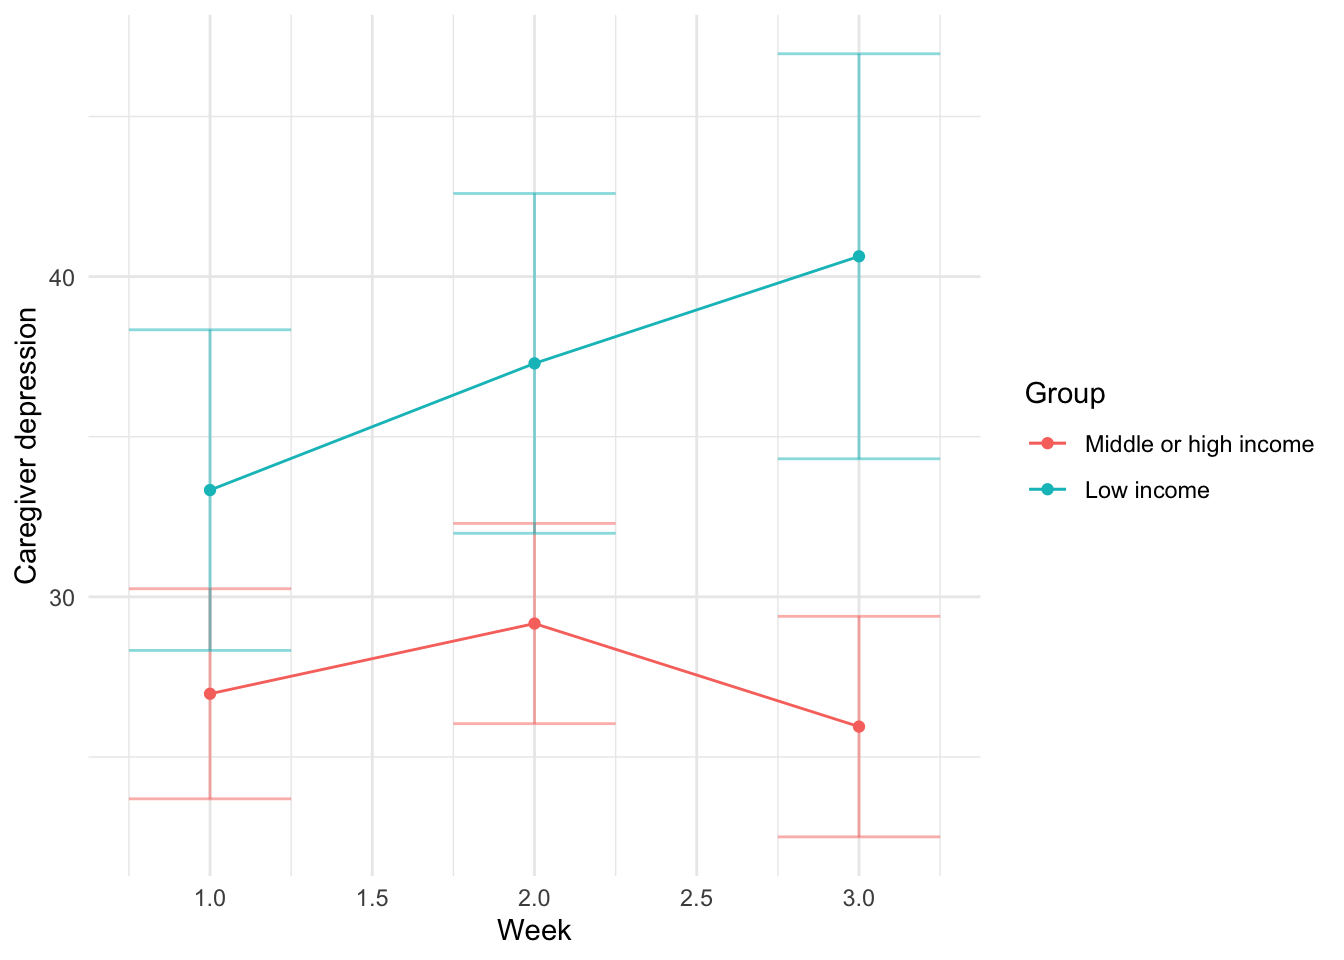
Test of slope
Weeks 1+
Baseline model
| Term | Coef | SE | t | p |
|---|---|---|---|---|
| Fixed effects | ||||
| (Intercept) | 28.35 | 2.67 | 10.61 | 0.000 |
| Week | -0.46 | 1.26 | -0.37 | 0.713 |
| poverty | 1.40 | 4.59 | 0.31 | 0.760 |
| Week:poverty | 4.13 | 2.22 | 1.86 | 0.063 |
| Random effects | ||||
| sd__(Intercept) | 25.32 | |||
| sd__Observation | 14.47 | |||
Can we explain the effect?
| Mediator | Coefficient (Income) | Coefficient of mediator |
|---|---|---|
| access_online | 0.02 | 4.18 |
| black | 0.48 | 4.04 |
| child_insurance | 0.58 | 4.13 |
| decrease_nonfamilyCC | 5.35* | 5.04* |
| difficulty_basics | 1.18 | 4.23 |
| employment_decreased | 0.61 | 6.11* |
| free_food | 0.63 | 3.56 |
| income_decreaed | 0.45 | 4.53* |
| insurance | 1.87 | 4.13 |
| latinx | -2.07 | 4.71* |
| losejob_sickleave | -2.63 | 4.49 |
| lost_free_lunch | 0.23 | 4.08 |
| minority | 1.97 | 3.89 |
| support_decrease | -1.59 | 3.73 |
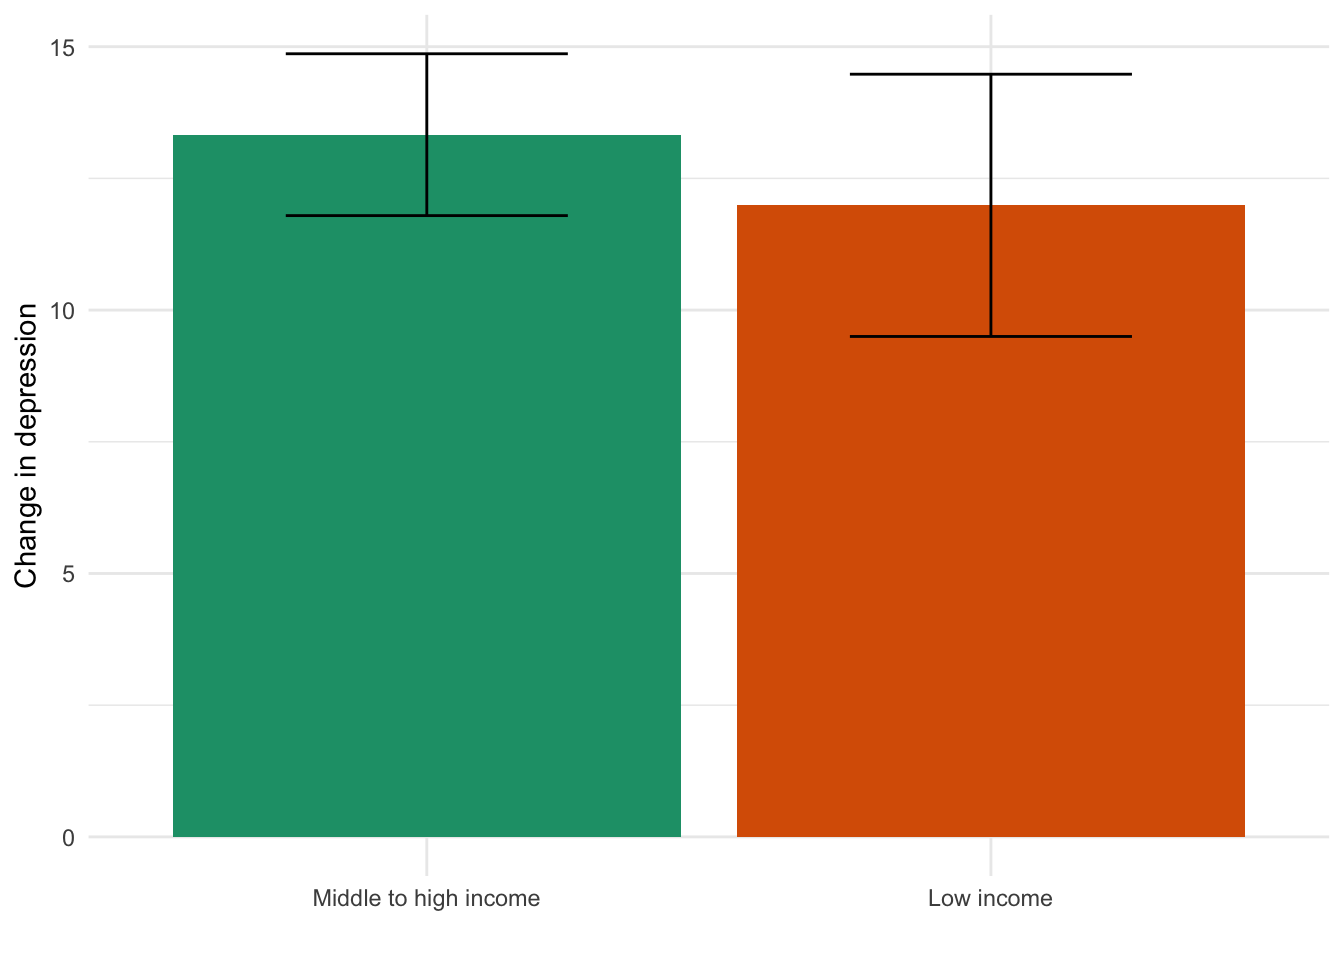
Week 0 to first response
Baseline model
| Term | Coef | SE | t | p |
|---|---|---|---|---|
| (Intercept) | 13.33 | 0.81 | 16.37 | 0.000 |
| poverty | -1.34 | 1.43 | -0.94 | 0.349 |
Can we explain the effect?
| Mediator | Coefficient (Income) | Coefficient of mediator |
|---|---|---|
| access_online | 3.56* | -0.97 |
| black | -2.43 | -1.21 |
| child_insurance | 2.52 | -1.17 |
| decrease_nonfamilyCC | 3.29* | -0.80 |
| difficulty_basics | 4.69* | -2.48 |
| employment_decreased | 6.19* | -2.67 |
| free_food | -0.80 | -1.05 |
| income_decreaed | 6.43* | -2.42 |
| insurance | -0.77 | -1.40 |
| latinx | 0.48 | -1.25 |
| losejob_sickleave | 5.41* | -1.74 |
| lost_free_lunch | 2.49 | -1.53 |
| minority | -0.66 | -1.28 |
| support_decrease | 14.60* | -0.79 |
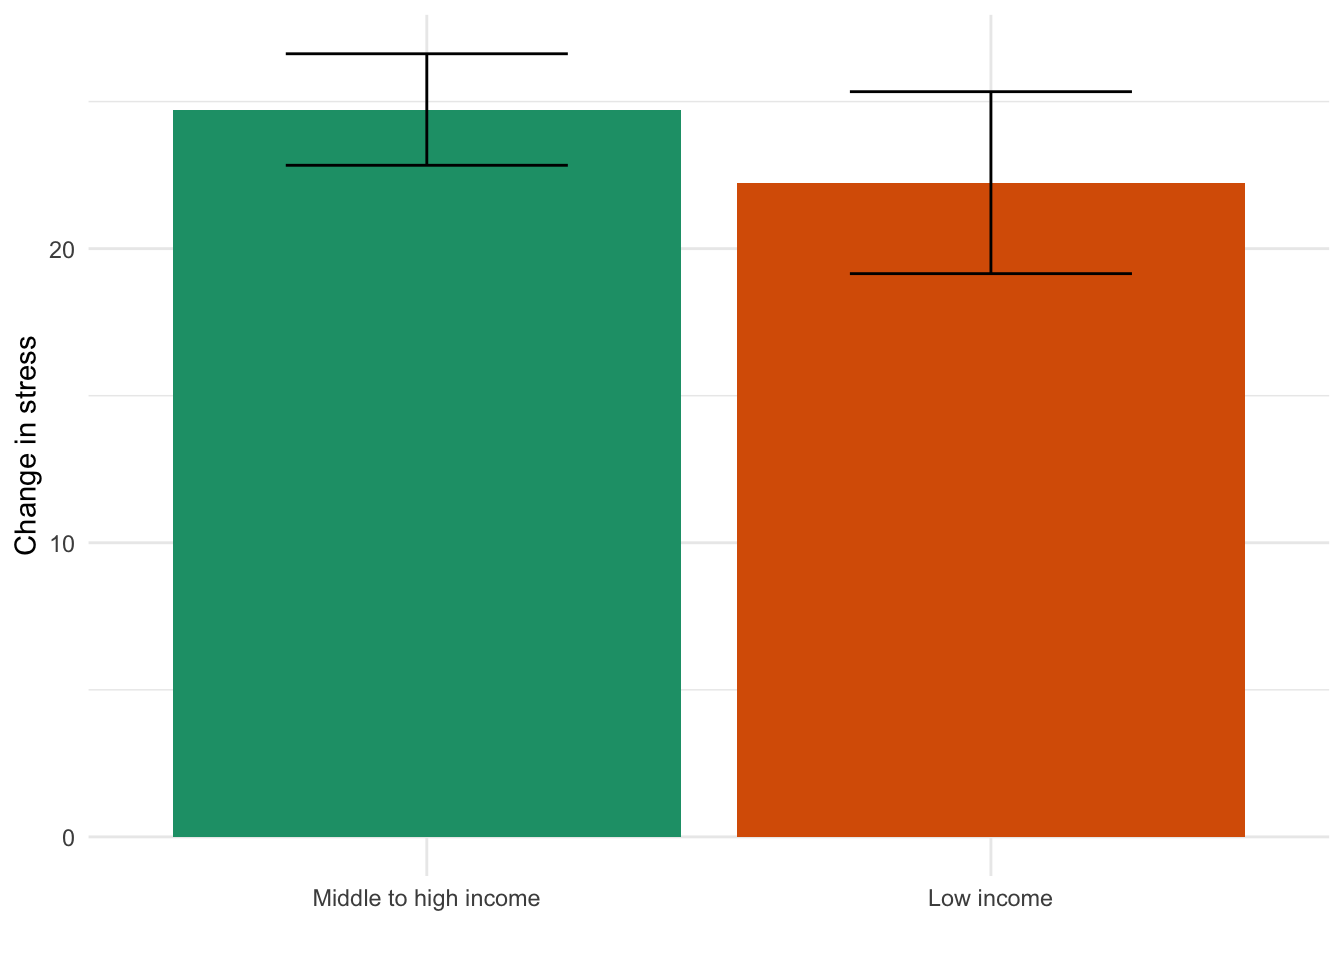
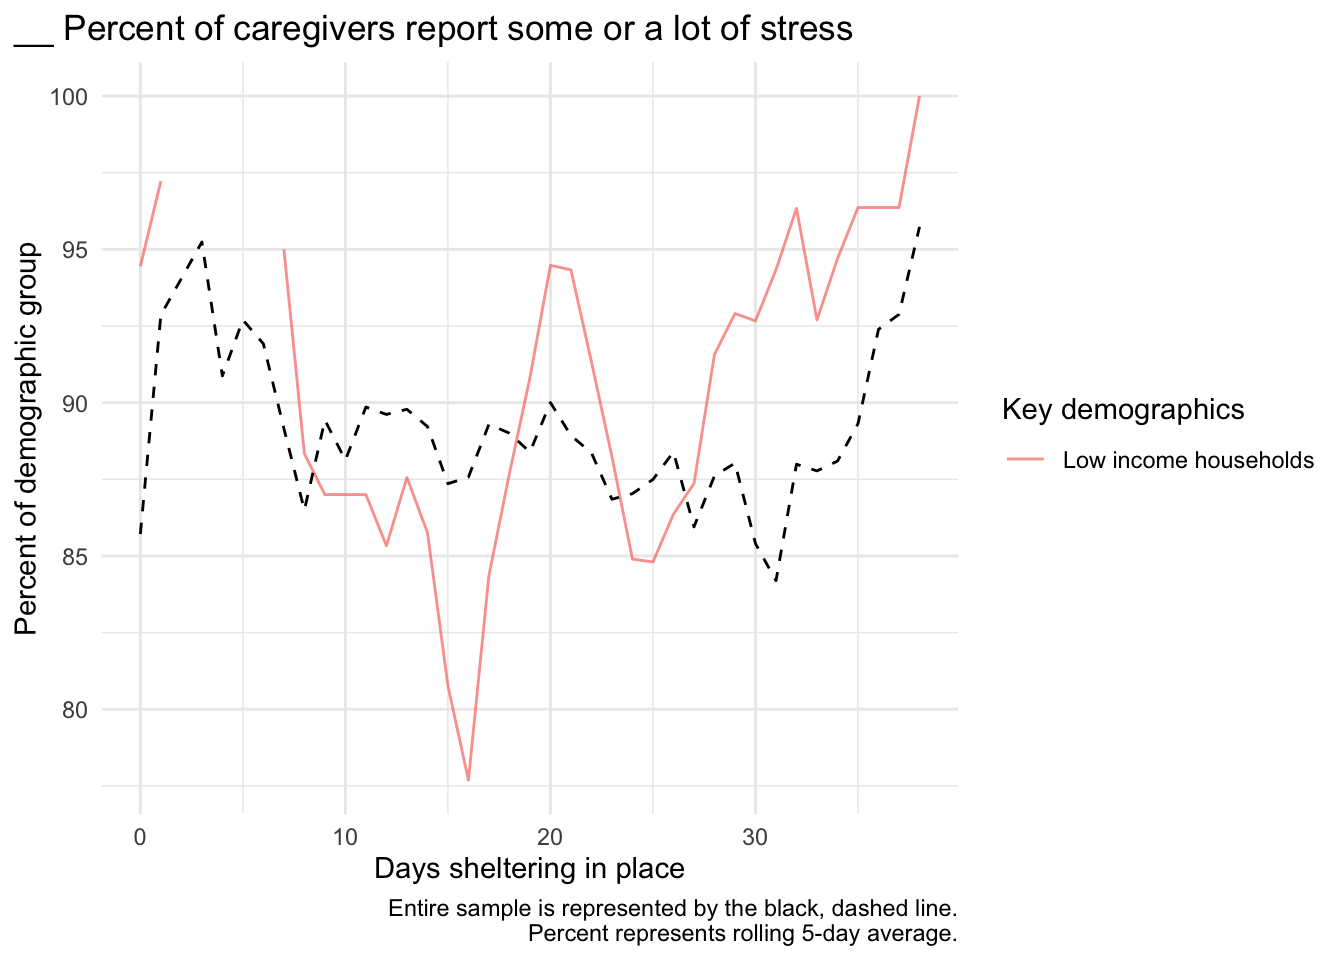
Caregiver stress
Plots
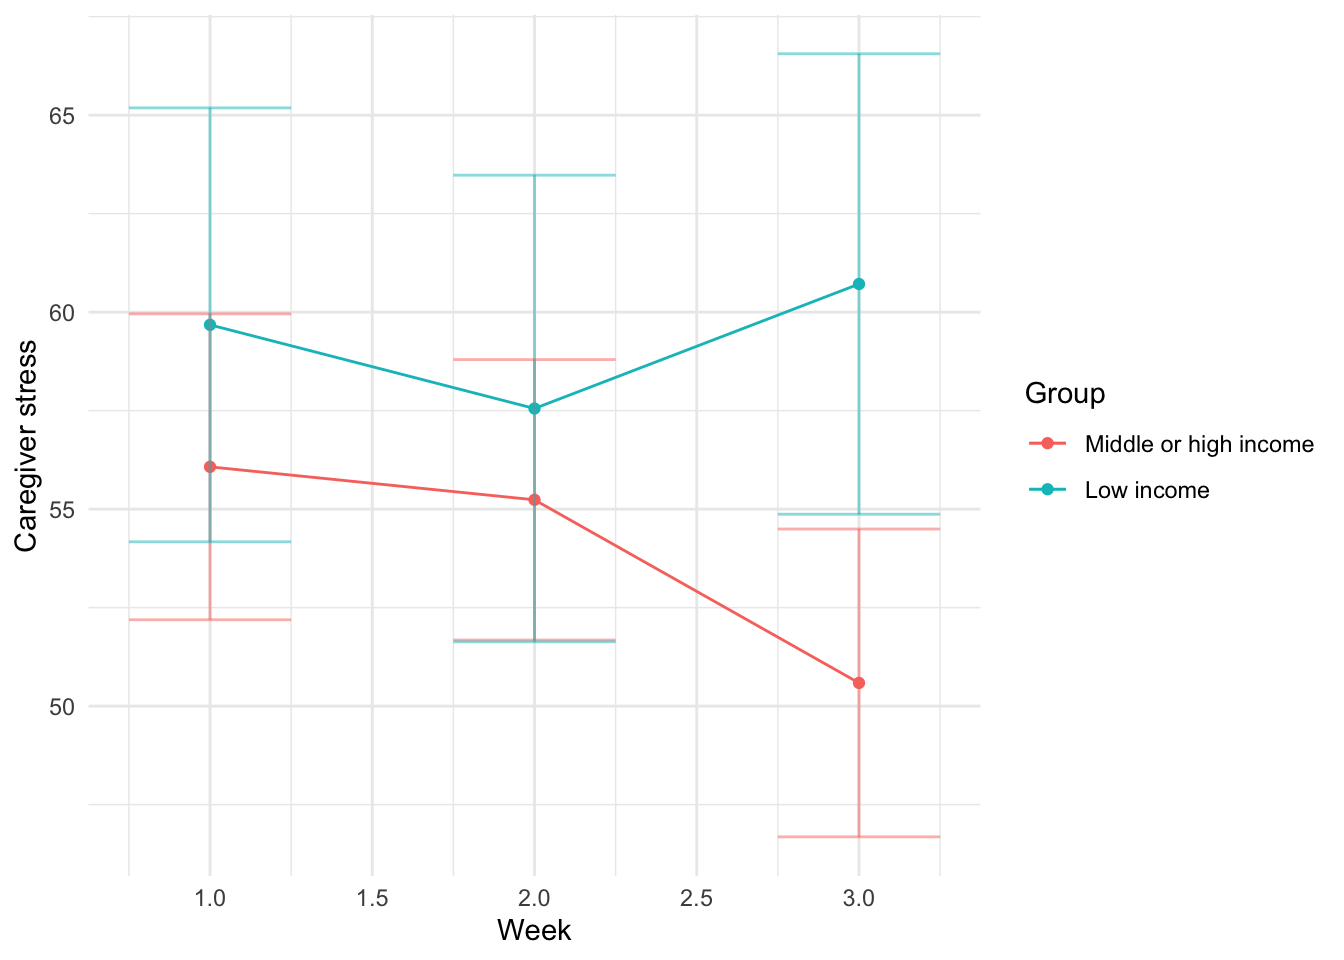
Test of slope
Weeks 1+
Baseline model
| Term | Coef | SE | t | p |
|---|---|---|---|---|
| Fixed effects | ||||
| (Intercept) | 59.42 | 2.98 | 19.92 | 0.000 |
| Week | -2.71 | 1.41 | -1.93 | 0.054 |
| poverty | -0.84 | 5.13 | -0.16 | 0.870 |
| Week:poverty | 3.04 | 2.48 | 1.23 | 0.220 |
| Random effects | ||||
| sd__(Intercept) | 28.30 | |||
| sd__Observation | 16.17 | |||
Can we explain the effect?
| Mediator | Coefficient (Income) | Coefficient of mediator |
|---|---|---|
| access_online | -2.42 | 2.83 |
| black | 1.00 | 2.94 |
| child_insurance | -0.54 | 3.20 |
| decrease_nonfamilyCC | 4.43 | 3.57 |
| difficulty_basics | 0.11 | 3.35 |
| employment_decreased | -2.53 | 5.47* |
| free_food | 7.41* | -0.43 |
| income_decreaed | -1.32 | 3.98 |
| insurance | -2.17 | 2.99 |
| latinx | -2.50 | 3.40 |
| losejob_sickleave | -7.80* | 4.97 |
| lost_free_lunch | -1.08 | 3.06 |
| minority | 1.01 | 2.90 |
| support_decrease | -0.20 | 2.97 |
Week 0 to first response
Baseline model
| Term | Coef | SE | t | p |
|---|---|---|---|---|
| (Intercept) | 24.73 | 1.01 | 24.53 | 0.000 |
| poverty | -2.49 | 1.77 | -1.40 | 0.161 |
Can we explain the effect?
| Mediator | Coefficient (Income) | Coefficient of mediator |
|---|---|---|
| access_online | 3.48 | -2.12 |
| black | -3.75 | -2.22 |
| child_insurance | 4.91 | -2.19 |
| decrease_nonfamilyCC | 4.59* | -1.73 |
| difficulty_basics | 5.19* | -3.74* |
| employment_decreased | 6.14* | -4.77* |
| free_food | -2.56 | -1.54 |
| income_decreaed | 7.25* | -3.76* |
| insurance | 6.28* | -1.75 |
| latinx | 2.25 | -2.81 |
| losejob_sickleave | 4.86* | -4.03 |
| lost_free_lunch | 7.56* | -3.07 |
| minority | 0.66 | -2.45 |
| support_decrease | 18.55* | -1.78 |
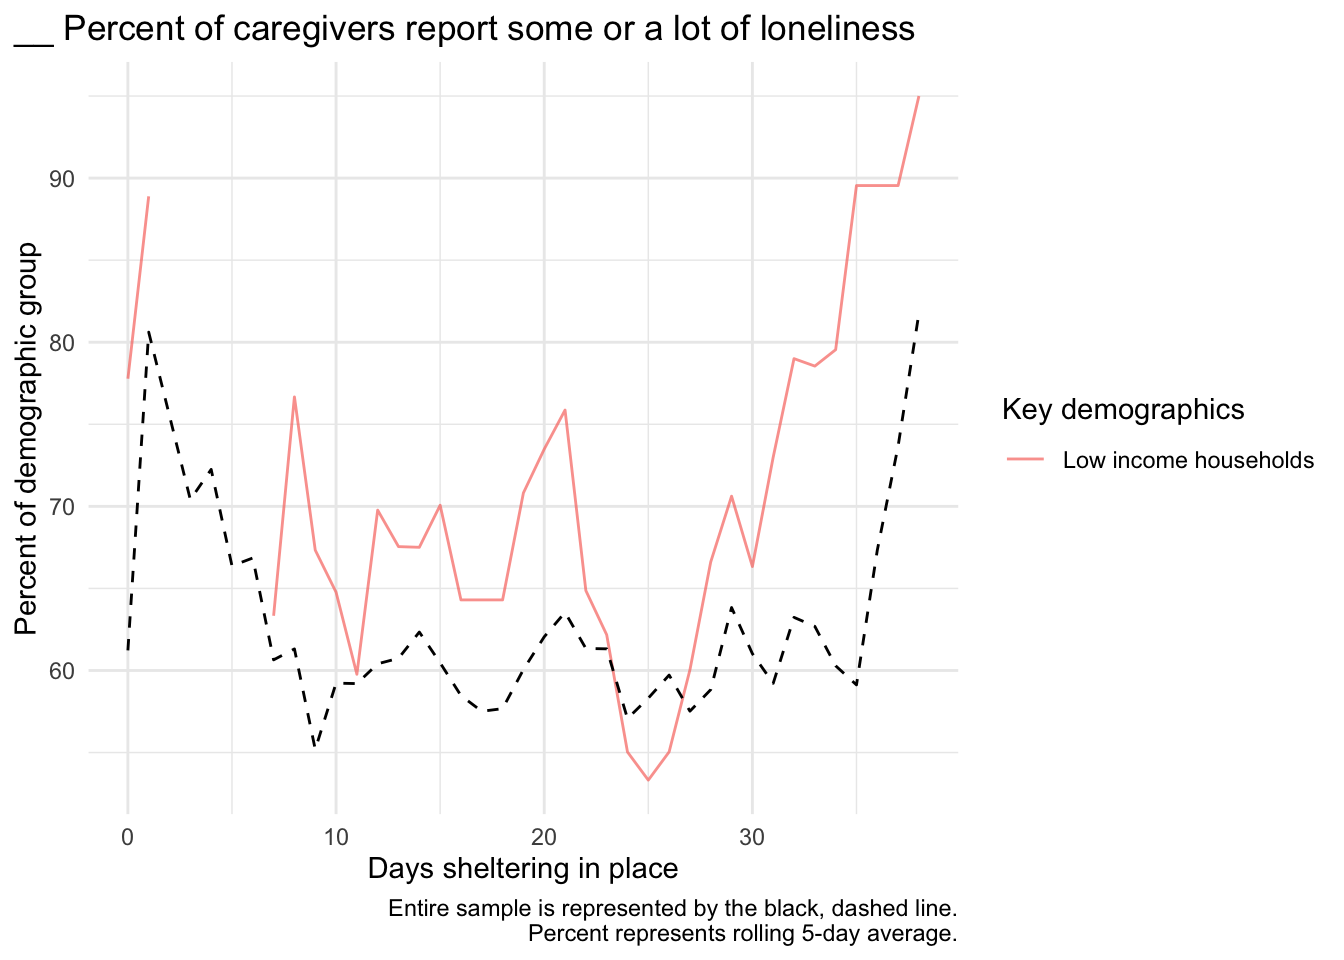
Caregiver loneliness
Plots
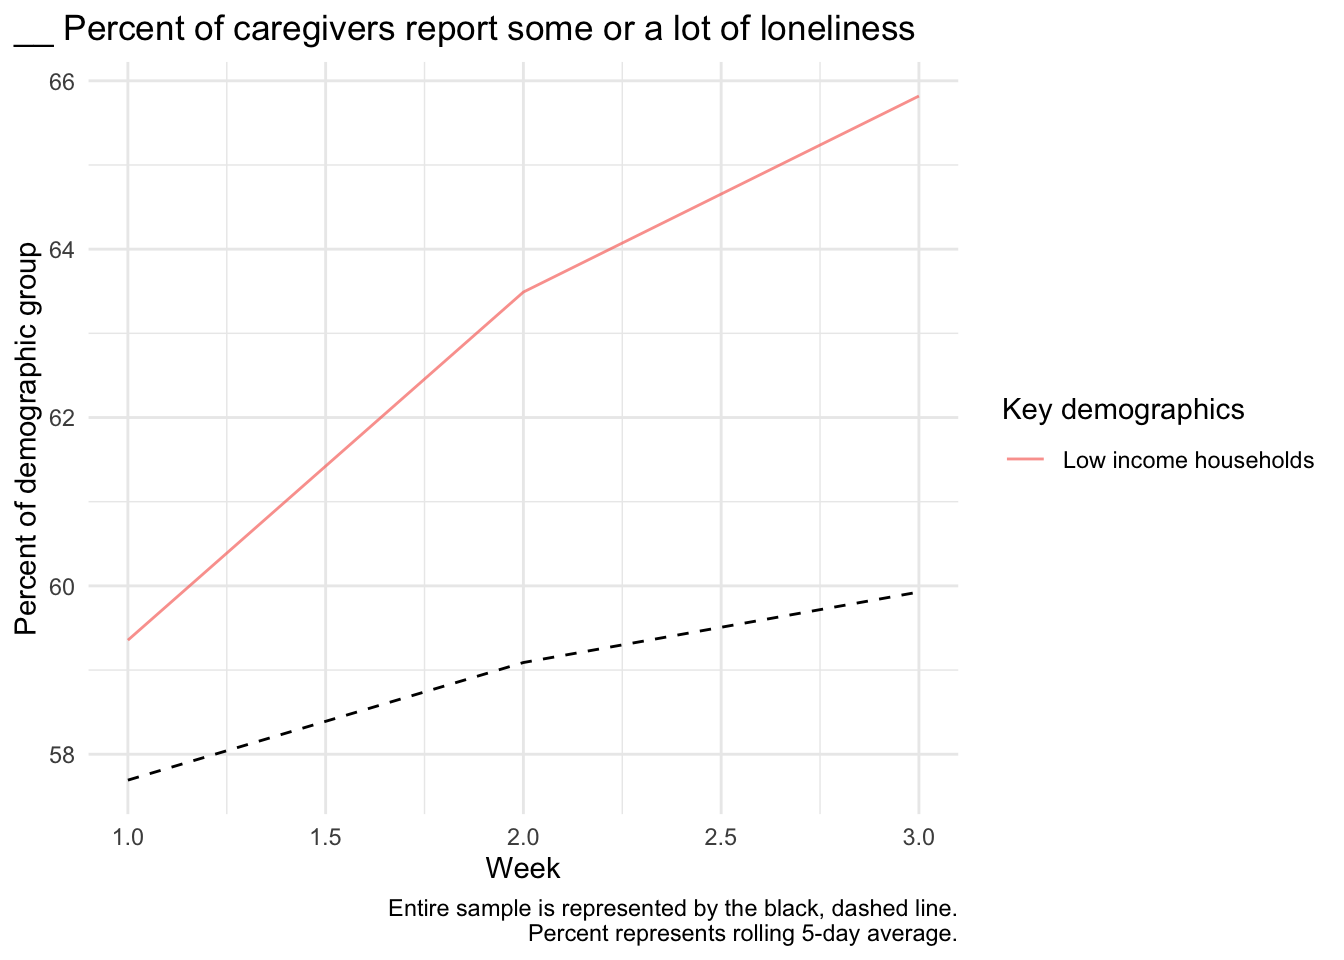
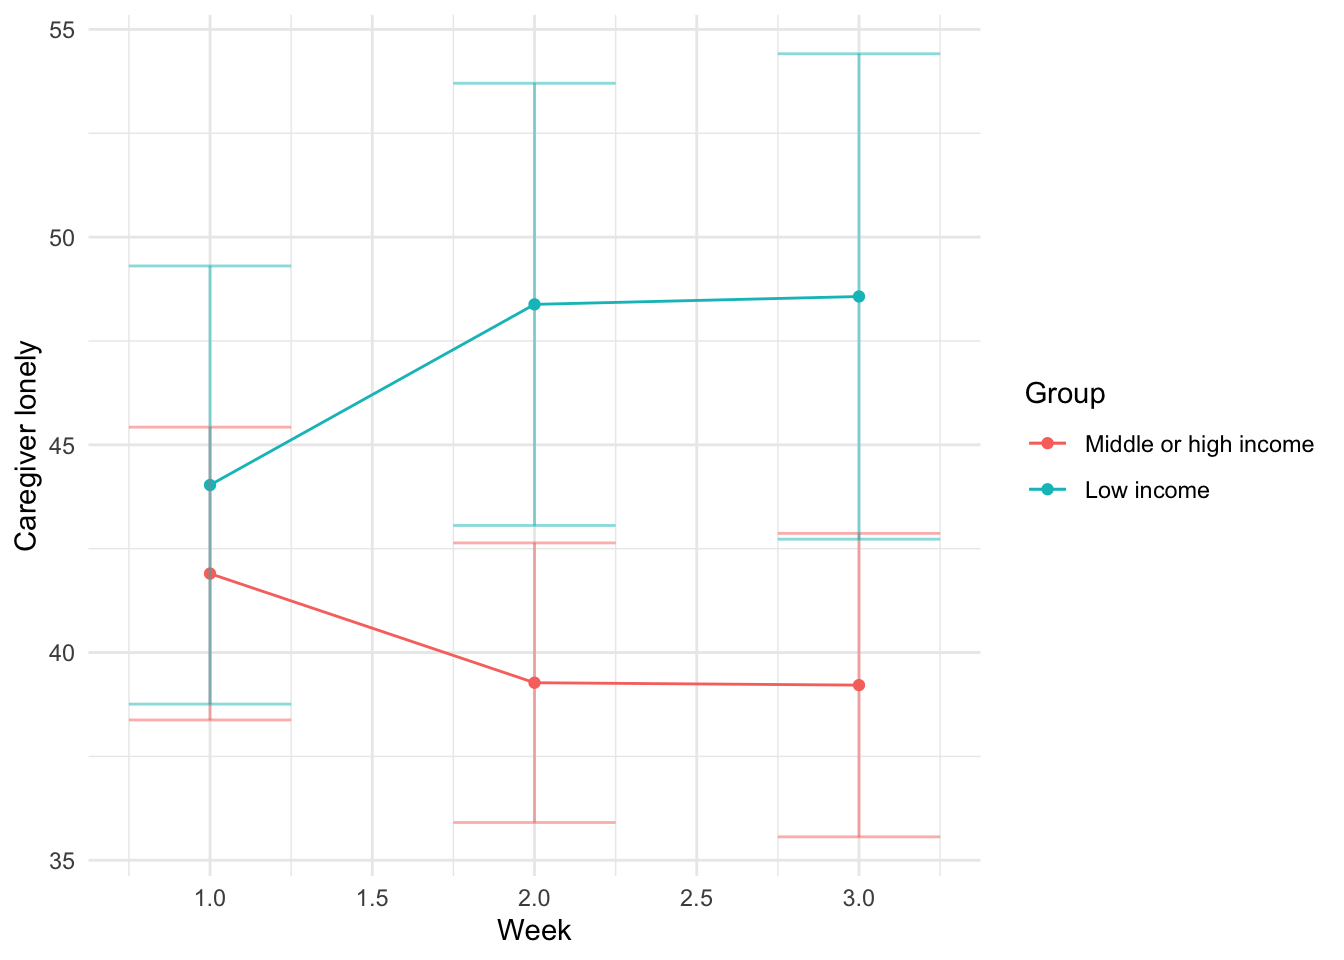
Test of slope
Weeks 1+
Baseline model
| Term | Coef | SE | t | p |
|---|---|---|---|---|
| Fixed effects | ||||
| (Intercept) | 42.84 | 2.79 | 15.37 | 0.000 |
| Week | -1.37 | 1.31 | -1.04 | 0.298 |
| poverty | -0.62 | 4.79 | -0.13 | 0.897 |
| Week:poverty | 3.78 | 2.32 | 1.63 | 0.103 |
| Random effects | ||||
| sd__(Intercept) | 26.44 | |||
| sd__Observation | 15.11 | |||
Can we explain the effect?
| Mediator | Coefficient (Income) | Coefficient of mediator |
|---|---|---|
| access_online | -4.53 | 3.33 |
| black | -6.52 | 4.23 |
| child_insurance | 2.14 | 4.06 |
| decrease_nonfamilyCC | 1.34 | 3.94 |
| difficulty_basics | -0.30 | 4.10 |
| employment_decreased | 1.83 | 5.48* |
| free_food | 3.12 | 2.26 |
| income_decreaed | -0.83 | 4.62* |
| insurance | 4.10 | 4.34 |
| latinx | 3.20 | 3.90 |
| losejob_sickleave | -0.72 | 4.97 |
| lost_free_lunch | 2.01 | 3.60 |
| minority | -2.76 | 4.13 |
| support_decrease | -1.03 | 3.91 |
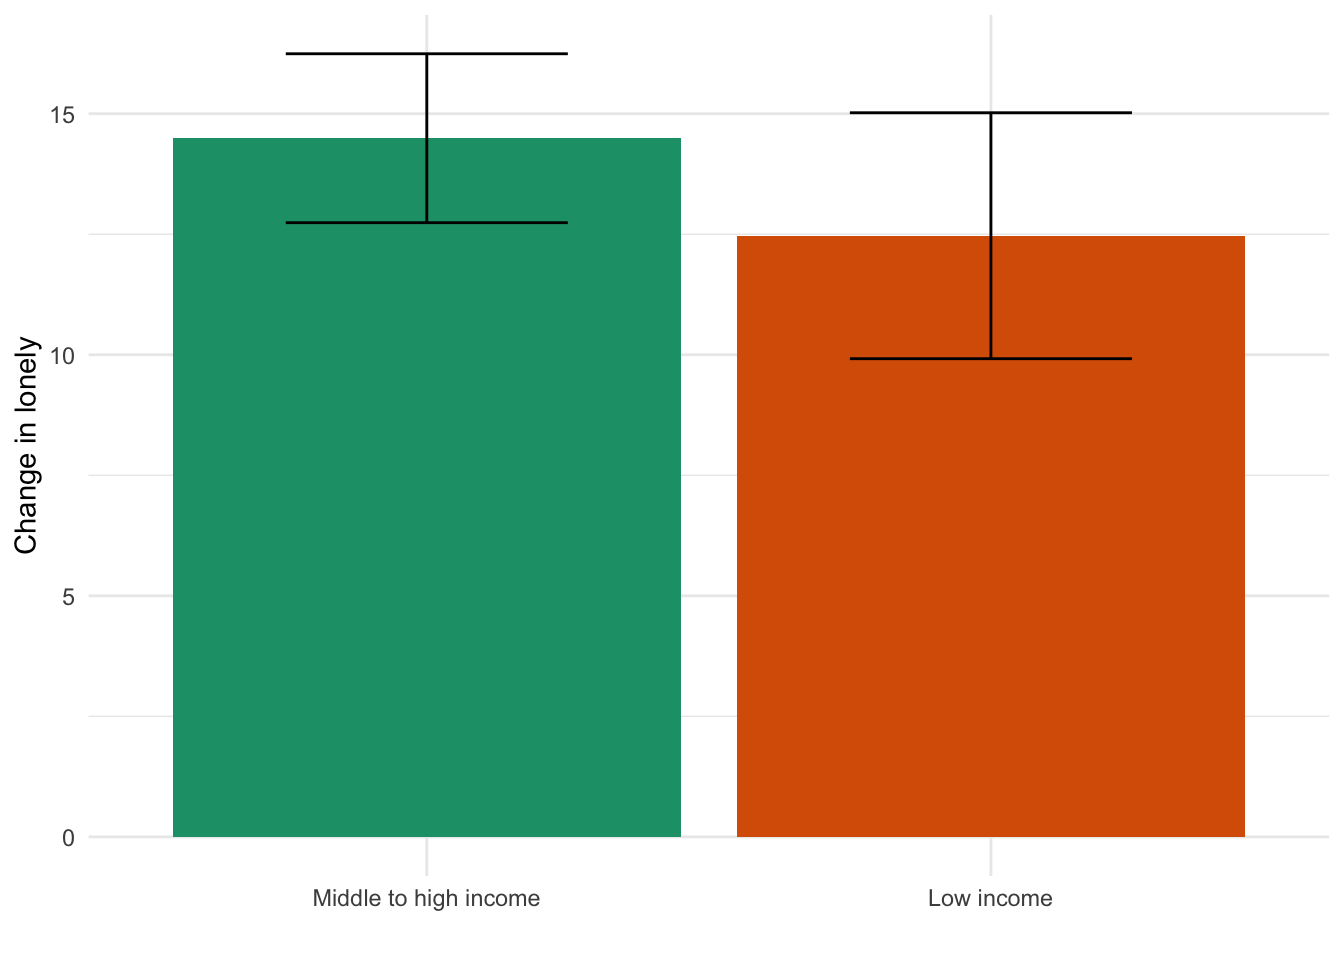
Week 0 to first response
Baseline model
| Term | Coef | SE | t | p |
|---|---|---|---|---|
| (Intercept) | 14.49 | 0.89 | 16.21 | 0.000 |
| poverty | -2.02 | 1.57 | -1.29 | 0.199 |
Can we explain the effect?
| Mediator | Coefficient (Income) | Coefficient of mediator |
|---|---|---|
| access_online | 2.74 | -1.74 |
| black | 1.75 | -2.04 |
| child_insurance | -1.89 | -2.12 |
| decrease_nonfamilyCC | 1.13 | -1.84 |
| difficulty_basics | -0.60 | -1.88 |
| employment_decreased | 4.48* | -3.27 |
| free_food | -3.36 | -0.78 |
| income_decreaed | 5.09* | -3.03 |
| insurance | 1.62 | -1.82 |
| latinx | -3.79 | -1.50 |
| losejob_sickleave | 1.35 | -2.71 |
| lost_free_lunch | 2.12 | -2.19 |
| minority | -1.40 | -1.85 |
| support_decrease | 18.23* | -1.28 |
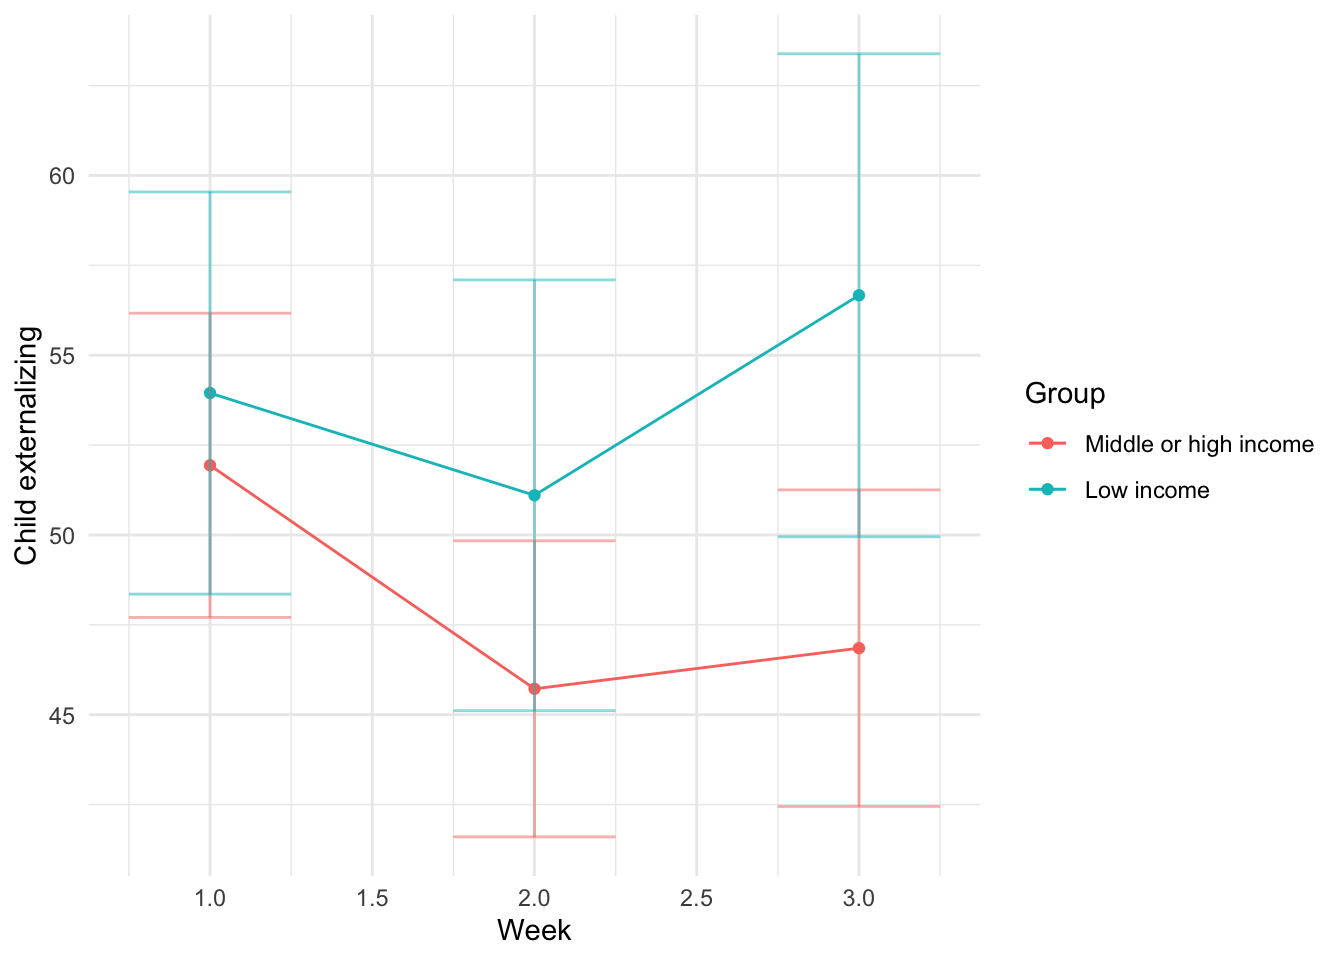
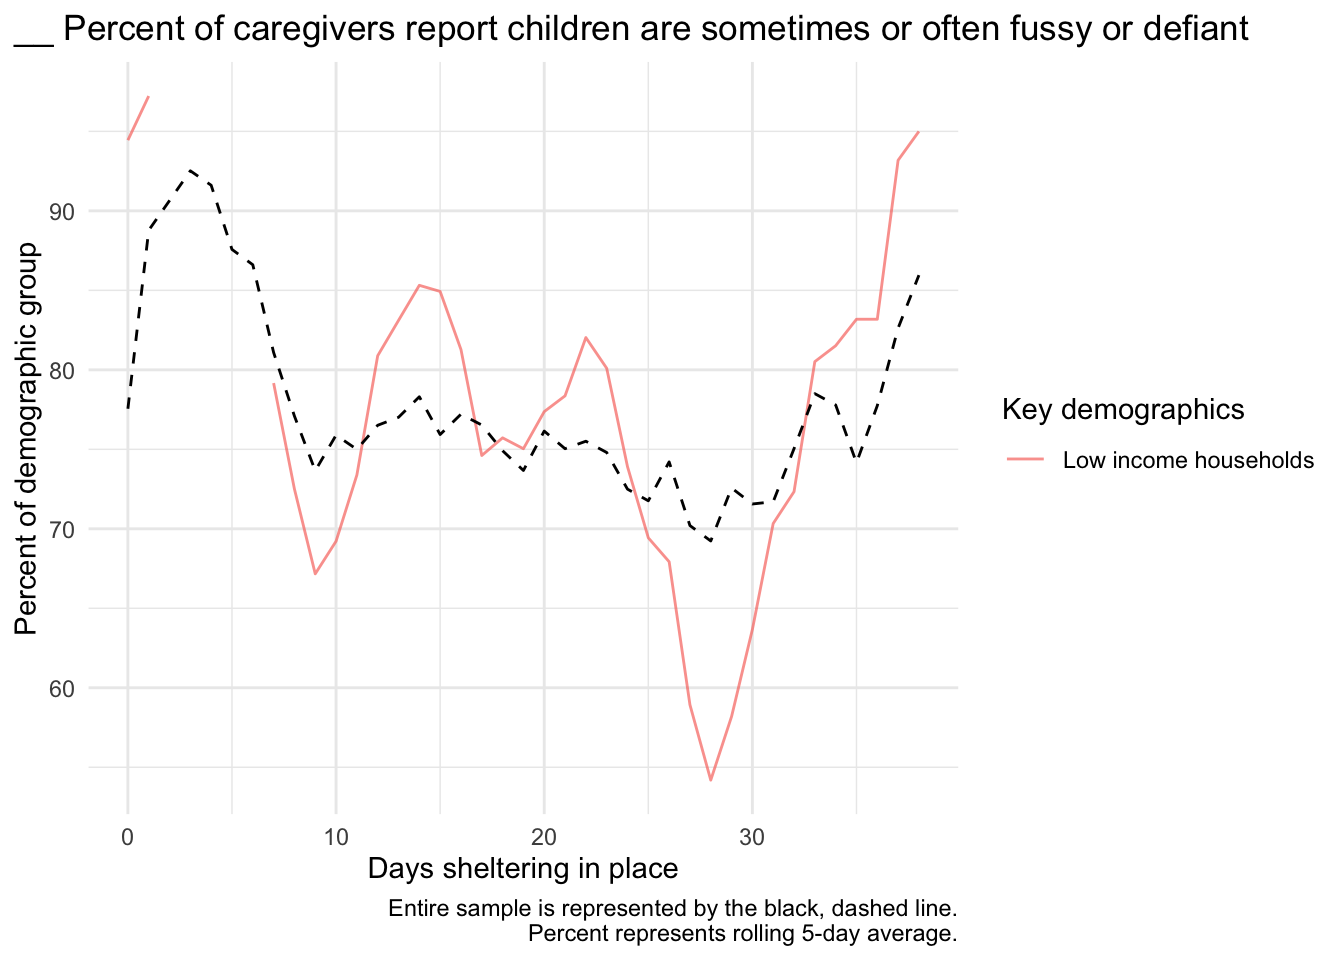
Child Externalizing
Plots
Test of slope
Weeks 1+
Baseline model
| Term | Coef | SE | t | p |
|---|---|---|---|---|
| Fixed effects | ||||
| (Intercept) | 53.33 | 3.28 | 16.27 | 0.000 |
| Week | -2.62 | 1.54 | -1.69 | 0.091 |
| poverty | -1.68 | 5.66 | -0.30 | 0.766 |
| Week:poverty | 3.70 | 2.73 | 1.35 | 0.176 |
| Random effects | ||||
| sd__(Intercept) | 31.06 | |||
| sd__Observation | 17.75 | |||
Can we explain the effect?
| Mediator | Coefficient (Income) | Coefficient of mediator |
|---|---|---|
| access_online | -2.06 | 3.57 |
| black | -2.90 | 3.92 |
| child_insurance | -5.24 | 3.70 |
| decrease_nonfamilyCC | -1.01 | 2.93 |
| difficulty_basics | 7.43* | 2.08 |
| employment_decreased | 3.76 | 4.30 |
| free_food | 5.82 | 0.80 |
| income_decreaed | -2.34 | 4.87 |
| insurance | 1.67 | 4.38 |
| latinx | 1.02 | 3.90 |
| losejob_sickleave | -2.58 | 3.84 |
| lost_free_lunch | -0.02 | 3.64 |
| minority | 0.34 | 3.69 |
| support_decrease | 0.98 | 4.37 |
Week 0 to first response
Baseline model
| Term | Coef | SE | t | p |
|---|---|---|---|---|
| (Intercept) | 16.33 | 1.03 | 15.84 | 0.000 |
| poverty | 0.51 | 1.82 | 0.28 | 0.779 |
Can we explain the effect?
| Mediator | Coefficient (Income) | Coefficient of mediator |
|---|---|---|
| access_online | 3.79 | 0.90 |
| black | -6.60* | 0.90 |
| child_insurance | 5.14 | 0.81 |
| decrease_nonfamilyCC | 5.32* | 1.37 |
| difficulty_basics | 2.96 | -0.18 |
| employment_decreased | 6.67* | -1.93 |
| free_food | 3.60 | -0.80 |
| income_decreaed | 7.98* | -0.92 |
| insurance | 5.33 | 1.16 |
| latinx | 7.06* | 0.17 |
| losejob_sickleave | 4.04 | -0.65 |
| lost_free_lunch | 10.88* | -0.34 |
| minority | -0.49 | 0.61 |
| support_decrease | 13.41* | 1.22 |
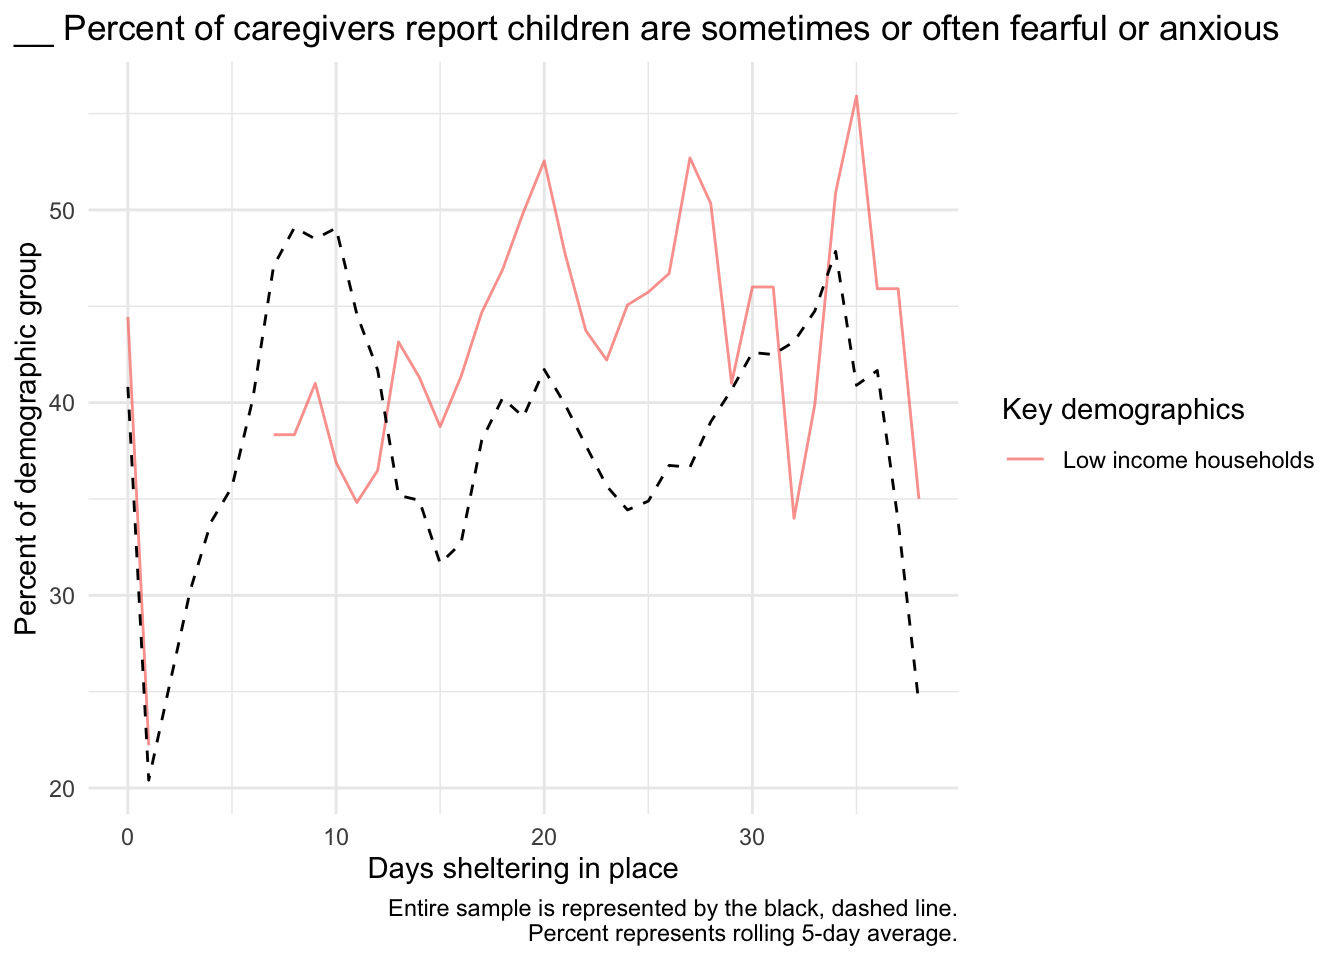
Child Internalizing
Plots

Test of slope
Weeks 1+
Baseline model
| Term | Coef | SE | t | p |
|---|---|---|---|---|
| Fixed effects | ||||
| (Intercept) | 24.15 | 2.99 | 8.08 | 0.000 |
| Week | -0.79 | 1.41 | -0.56 | 0.576 |
| poverty | 1.47 | 5.19 | 0.28 | 0.776 |
| Week:poverty | 2.30 | 2.50 | 0.92 | 0.359 |
| Random effects | ||||
| sd__(Intercept) | 28.28 | |||
| sd__Observation | 16.16 | |||
Can we explain the effect?
| Mediator | Coefficient (Income) | Coefficient of mediator |
|---|---|---|
| access_online | 1.77 | 2.56 |
| black | -2.89 | 2.49 |
| child_insurance | -2.66 | 1.93 |
| decrease_nonfamilyCC | 1.39 | 2.33 |
| difficulty_basics | 7.40* | 0.73 |
| employment_decreased | 1.70 | 3.91 |
| free_food | 1.47 | 1.33 |
| income_decreaed | -1.95 | 3.19 |
| insurance | 2.14 | 2.29 |
| latinx | 2.14 | 2.76 |
| losejob_sickleave | -2.96 | 1.01 |
| lost_free_lunch | 5.31 | 1.82 |
| minority | 2.54 | 2.11 |
| support_decrease | -1.50 | 2.66 |
Week 0 to first response
Baseline model
| Term | Coef | SE | t | p |
|---|---|---|---|---|
| (Intercept) | 9.83 | 0.99 | 9.93 | 0.00 |
| poverty | 1.41 | 1.75 | 0.81 | 0.42 |

Can we explain the effect?
| Mediator | Coefficient (Income) | Coefficient of mediator |
|---|---|---|
| access_online | 3.91 | 1.79 |
| black | -0.36 | 1.46 |
| child_insurance | 2.13 | 1.43 |
| decrease_nonfamilyCC | 3.79* | 2.03 |
| difficulty_basics | 4.51 | 0.35 |
| employment_decreased | 4.73* | -0.20 |
| free_food | 0.40 | 1.26 |
| income_decreaed | 5.69* | 0.36 |
| insurance | 1.85 | 1.60 |
| latinx | -3.44 | 1.95 |
| losejob_sickleave | 2.34 | -0.17 |
| lost_free_lunch | 5.94* | 0.93 |
| minority | -1.31 | 1.54 |
| support_decrease | 9.38* | 1.88 |
Analyses May 6
Well-being during shelter-in-place
Compared to general population
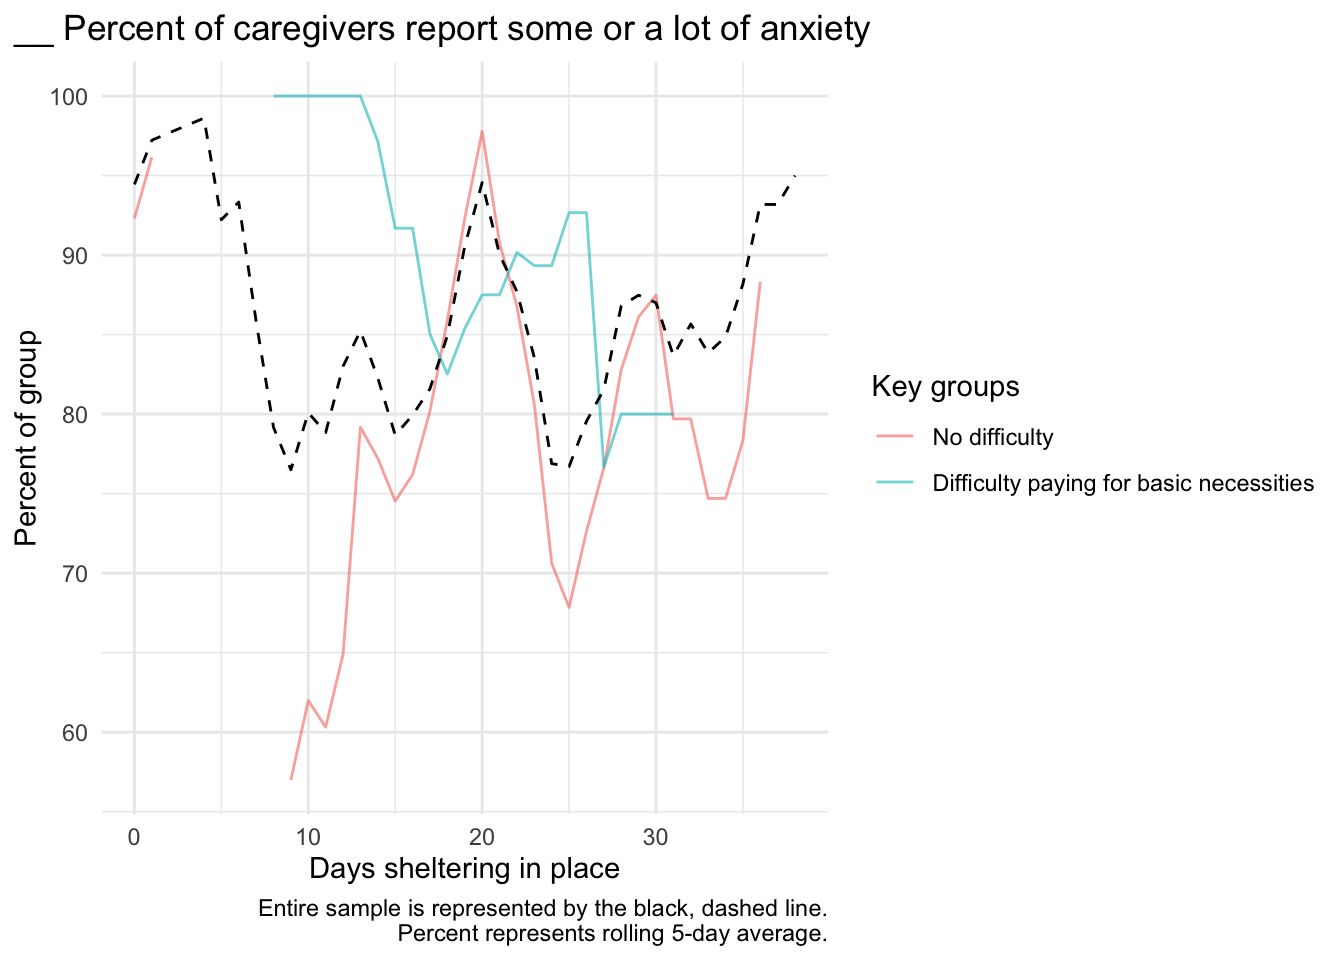
Caregiver anxiety
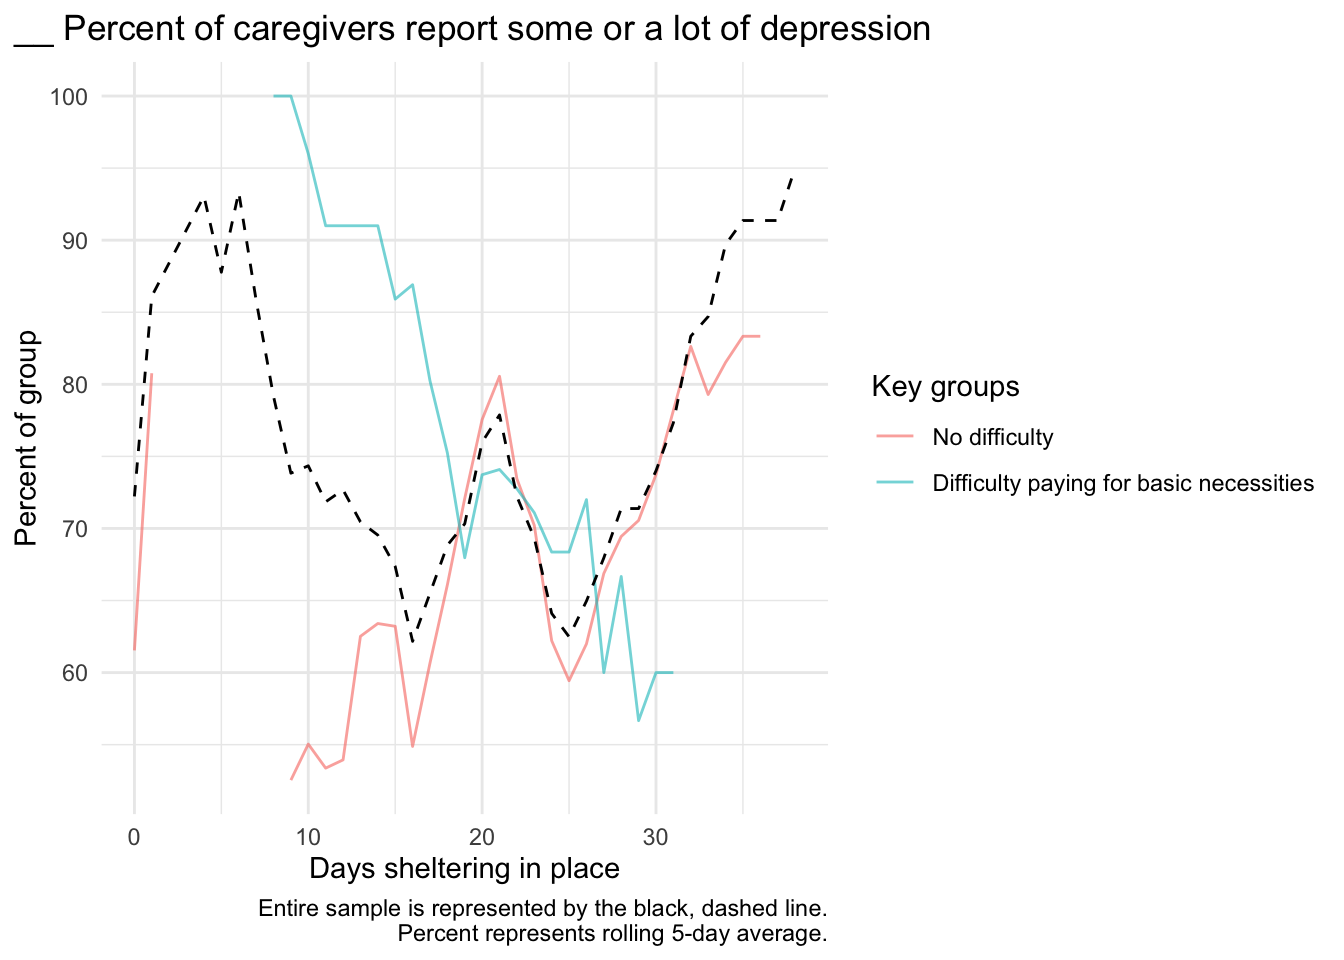
Caregiver depression
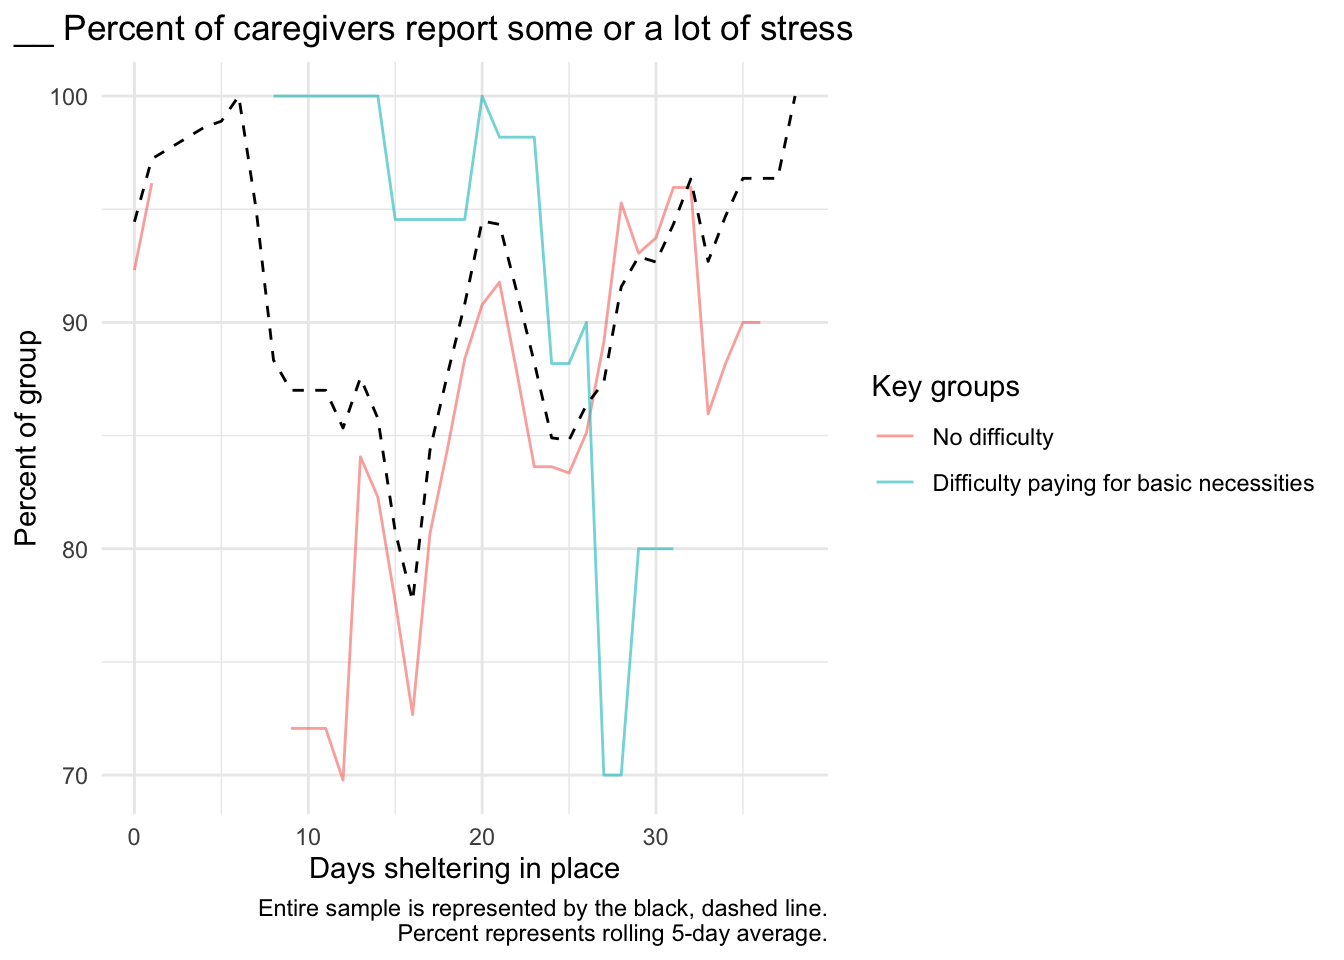
Caregiver stress
Caregiver loneliness
Child externalizing
Child internalizing
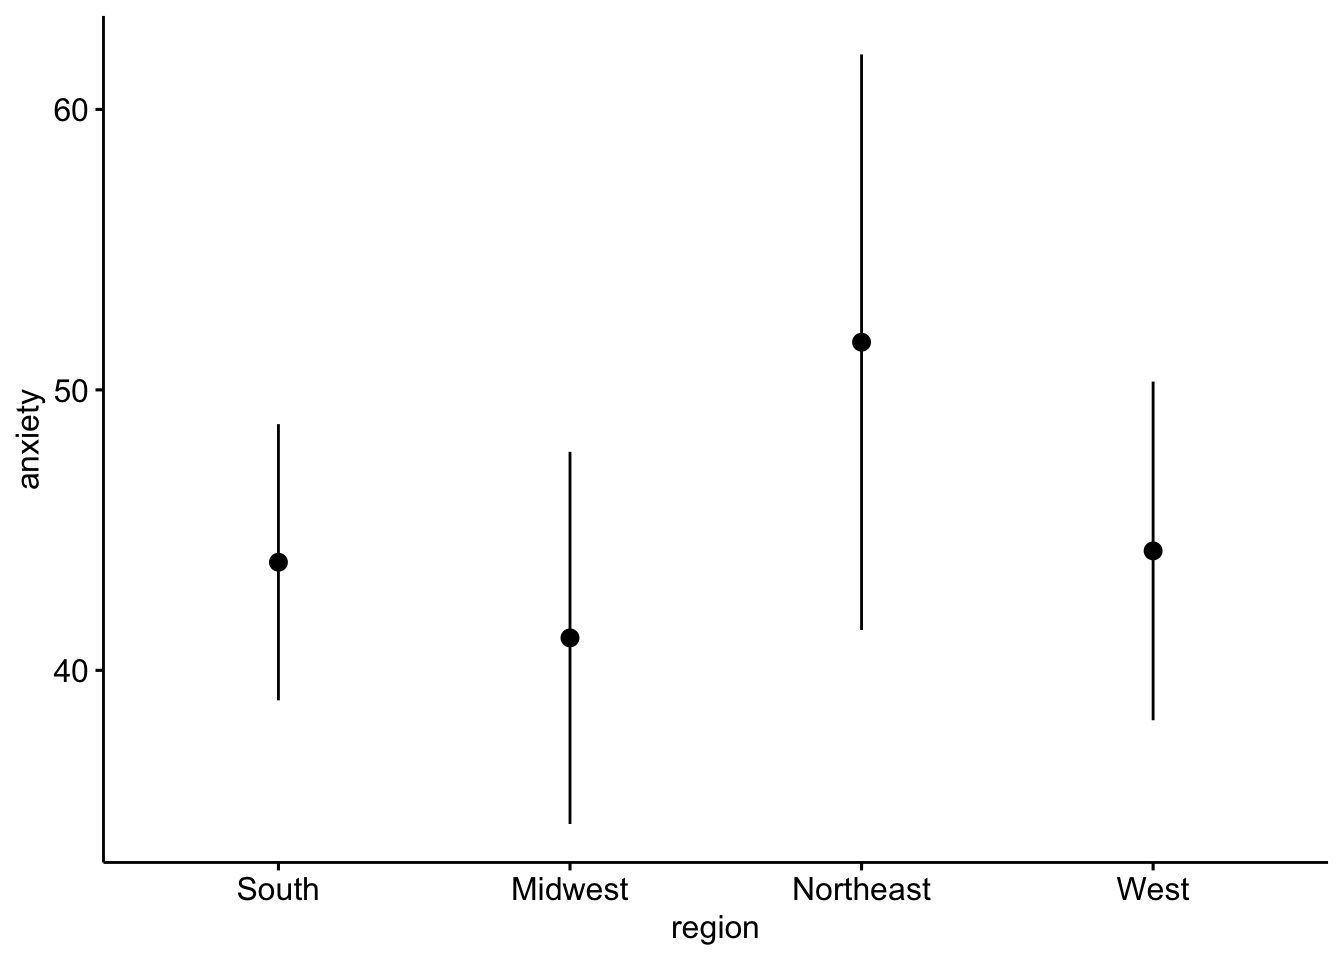
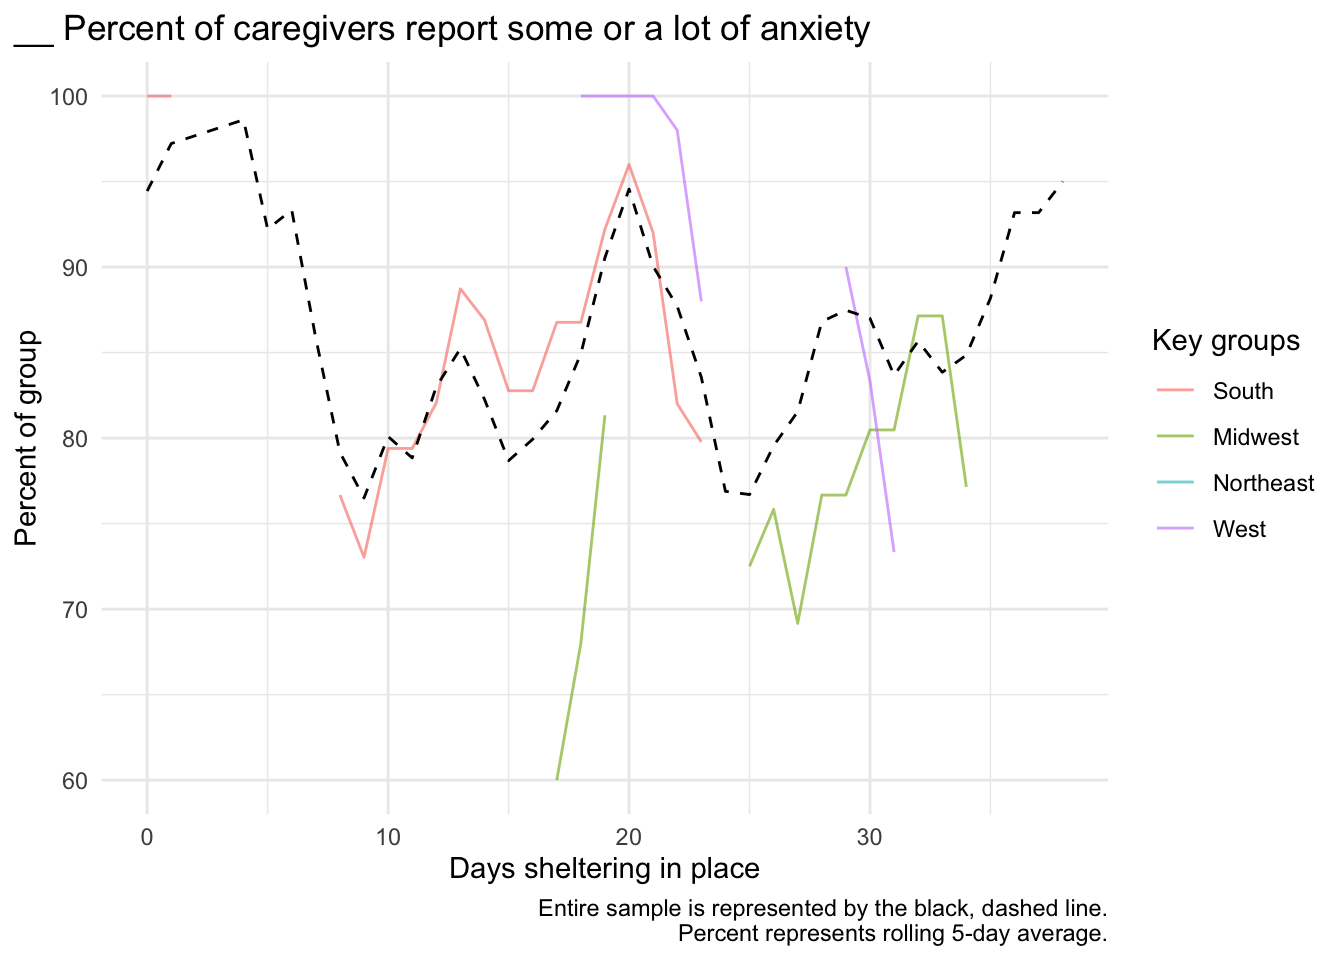
By geographic region
Caregiver anxiety
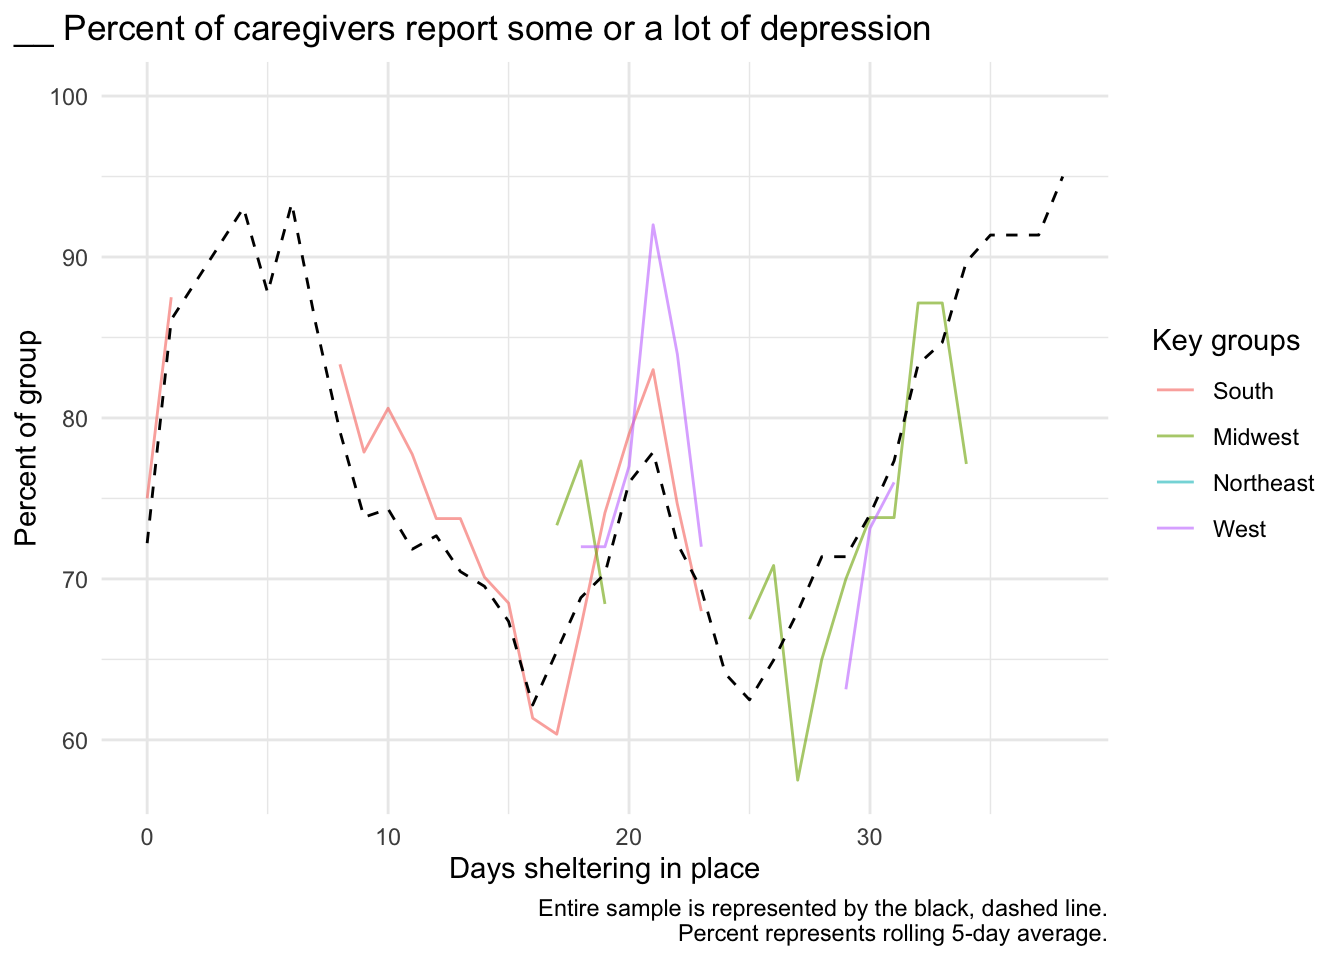
Caregiver depression
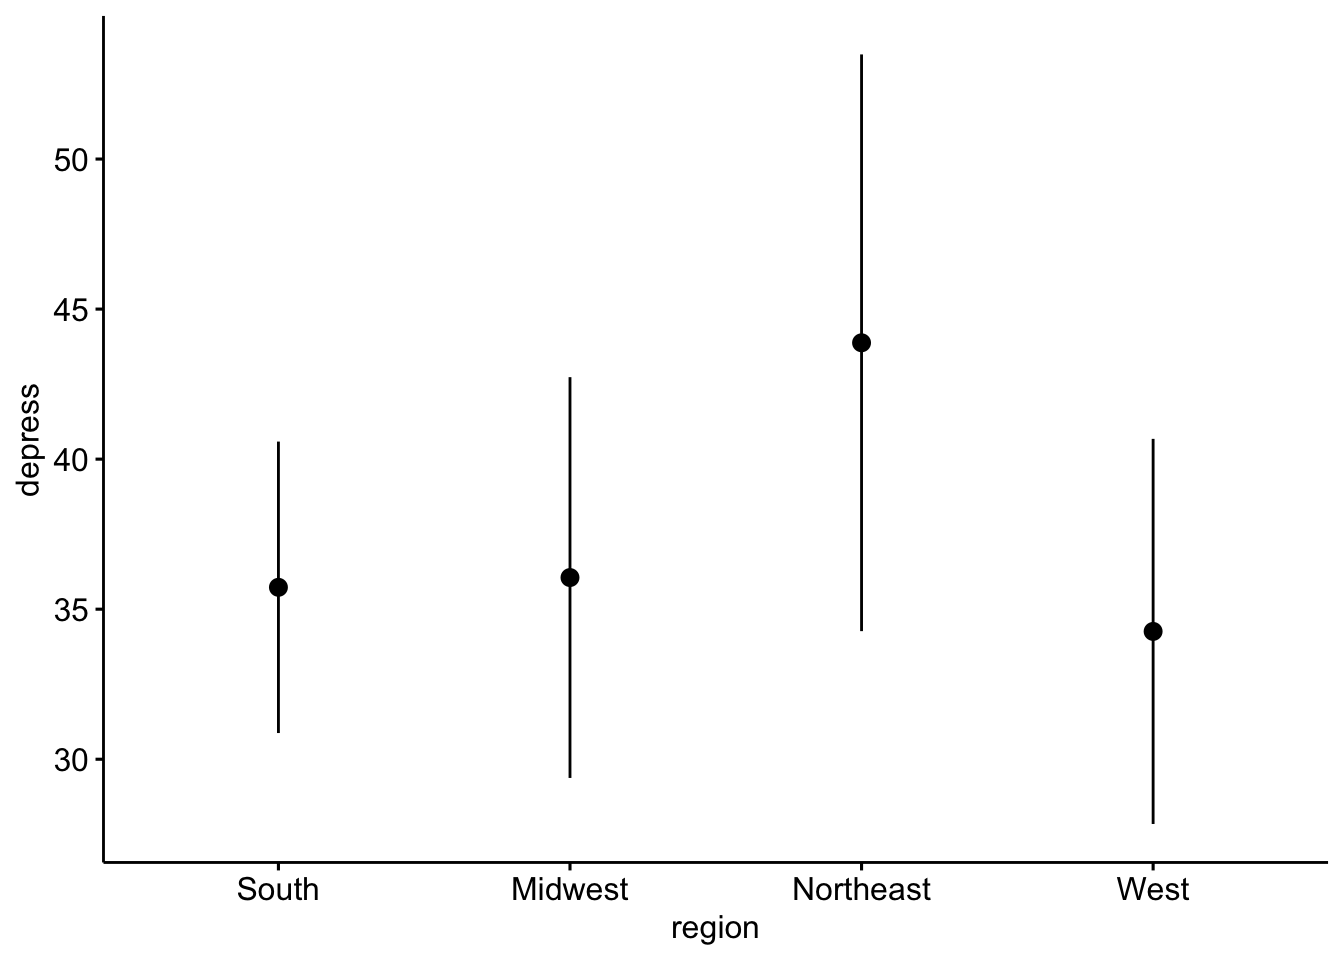
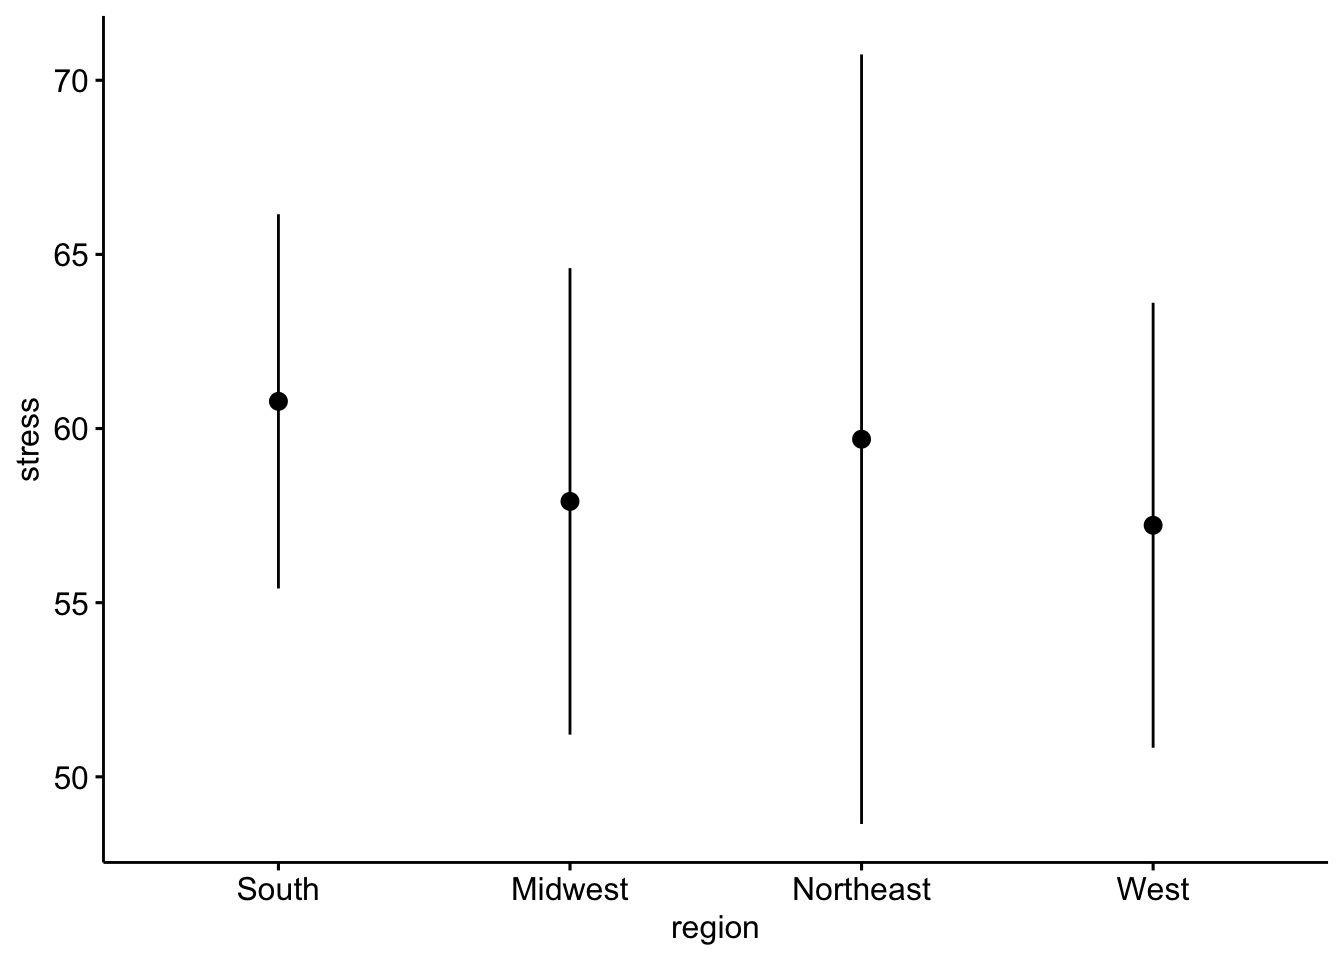
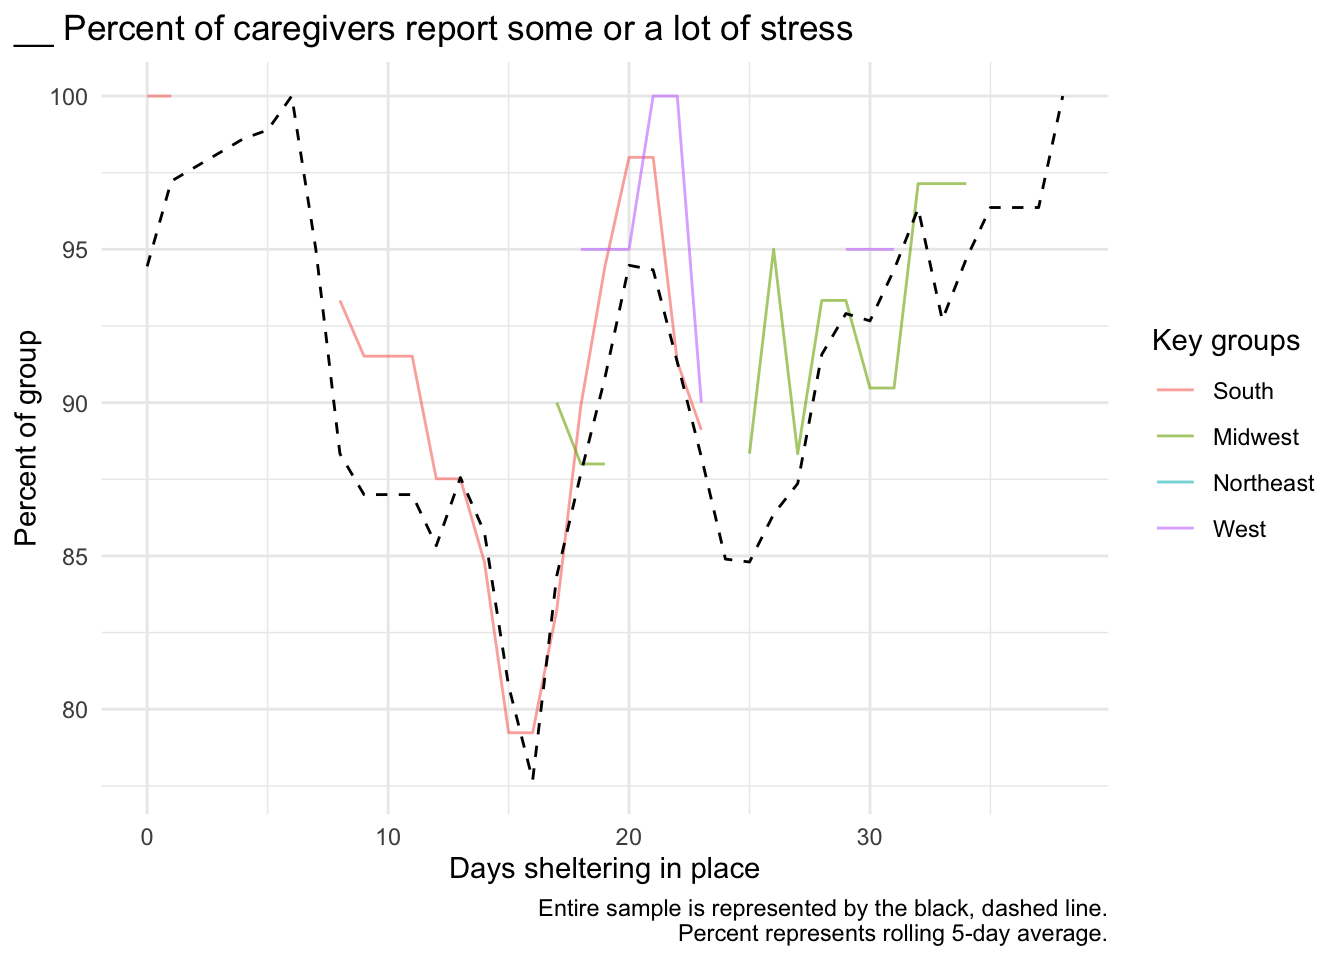
Caregiver stress
Child externalizing
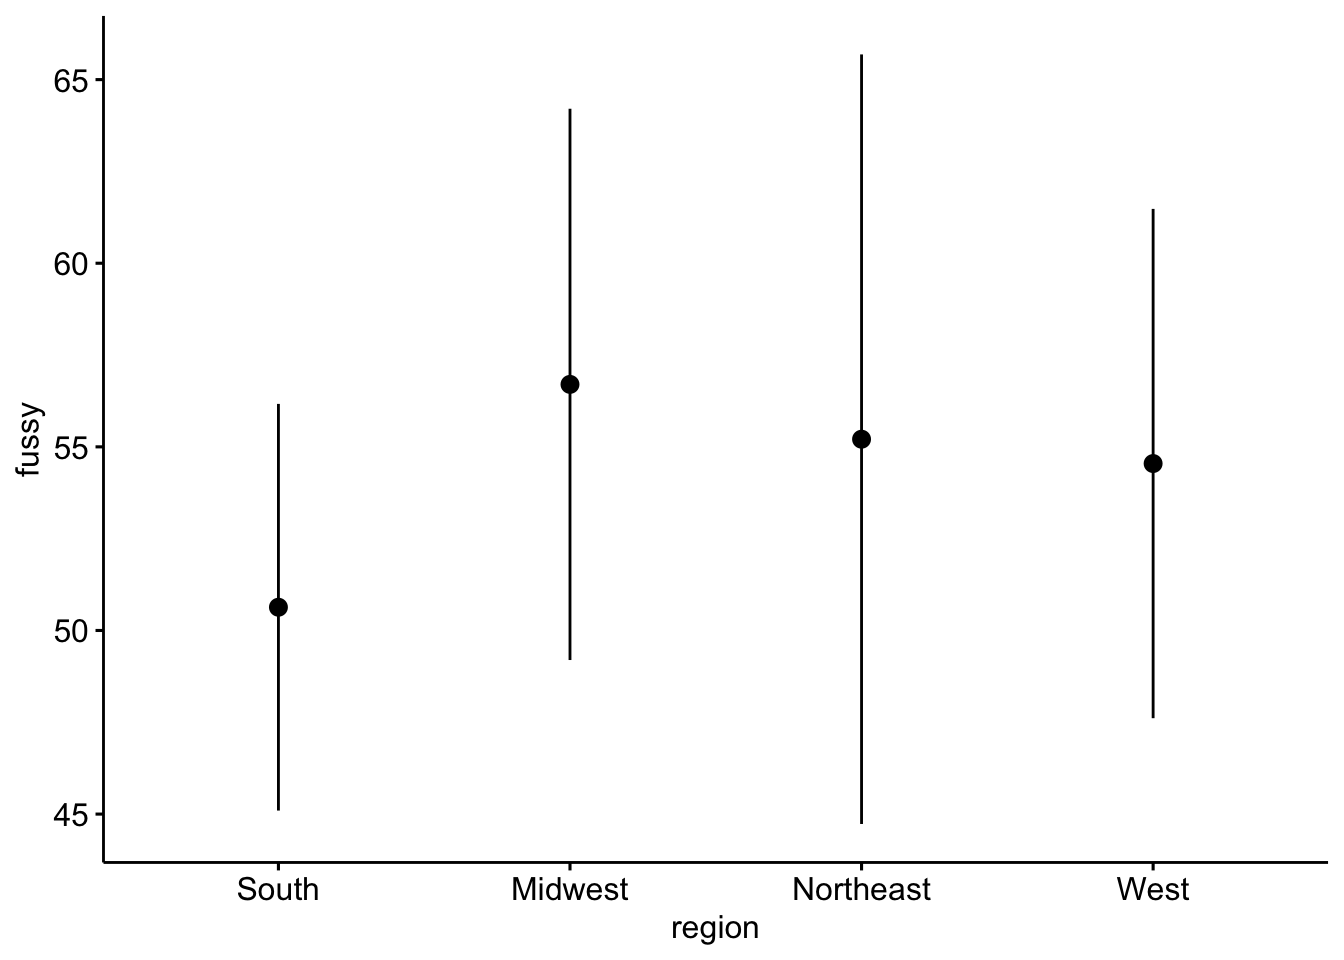
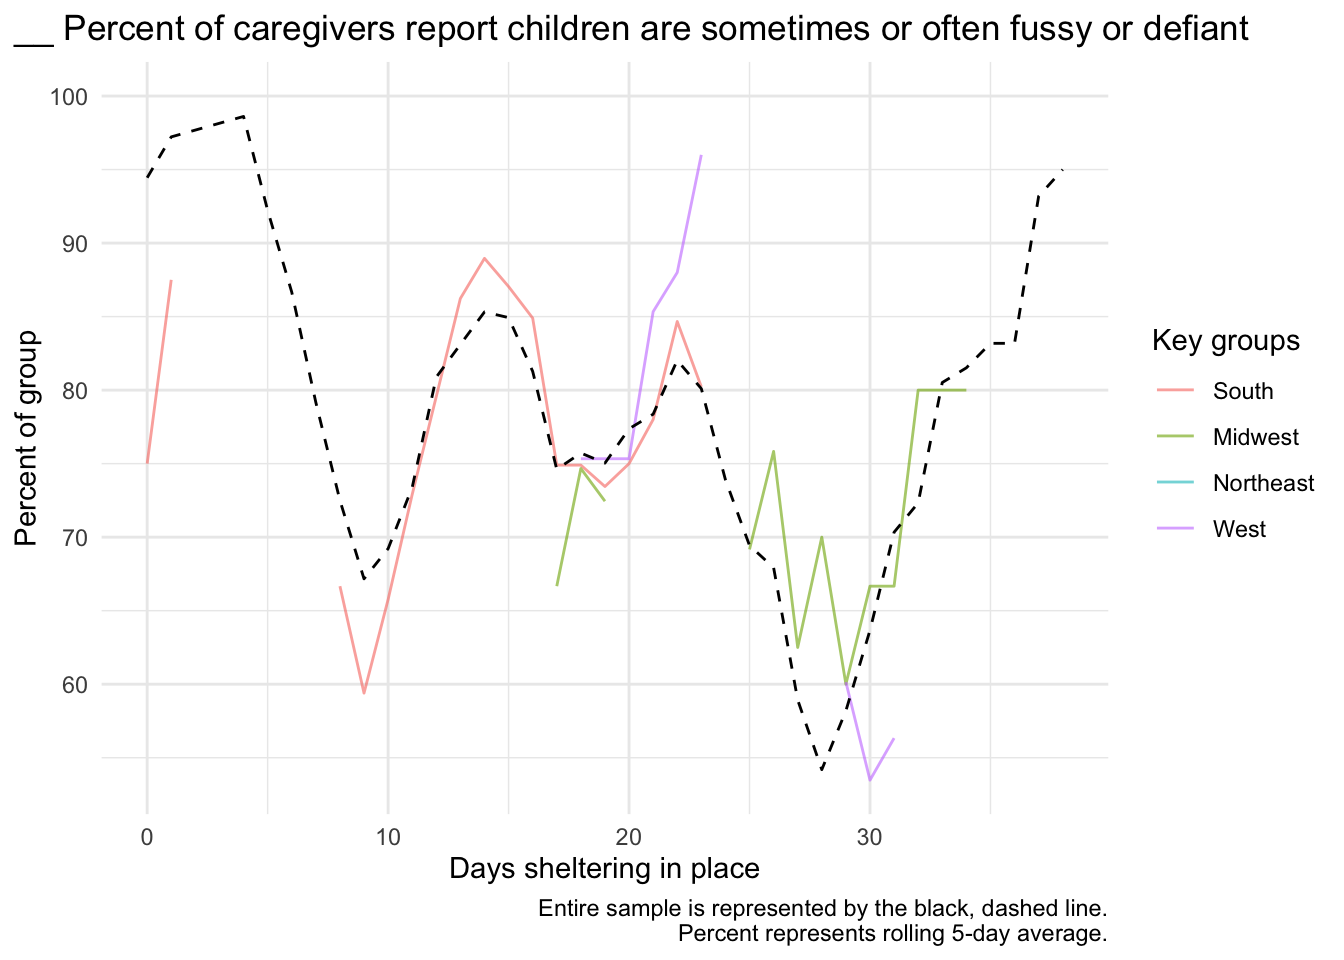
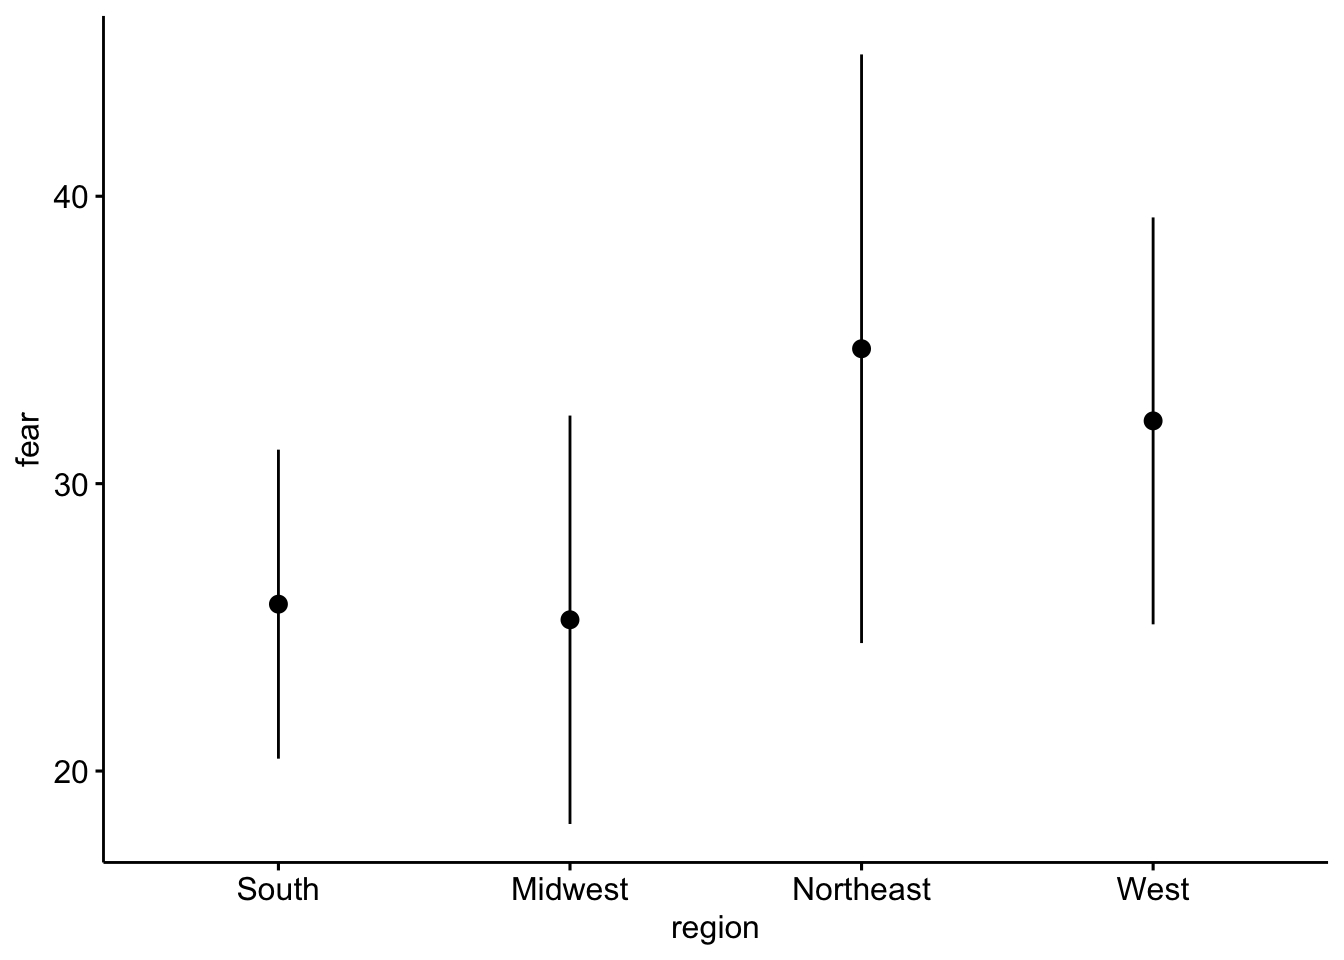
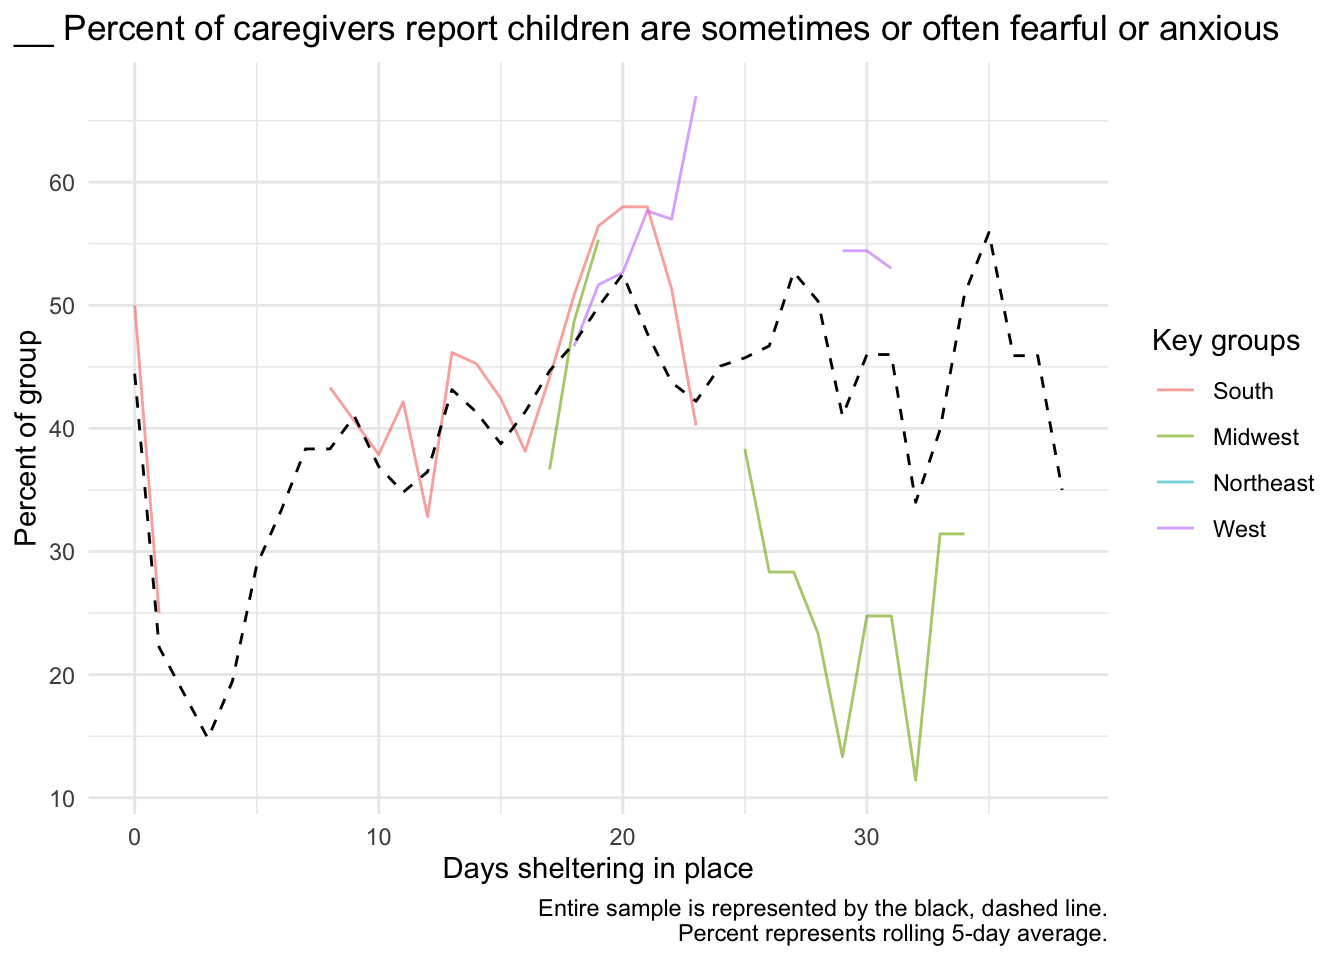
Child internalizing
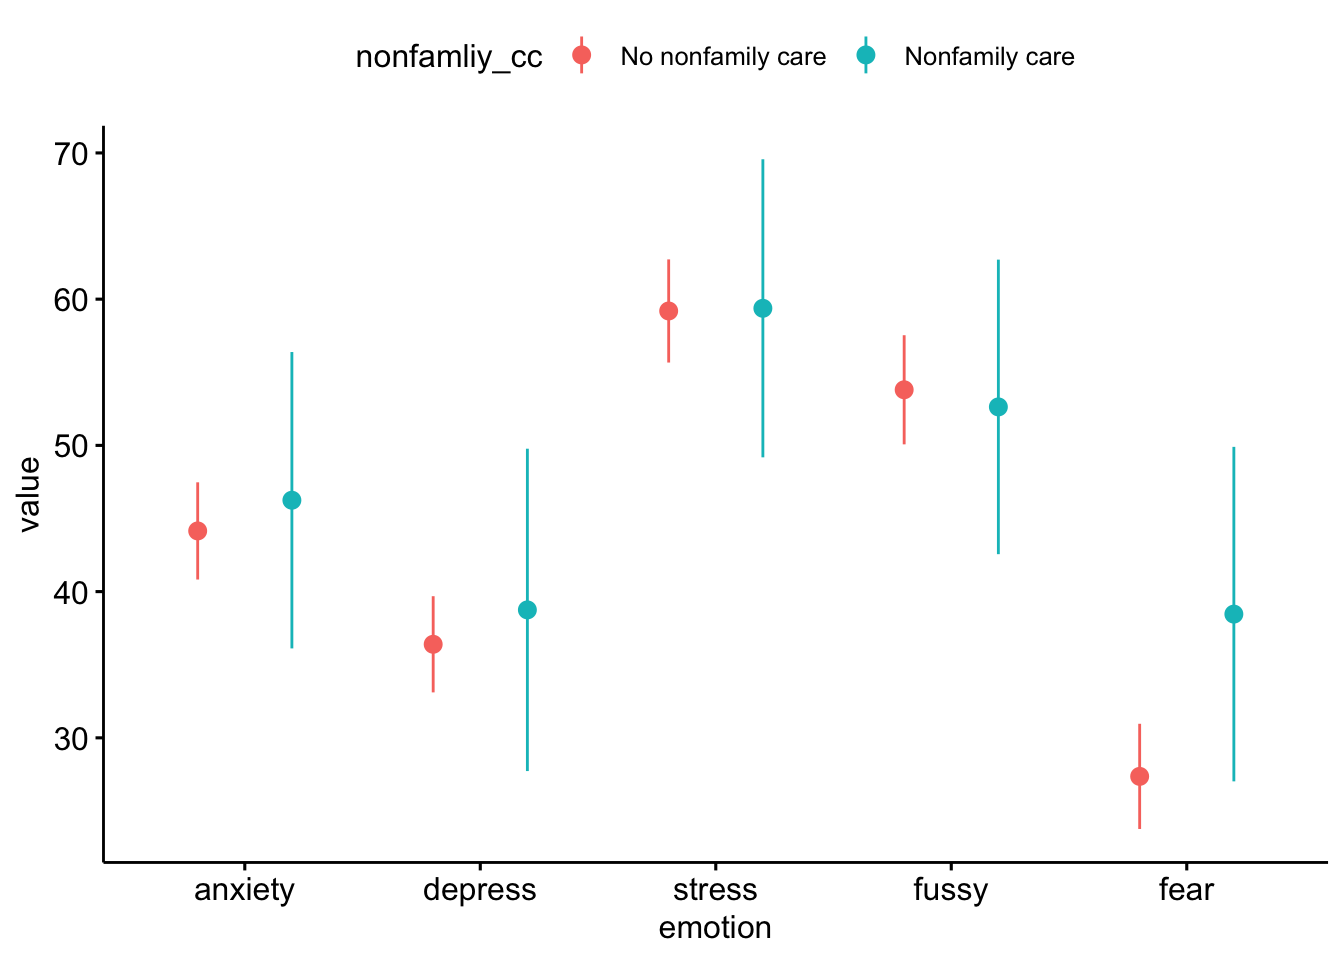
By childcare
Of these caregivers, 40 have non-family childcare and 359 do not.
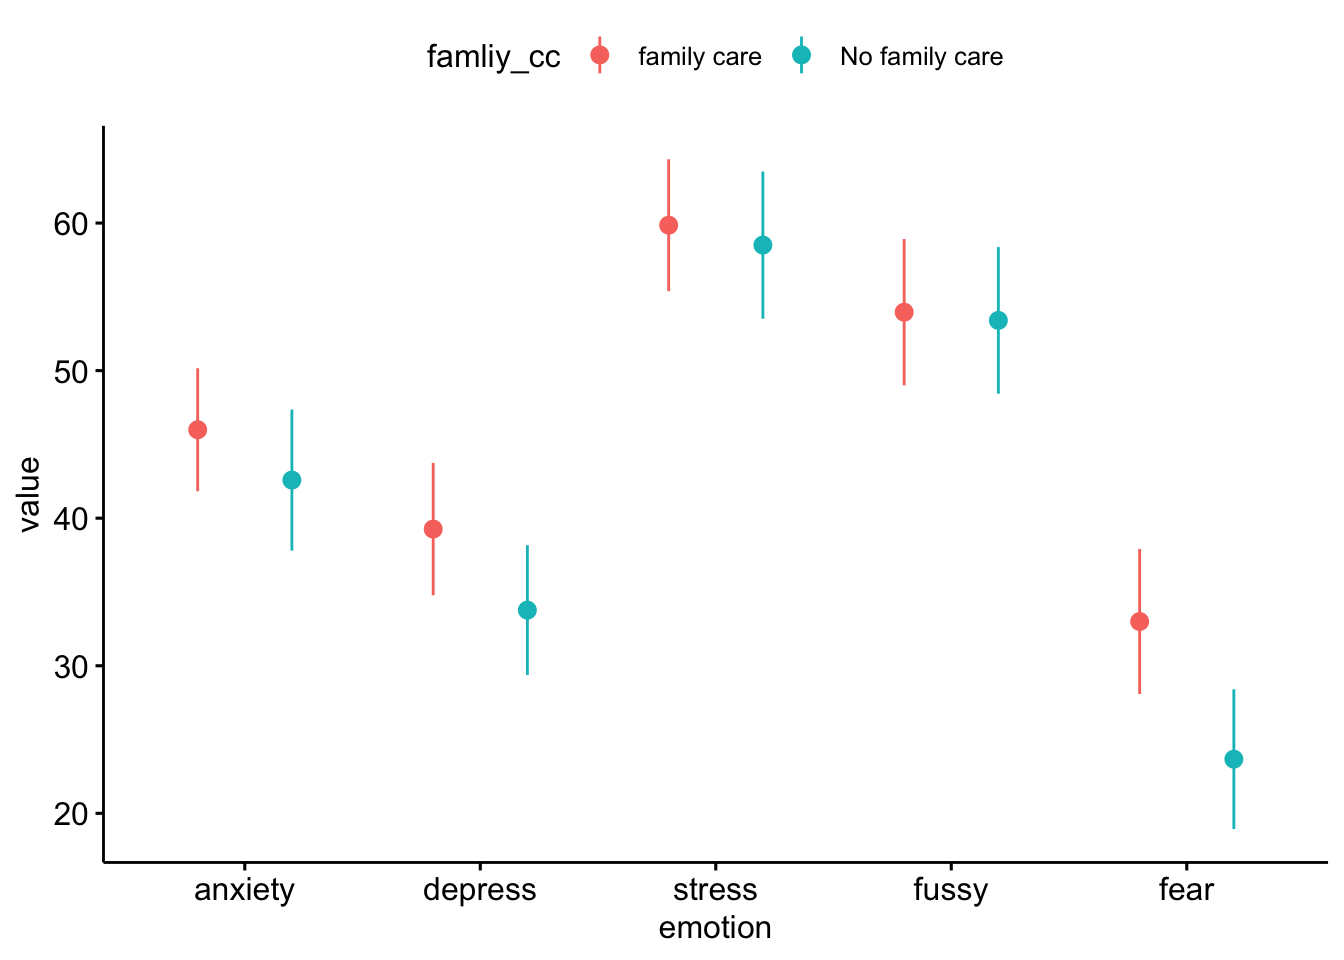
Of these caregivers, 208 have family childcare and 191 do not.
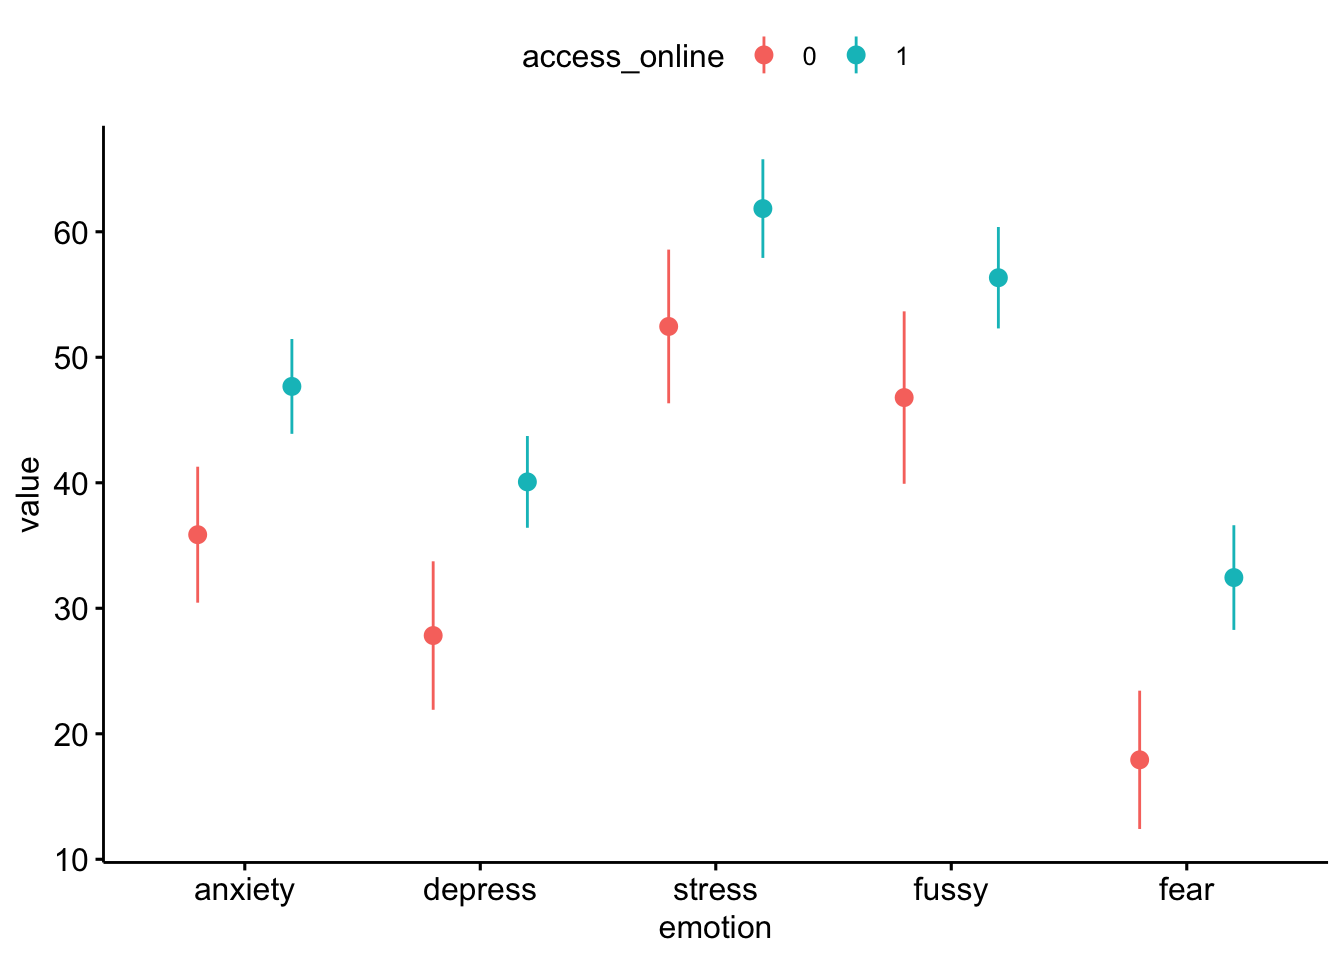
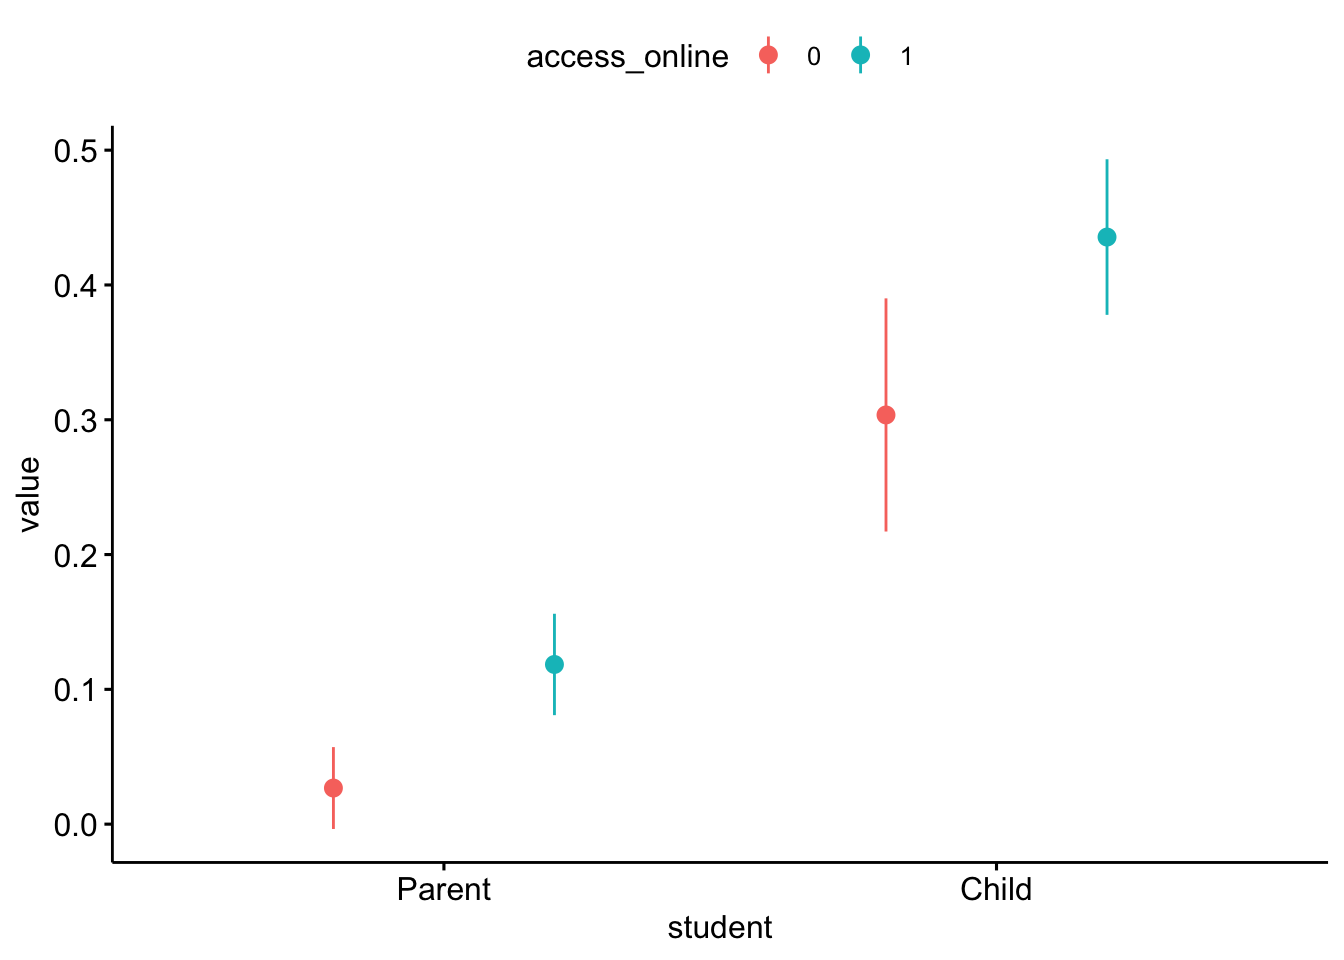
By use of online resources
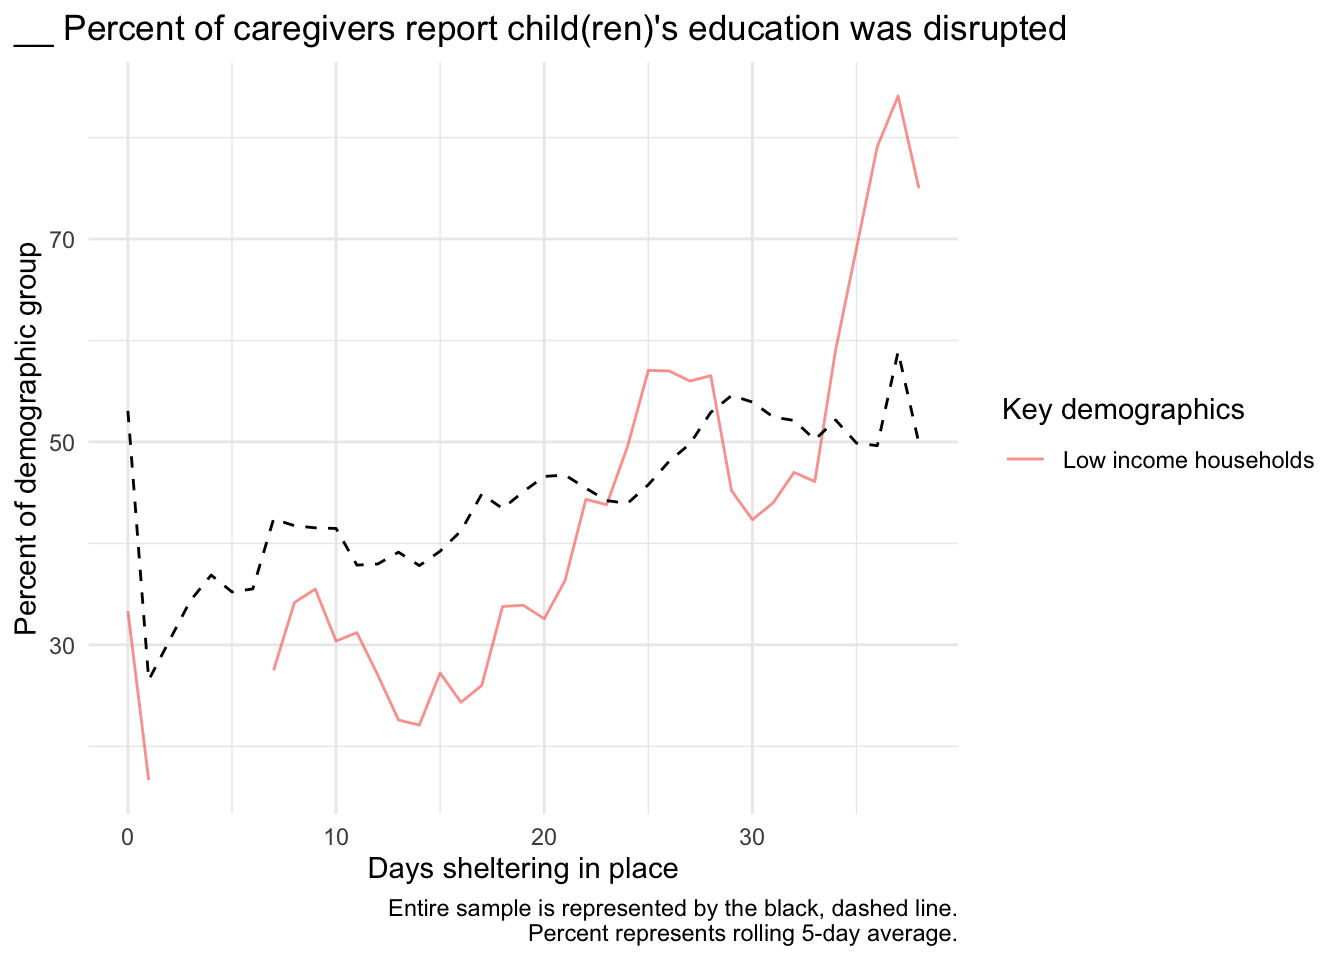
Education
Compared to general population
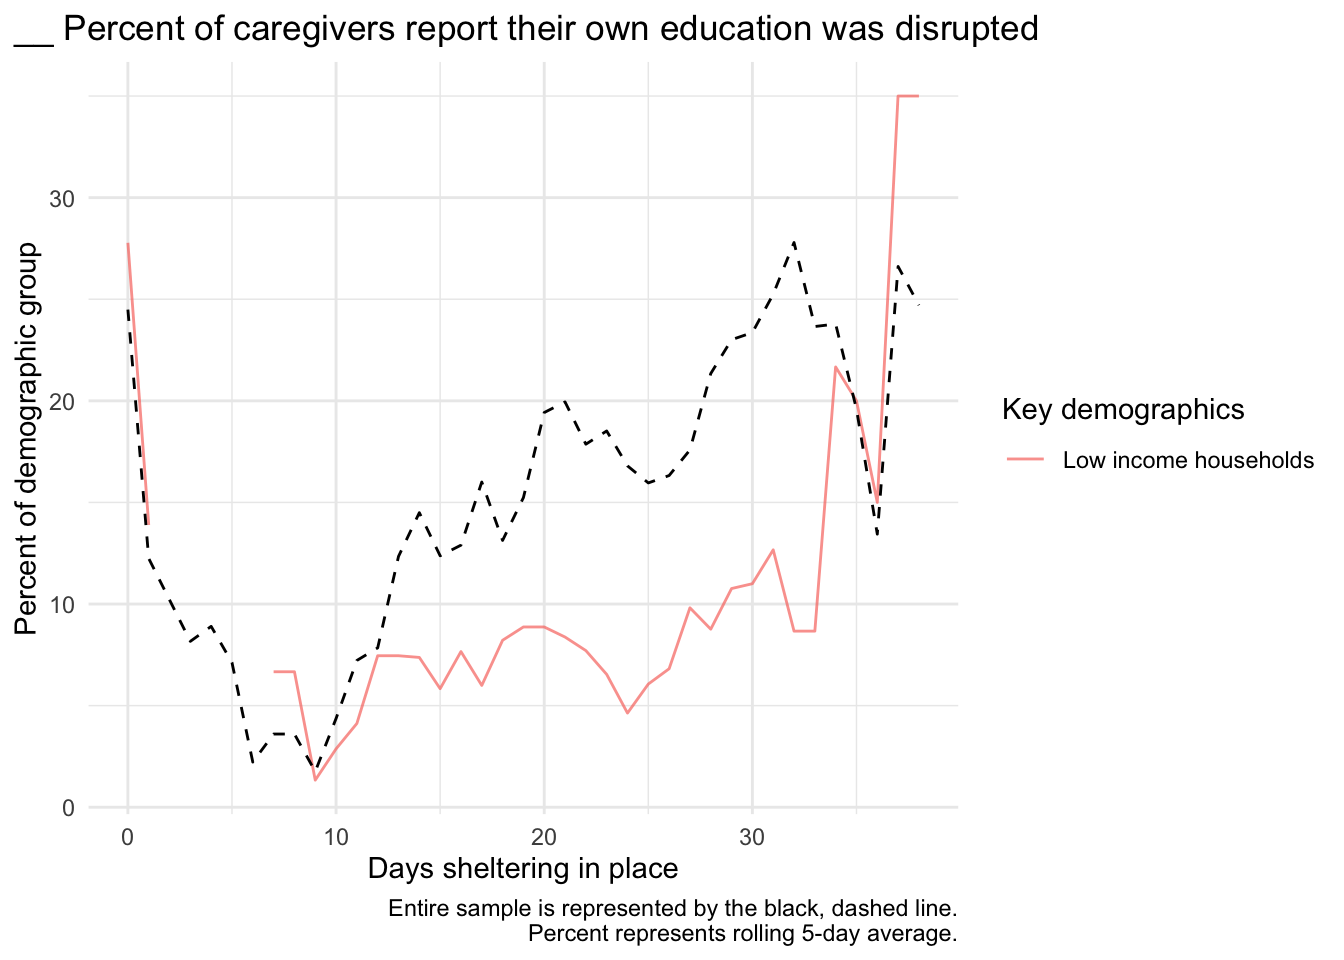
Parent education interrupted
Child education interrupted
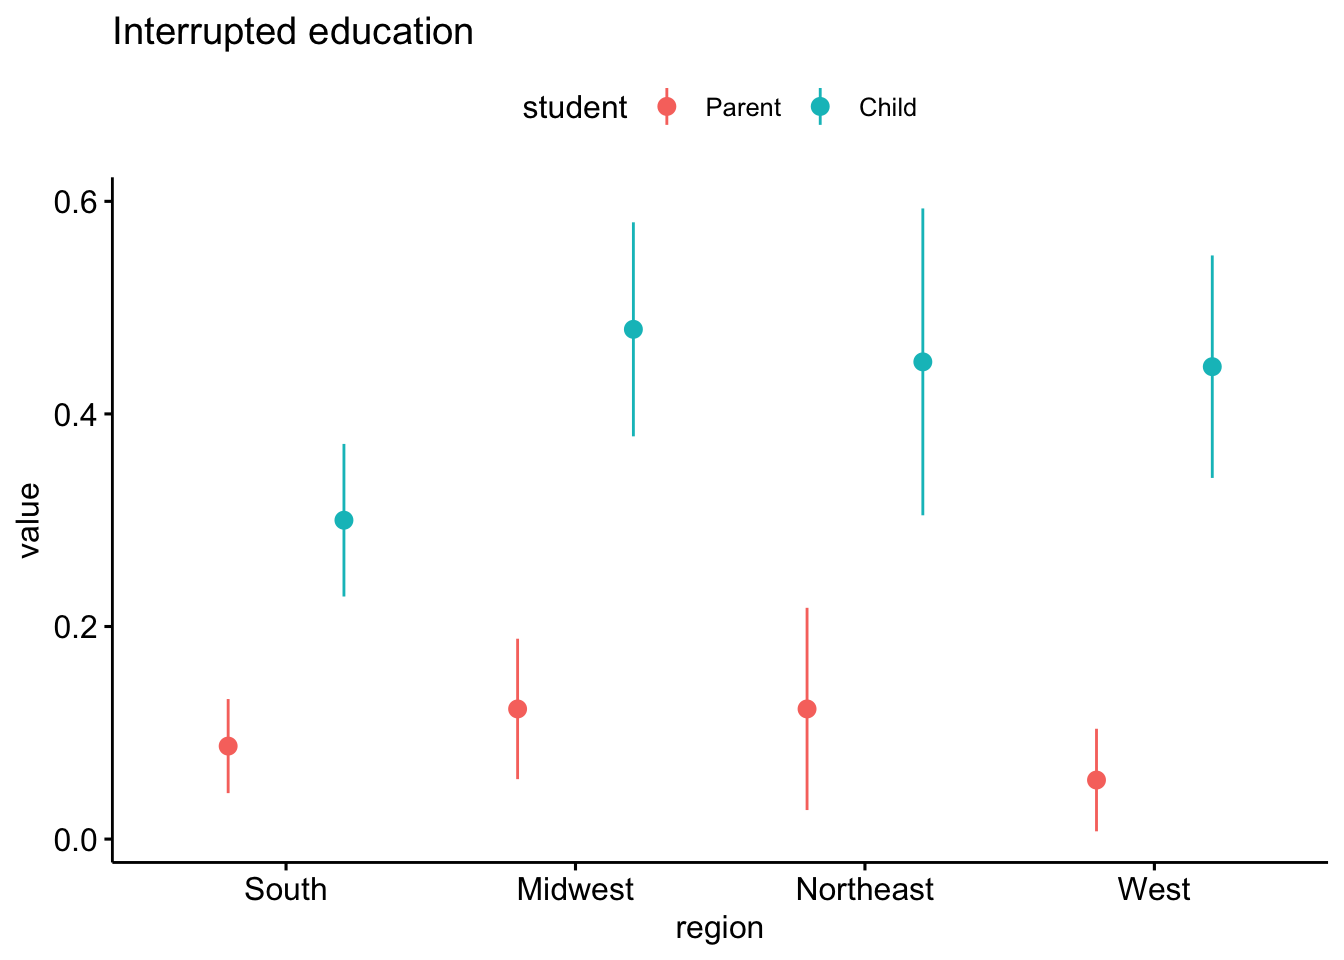
By geographic region
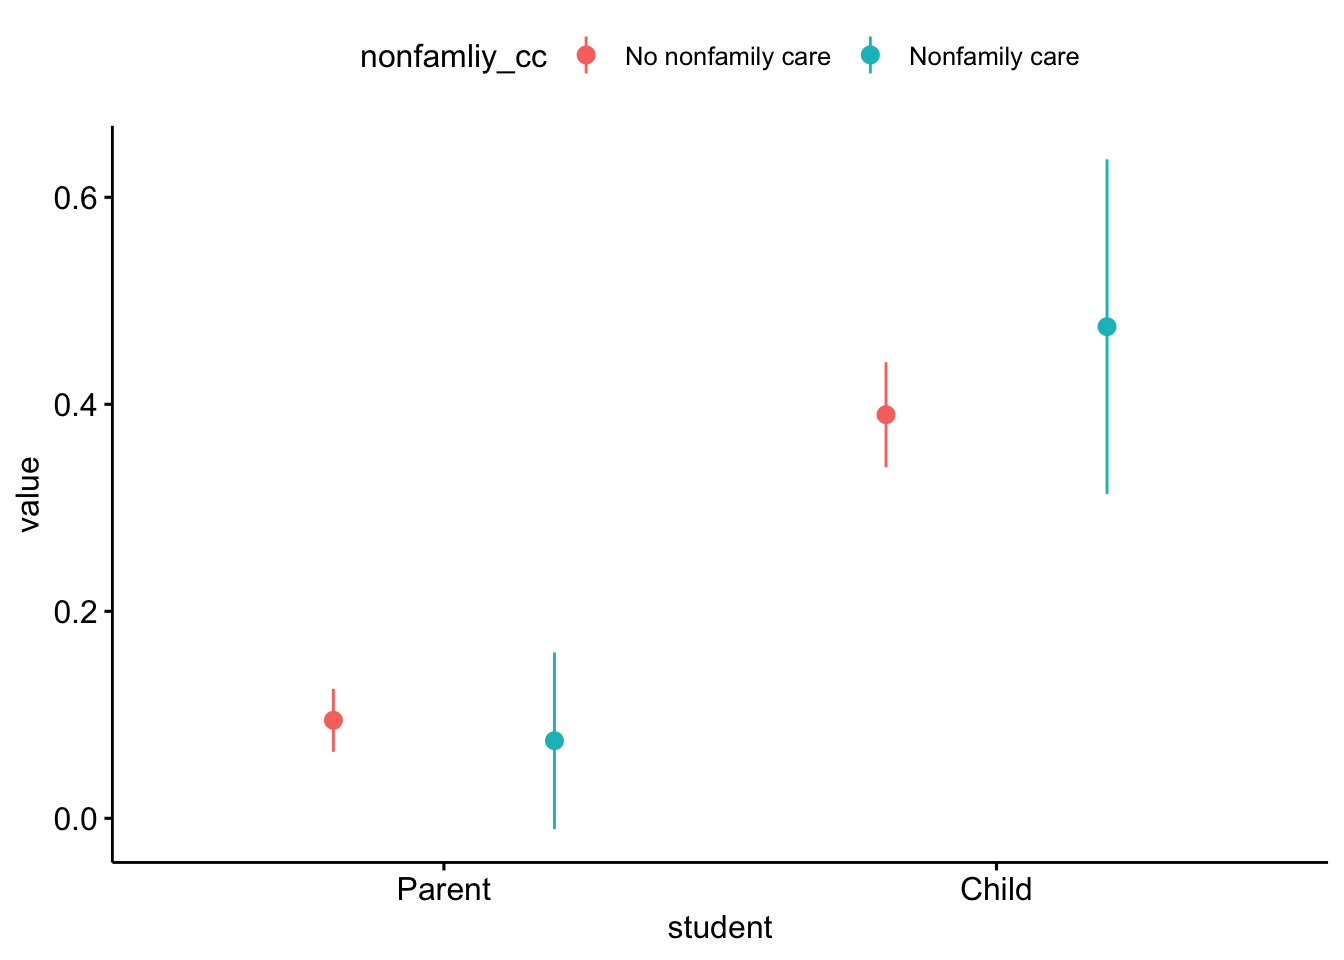
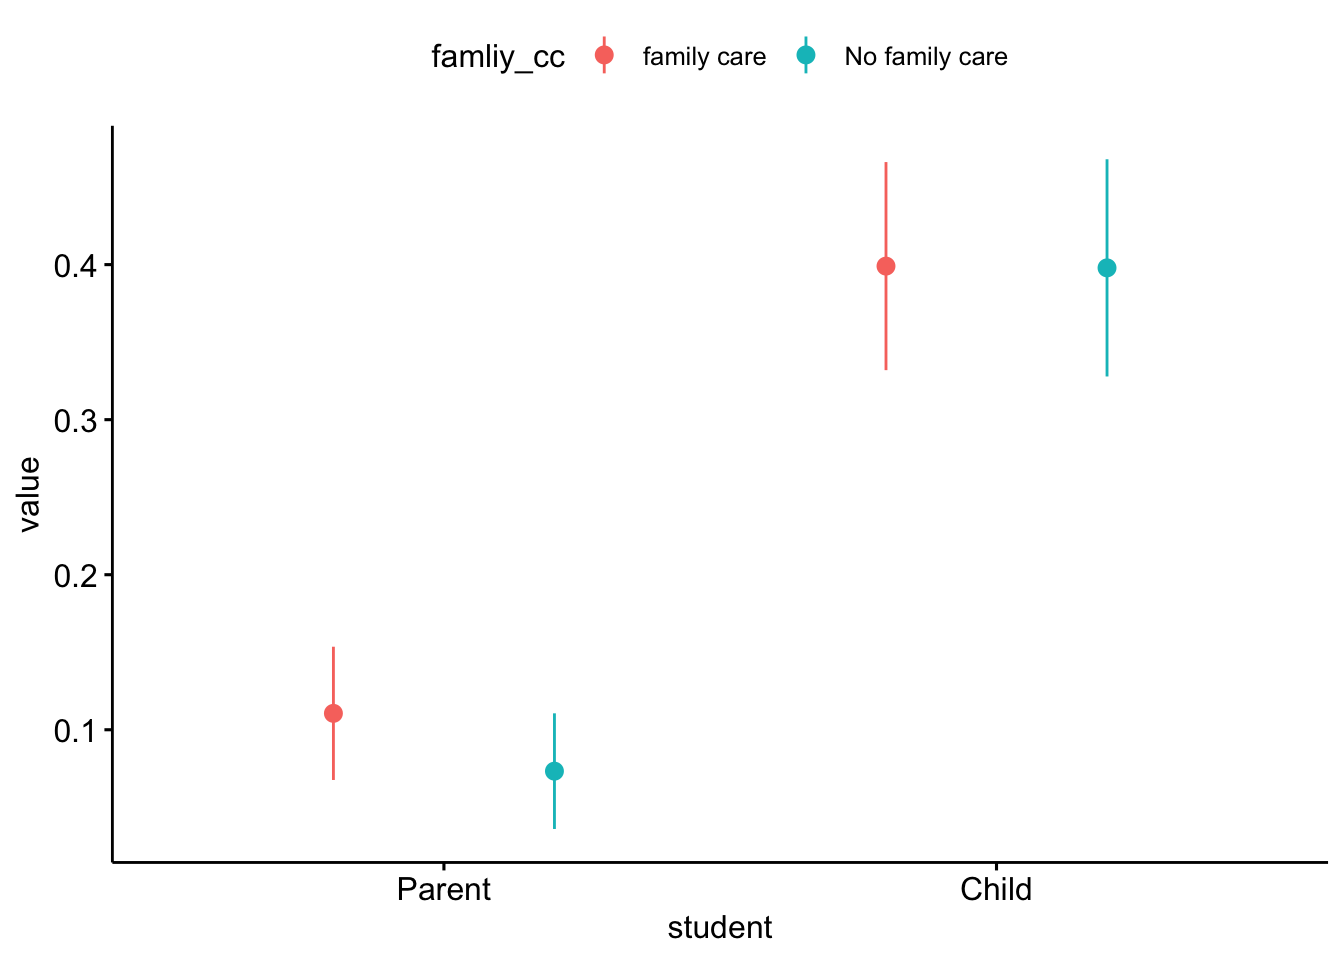
By childcare
Of these caregivers, 40 have non-family childcare and 359 do not.
Of these caregivers, 208 have family childcare and 191 do not.
By use of online resources
Differences
Lost income
##
##  Pearson's Chi-squared test with Yates' continuity correction
##
## data:  week1$poverty and week1$income_decreaed
## X-squared = 29.59, df = 1, p-value = 5.337e-08
## # A tibble: 2 x 4
## poverty n decreased_income percent
## <dbl> <int> <dbl> <dbl>
## 1 0 835 343 0.411
## 2 1 399 230 0.576Lost non-family childcare
##
##  Pearson's Chi-squared test with Yates' continuity correction
##
## data:  week1$poverty and week1$decrease_nonfamilyCC
## X-squared = 28.414, df = 1, p-value = 9.796e-08
## # A tibble: 2 x 4
## poverty n decrease_nonfamilyCC percent
## <dbl> <int> <dbl> <dbl>
## 1 0 835 478 0.572
## 2 1 399 163 0.409Trouble paying for basics
##
##  Pearson's Chi-squared test with Yates' continuity correction
##
## data:  week1$poverty and week1$difficulty_basics
## X-squared = 112.15, df = 1, p-value < 2.2e-16
## # A tibble: 2 x 4
## poverty n difficulty_basics percent
## <dbl> <int> <dbl> <dbl>
## 1 0 835 74 0.0886
## 2 1 399 132 0.331Delayed healthcare
##
##  Pearson's Chi-squared test with Yates' continuity correction
##
## data:  week1$poverty and week1$delay_healthcare
## X-squared = 5.6987, df = 1, p-value = 0.01698
## # A tibble: 2 x 4
## poverty n delay_healthcare percent
## <dbl> <int> <dbl> <dbl>
## 1 0 835 494 0.592
## 2 1 399 265 0.664Lost free lunch
##
##  Pearson's Chi-squared test with Yates' continuity correction
##
## data:  week1$poverty and week1$lost_free_lunch
## X-squared = 16.46, df = 1, p-value = 4.968e-05
## # A tibble: 2 x 4
## poverty n lost_free_lunch percent
## <dbl> <int> <dbl> <dbl>
## 1 0 835 67 0.0802
## 2 1 399 63 0.158Access to telehealth
##
##  Pearson's Chi-squared test with Yates' continuity correction
##
## data:  week1$poverty and week1$access_telehealth
## X-squared = 2.2319, df = 1, p-value = 0.1352
## # A tibble: 2 x 4
## poverty n access_telehealth percent
## <dbl> <int> <dbl> <dbl>
## 1 0 835 325 0.389
## 2 1 399 137 0.343Caregiver insurance
##
##  Pearson's Chi-squared test with Yates' continuity correction
##
## data:  week1$poverty and week1$insurance
## X-squared = 41.121, df = 1, p-value = 1.431e-10
## # A tibble: 2 x 4
## poverty n insurance percent
## <dbl> <int> <dbl> <dbl>
## 1 0 835 777 0.931
## 2 1 399 324 0.812Child insurance
##
##  Pearson's Chi-squared test with Yates' continuity correction
##
## data:  week1$poverty and week1$child_insurance
## X-squared = 9.0795, df = 1, p-value = 0.002585
## # A tibble: 2 x 4
## poverty n child_insurance percent
## <dbl> <int> <dbl> <dbl>
## 1 0 835 752 0.901
## 2 1 399 337 0.845Testing predictors of well-being in this demo
| Outcome | Coefficient Estimate | Std. Error | p-value | Corrected p-value |
|---|---|---|---|---|
| Lost income since pandemic (N = 230) | ||||
| Caregiver anxiety | 4.15 | 3.24 | 0.201 | 1.000 |
| Caregiver depression | 8.99 | 3.22 | 0.006 | 0.304 |
| Caregiver stress | 9.84 | 3.39 | 0.004 | 0.230 |
| Child externalzing | 5.64 | 3.60 | 0.118 | 1.000 |
| Child internalizing | 0.96 | 3.53 | 0.787 | 1.000 |
| Lost employment since pandemic (N = 180) | ||||
| Caregiver anxiety | 8.62 | 3.46 | 0.013 | 0.688 |
| Caregiver depression | 11.17 | 3.46 | 0.001 | 0.085 |
| Caregiver stress | 7.87 | 3.71 | 0.035 | 1.000 |
| Child externalzing | 3.93 | 3.94 | 0.319 | 1.000 |
| Child internalizing | 2.00 | 3.90 | 0.609 | 1.000 |
| Have difficulty paying for basics (N = 132) | ||||
| Caregiver anxiety | 14.65 | 3.32 | 0.000 | 0.001 |
| Caregiver depression | 16.77 | 3.30 | 0.000 | 0.000 |
| Caregiver stress | 17.37 | 3.49 | 0.000 | 0.000 |
| Child externalzing | 8.43 | 3.78 | 0.026 | 1.000 |
| Child internalizing | 12.28 | 3.69 | 0.001 | 0.062 |
| Two or more children in household (N = 222) | ||||
| Caregiver anxiety | 1.37 | 3.22 | 0.671 | 1.000 |
| Caregiver depression | 3.39 | 3.22 | 0.293 | 1.000 |
| Caregiver stress | 4.88 | 3.40 | 0.152 | 1.000 |
| Child externalzing | 9.23 | 3.55 | 0.010 | 0.527 |
| Child internalizing | 3.64 | 3.51 | 0.301 | 1.000 |
| Three or more children in household (N = 116) | ||||
| Caregiver anxiety | 0.46 | 3.53 | 0.897 | 1.000 |
| Caregiver depression | 0.61 | 3.53 | 0.862 | 1.000 |
| Caregiver stress | 5.85 | 3.71 | 0.116 | 1.000 |
| Child externalzing | 9.63 | 3.89 | 0.014 | 0.702 |
| Child internalizing | 11.01 | 3.81 | 0.004 | 0.233 |
| Can access online serivices (N = 287) | ||||
| Caregiver anxiety | 11.81 | 3.52 | 0.001 | 0.057 |
| Caregiver depression | 12.24 | 3.51 | 0.001 | 0.038 |
| Caregiver stress | 9.39 | 3.73 | 0.013 | 0.651 |
| Child externalzing | 9.55 | 3.95 | 0.016 | 0.782 |
| Child internalizing | 14.52 | 3.85 | 0.000 | 0.014 |
| Can access telehealth serivices (N = 137) | ||||
| Caregiver anxiety | 13.75 | 3.31 | 0.000 | 0.003 |
| Caregiver depression | 14.43 | 3.30 | 0.000 | 0.001 |
| Caregiver stress | 8.46 | 3.54 | 0.018 | 0.832 |
| Child externalzing | 3.34 | 3.75 | 0.373 | 1.000 |
| Child internalizing | 11.73 | 3.62 | 0.001 | 0.083 |
| Single parents (N = 119) | ||||
| Caregiver anxiety | 2.85 | 3.50 | 0.417 | 1.000 |
| Caregiver depression | 4.68 | 3.49 | 0.182 | 1.000 |
| Caregiver stress | 6.03 | 3.68 | 0.103 | 1.000 |
| Child externalzing | -1.57 | 3.90 | 0.689 | 1.000 |
| Child internalizing | 6.49 | 3.81 | 0.090 | 1.000 |
| Child education interrupted (N = 159) | ||||
| Caregiver anxiety | 0.66 | 3.27 | 0.840 | 1.000 |
| Caregiver depression | 1.83 | 3.27 | 0.575 | 1.000 |
| Caregiver stress | 1.16 | 3.45 | 0.738 | 1.000 |
| Child externalzing | 1.81 | 3.63 | 0.619 | 1.000 |
| Child internalizing | 10.38 | 3.53 | 0.004 | 0.210 |
| Parent education interrupted (N = 37) | ||||
| Caregiver anxiety | 8.70 | 5.51 | 0.115 | 1.000 |
| Caregiver depression | 8.78 | 5.50 | 0.112 | 1.000 |
| Caregiver stress | 6.23 | 5.82 | 0.285 | 1.000 |
| Child externalzing | 9.35 | 6.08 | 0.125 | 1.000 |
| Child internalizing | 5.86 | 5.95 | 0.325 | 1.000 |
| Have delayed healthcare (N = 265) | ||||
| Caregiver anxiety | 11.36 | 3.34 | 0.001 | 0.051 |
| Caregiver depression | 10.59 | 3.35 | 0.002 | 0.104 |
| Caregiver stress | 12.46 | 3.53 | 0.000 | 0.033 |
| Child externalzing | 10.69 | 3.72 | 0.004 | 0.244 |
| Child internalizing | 12.46 | 3.64 | 0.001 | 0.048 |
| African American (N = 54) | ||||
| Caregiver anxiety | -5.97 | 4.67 | 0.202 | 1.000 |
| Caregiver depression | 0.82 | 4.68 | 0.860 | 1.000 |
| Caregiver stress | 1.66 | 4.94 | 0.737 | 1.000 |
| Child externalzing | -2.13 | 5.17 | 0.681 | 1.000 |
| Child internalizing | 5.98 | 5.12 | 0.245 | 1.000 |
| Latinx (N = 87) | ||||
| Caregiver anxiety | 1.98 | 3.88 | 0.610 | 1.000 |
| Caregiver depression | -3.40 | 3.88 | 0.382 | 1.000 |
| Caregiver stress | -1.54 | 4.09 | 0.708 | 1.000 |
| Child externalzing | 4.81 | 4.34 | 0.268 | 1.000 |
| Child internalizing | -0.05 | 4.27 | 0.991 | 1.000 |
| Caregivers of children with disabilities (N = 64) | ||||
| Caregiver anxiety | 8.29 | 4.34 | 0.057 | 1.000 |
| Caregiver depression | 14.78 | 4.30 | 0.001 | 0.046 |
| Caregiver stress | 11.30 | 4.59 | 0.014 | 0.709 |
| Child externalzing | 8.04 | 4.86 | 0.099 | 1.000 |
| Child internalizing | 22.58 | 4.71 | 0.000 | 0.000 |
| Essential employees (N = 116) | ||||
| Caregiver anxiety | 0.82 | 3.53 | 0.816 | 1.000 |
| Caregiver depression | -0.73 | 3.53 | 0.836 | 1.000 |
| Caregiver stress | -3.08 | 3.72 | 0.408 | 1.000 |
| Child externalzing | 0.45 | 3.95 | 0.910 | 1.000 |
| Child internalizing | -2.14 | 3.87 | 0.581 | 1.000 |
| Note: | ||||
| Coefficients estimated using a multi-level model in which responses are nested within caregivers. In the case of binary predictors, we report the number (N) of participants who fall into the category listed. p-values are adjusted using a Holm correction | ||||
Trends by income
Caregiver anxiety
Caregiver depression
Caregiver stress
Child externalizing
Child internalizing
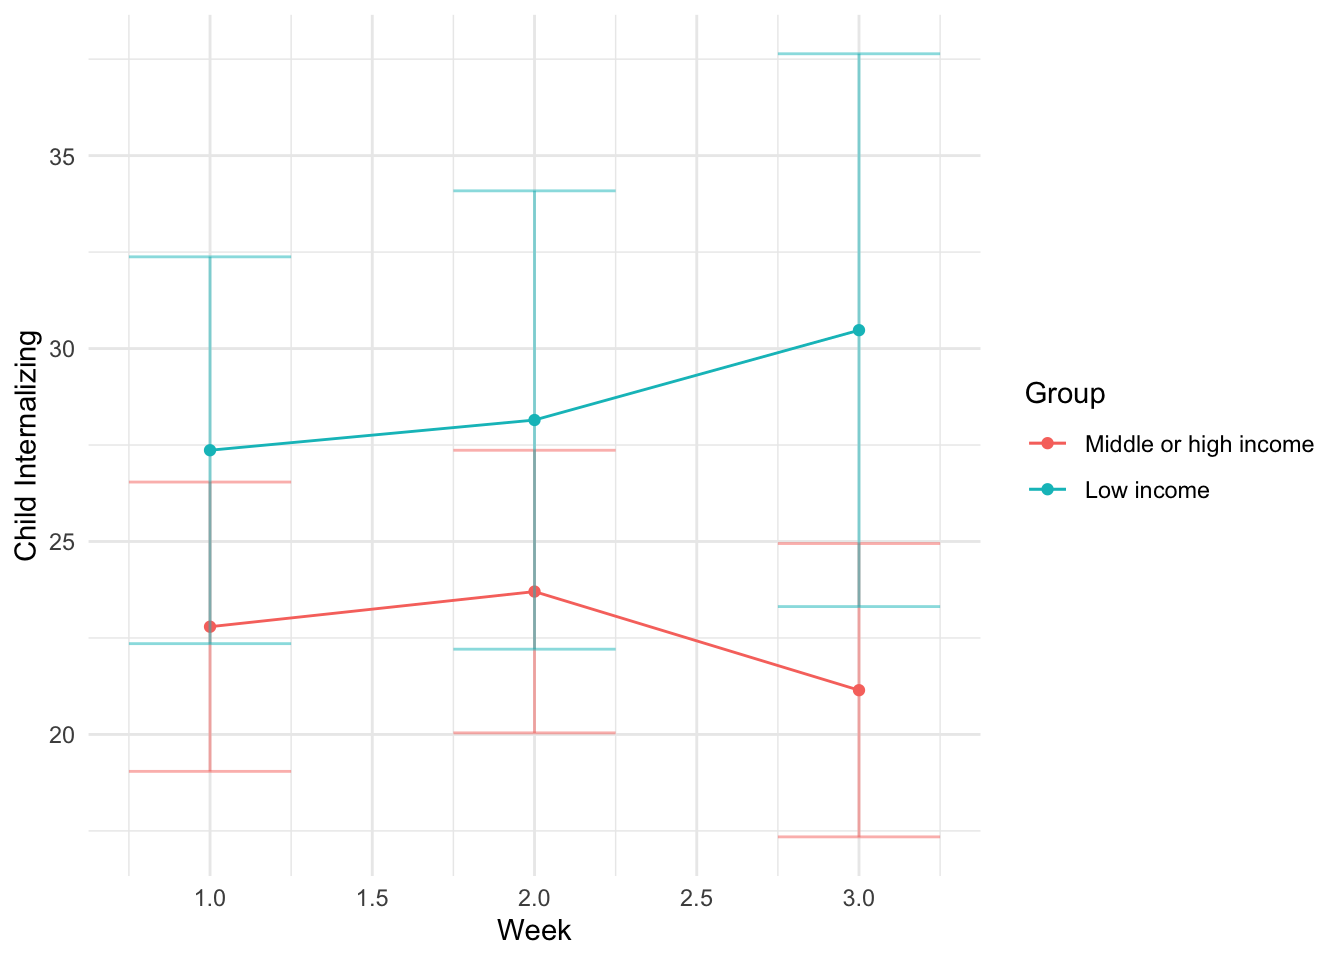
Child Internalizing
Plots
Test of slope
Weeks 1+
Baseline model
| Term | Coef | SE | t | p |
|---|---|---|---|---|
| Fixed effects | ||||
| (Intercept) | 24.15 | 2.99 | 8.08 | 0.000 |
| Week | -0.79 | 1.41 | -0.56 | 0.576 |
| poverty | 1.47 | 5.19 | 0.28 | 0.776 |
| Week:poverty | 2.30 | 2.50 | 0.92 | 0.359 |
| Random effects | ||||
| sd__(Intercept) | 28.28 | |||
| sd__Observation | 16.16 | |||
Can we explain the effect?
| Mediator | Coefficient (Income) | Coefficient of mediator |
|---|---|---|
| access_online | 1.77 | 2.56 |
| black | -2.89 | 2.49 |
| child_insurance | -2.66 | 1.93 |
| decrease_nonfamilyCC | 1.39 | 2.33 |
| difficulty_basics | 7.40* | 0.73 |
| employment_decreased | 1.70 | 3.91 |
| free_food | 1.47 | 1.33 |
| income_decreaed | -1.95 | 3.19 |
| insurance | 2.14 | 2.29 |
| latinx | 2.14 | 2.76 |
| losejob_sickleave | -2.96 | 1.01 |
| lost_free_lunch | 5.31 | 1.82 |
| minority | 2.54 | 2.11 |
| support_decrease | -1.50 | 2.66 |
Week 0 to first response
Baseline model
| Term | Coef | SE | t | p |
|---|---|---|---|---|
| (Intercept) | 9.83 | 0.99 | 9.93 | 0.00 |
| poverty | 1.41 | 1.75 | 0.81 | 0.42 |
Can we explain the effect?
| Mediator | Coefficient (Income) | Coefficient of mediator |
|---|---|---|
| access_online | 3.91 | 1.79 |
| black | -0.36 | 1.46 |
| child_insurance | 2.13 | 1.43 |
| decrease_nonfamilyCC | 3.79* | 2.03 |
| difficulty_basics | 4.51 | 0.35 |
| employment_decreased | 4.73* | -0.20 |
| free_food | 0.40 | 1.26 |
| income_decreaed | 5.69* | 0.36 |
| insurance | 1.85 | 1.60 |
| latinx | -3.44 | 1.95 |
| losejob_sickleave | 2.34 | -0.17 |
| lost_free_lunch | 5.94* | 0.93 |
| minority | -1.31 | 1.54 |
| support_decrease | 9.38* | 1.88 |