Representativeness disclaimer
These analyses are based on responses collected from 1516 caregivers between the dates of August 25, 2020 and September 10, 2020. These caregivers represent a range of voices: 9.50% are Black/African American, 15.11% are LatinX, and 23.61% live at or below 1.5 times the federal poverty line. Proportions/percentages are calculated based on the item-level response rates, not out of the total sample size. The data for these analyses are not weighted.
Older children
School’s plans
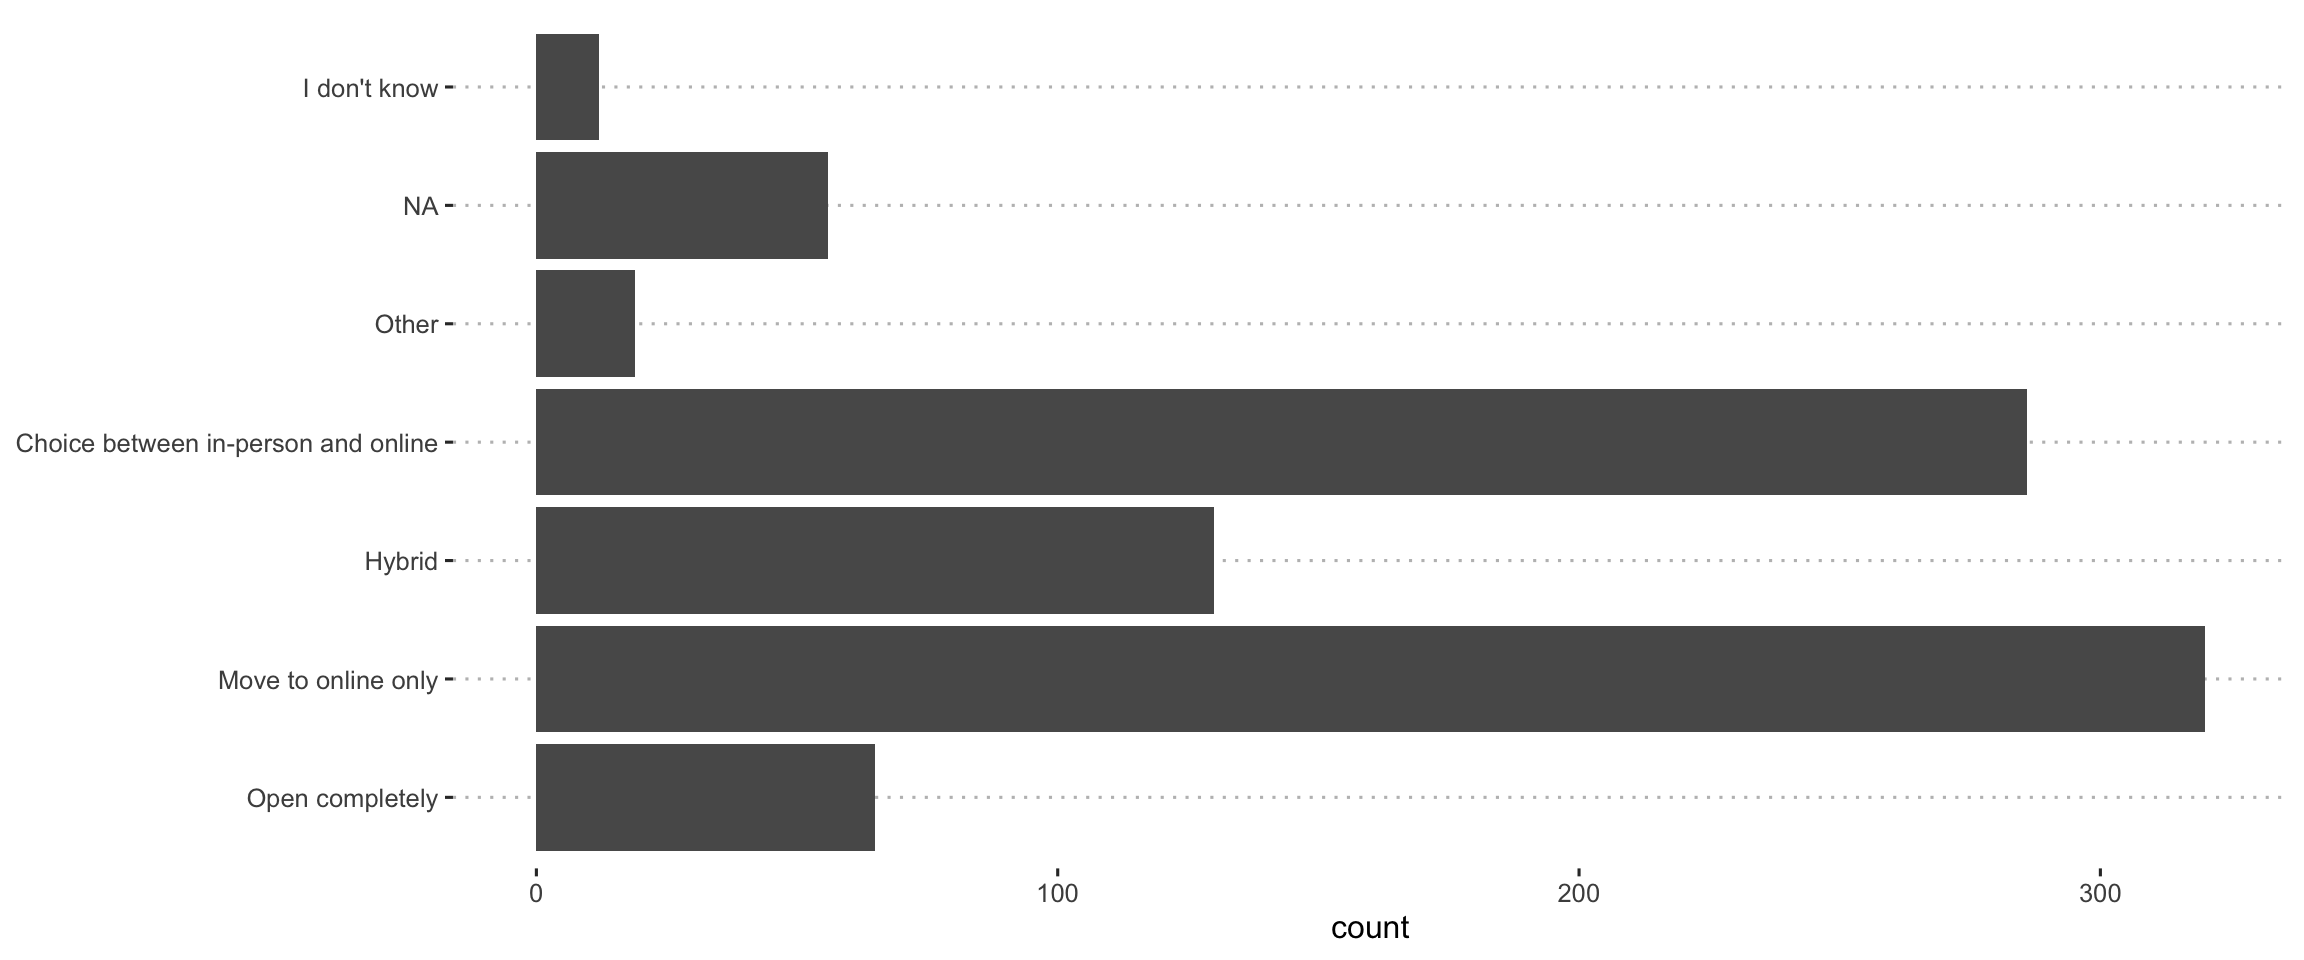
What has the school/school district your child(ren) plans to attend/currently attending decided regarding the school-year?
Overall
Black
The difference between groups is significant.
|
statistic
|
p.value
|
parameter
|
method
|
|
13.13
|
.041
|
6
|
Pearson’s Chi-squared test
|
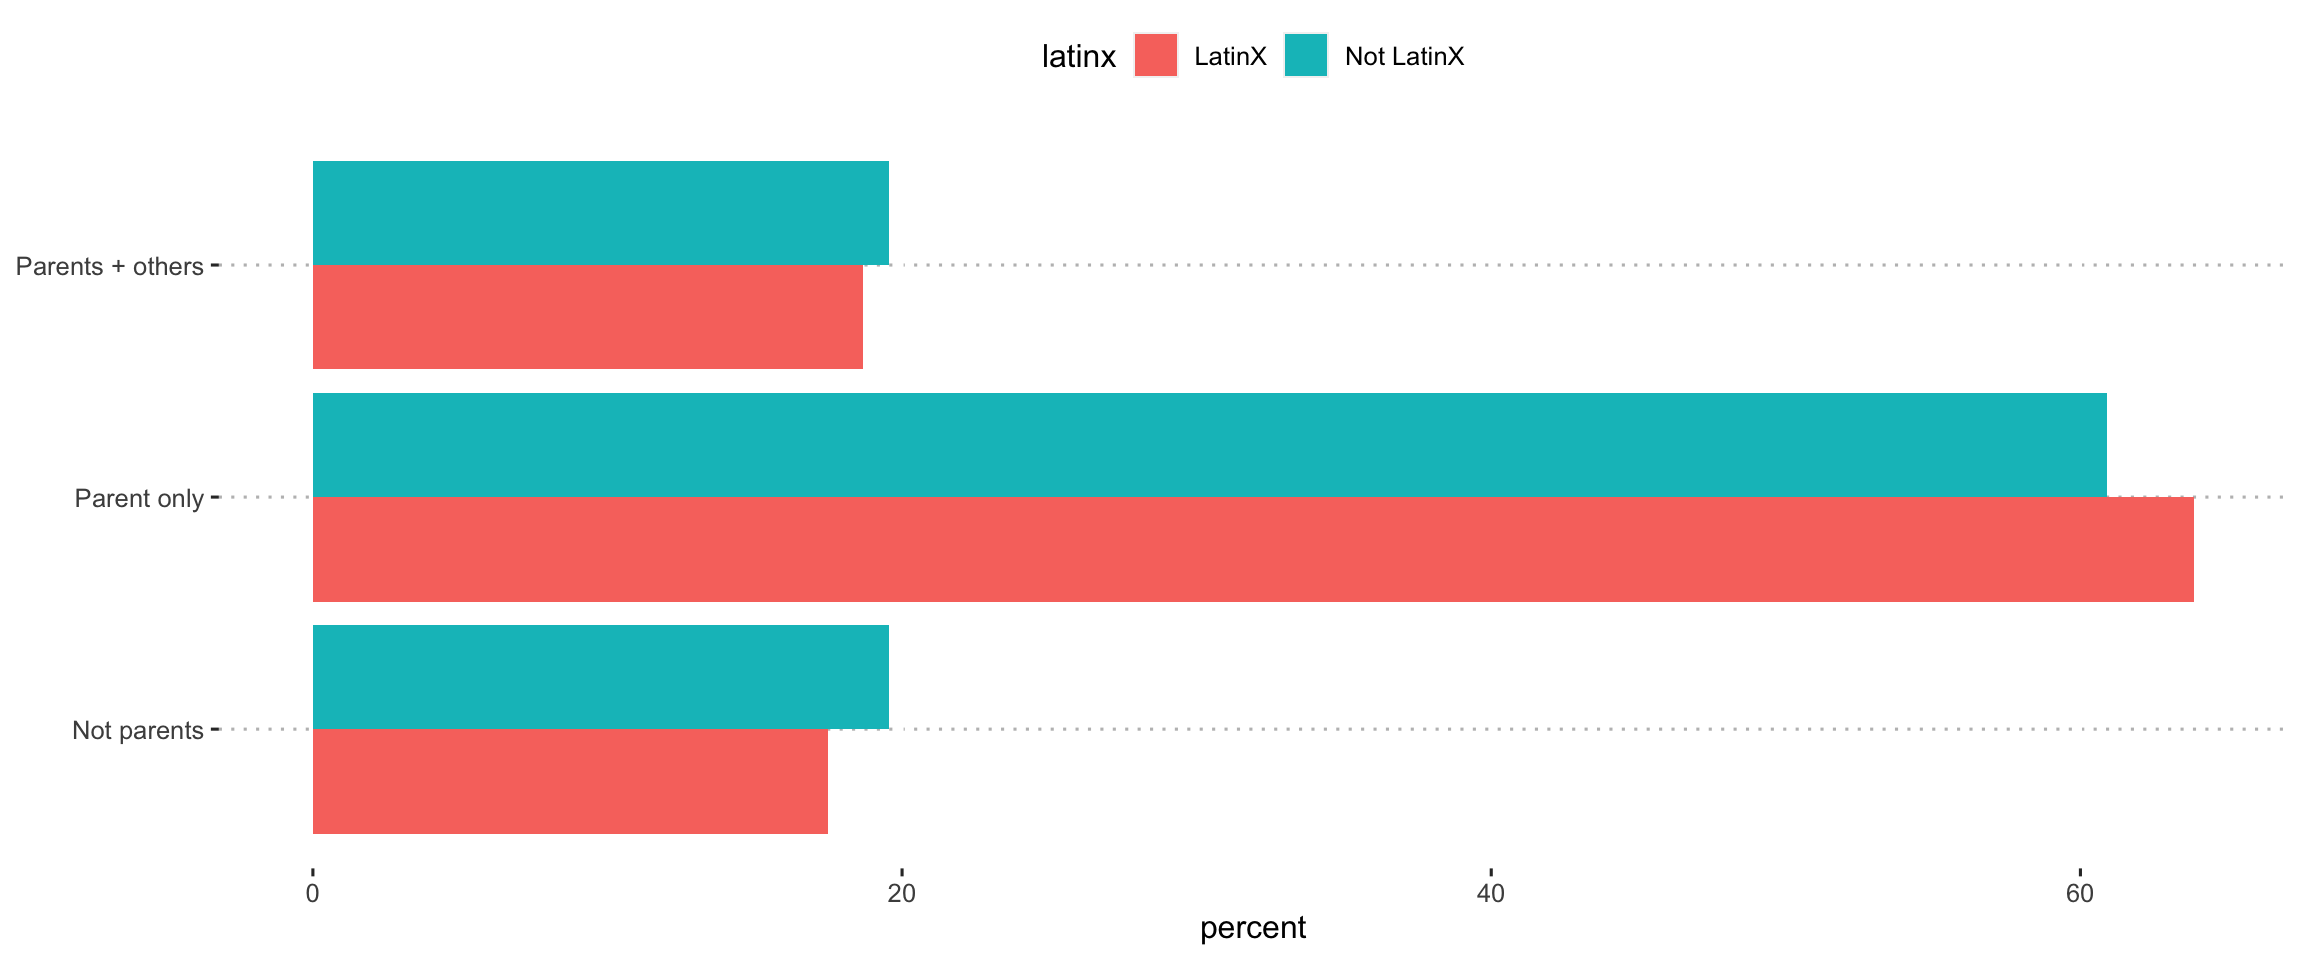
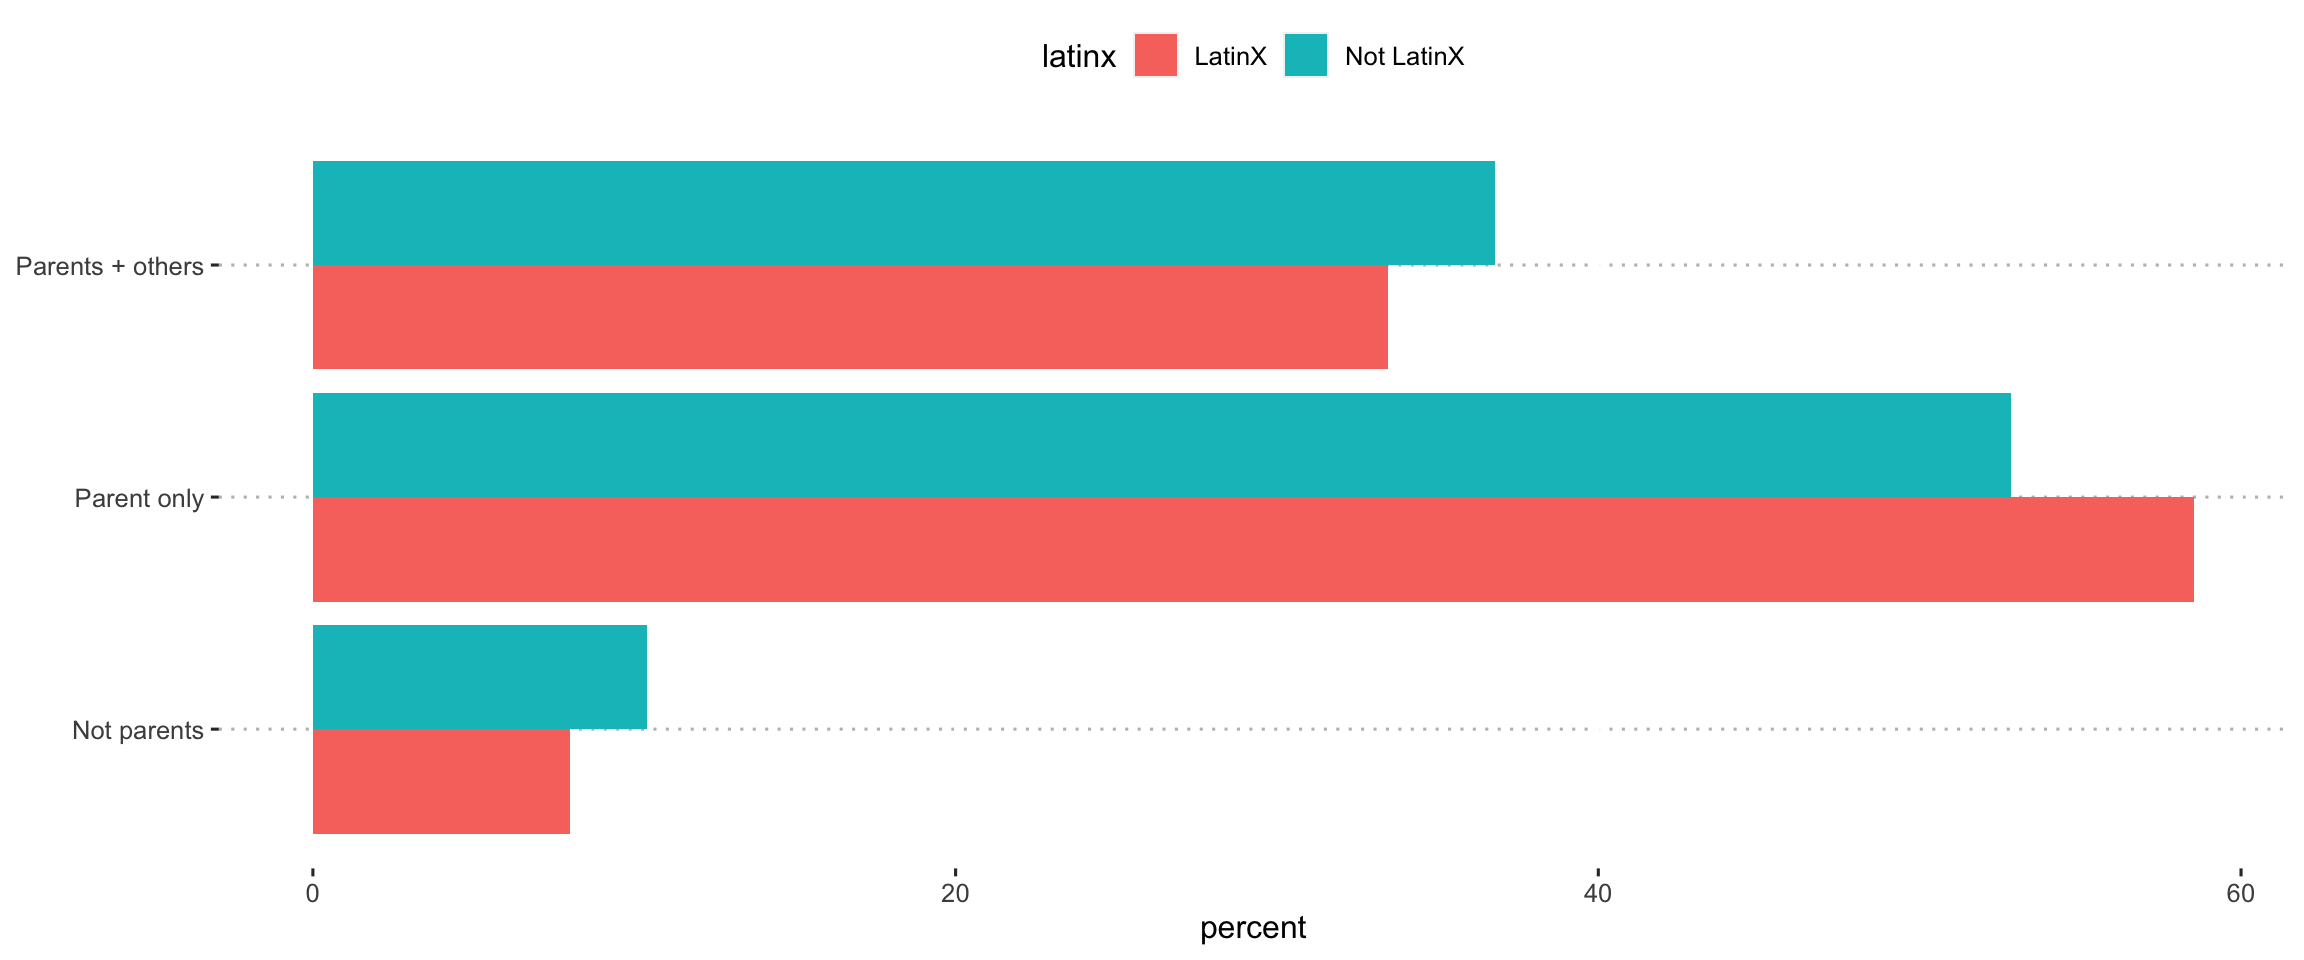
LatinX
The difference between groups is significant.
|
statistic
|
p.value
|
parameter
|
method
|
|
28.08
|
< .001
|
6
|
Pearson’s Chi-squared test
|
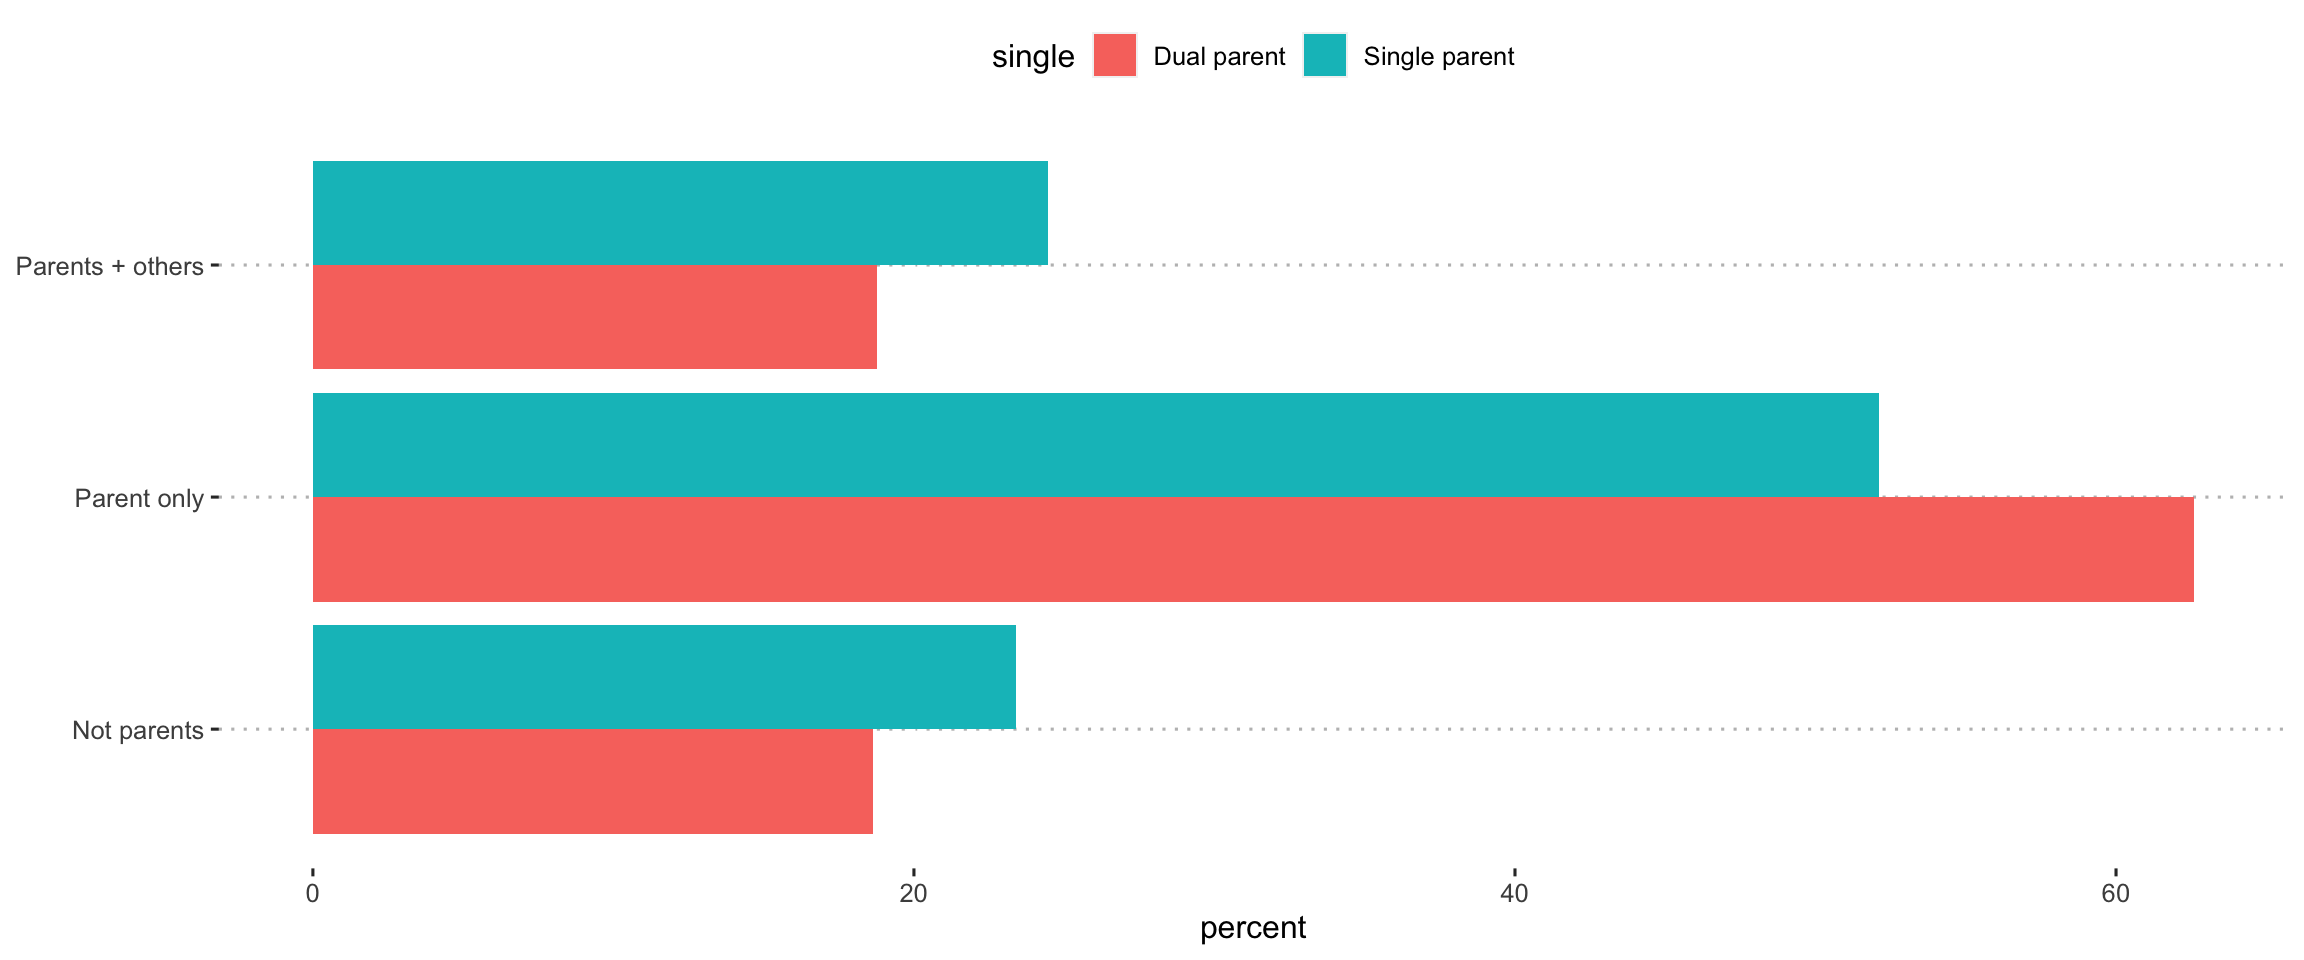
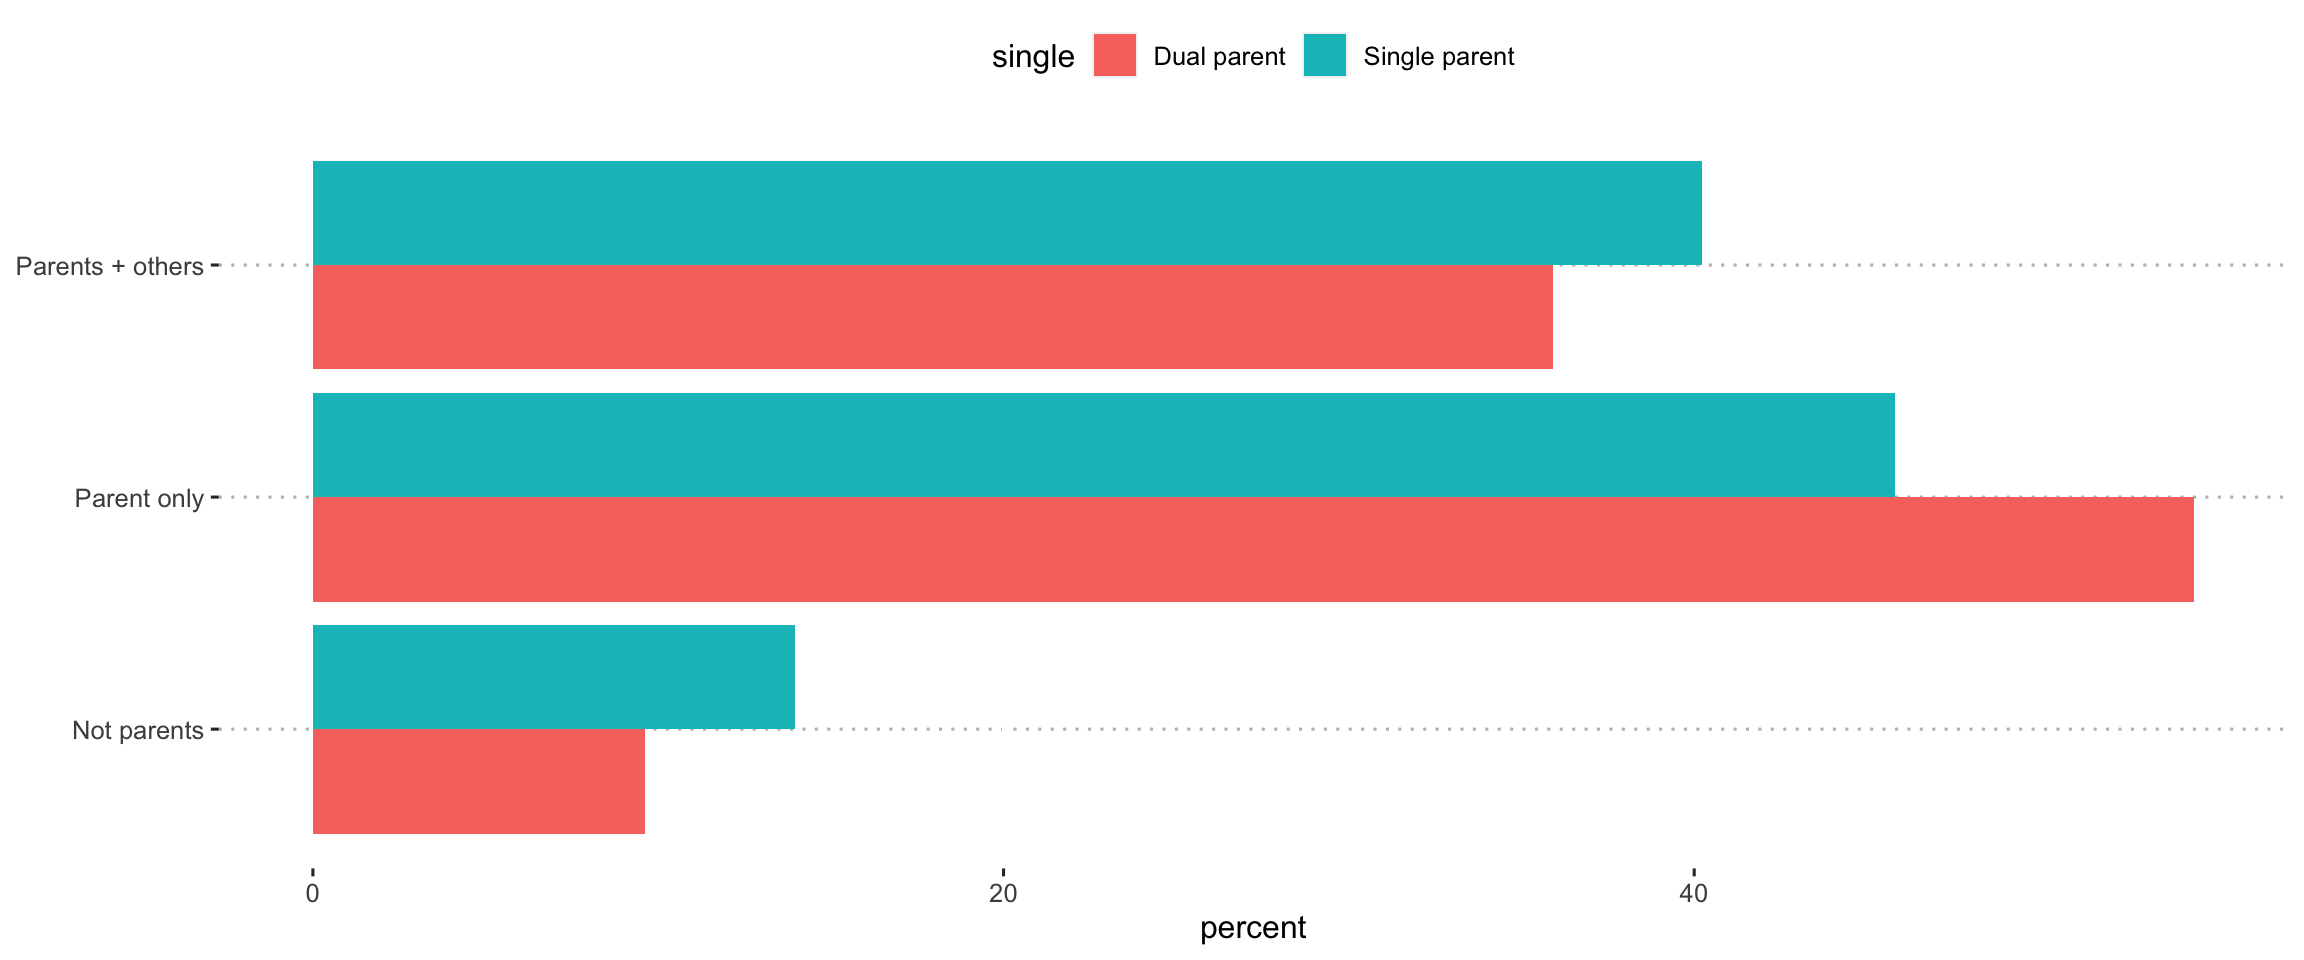
Single
The difference between groups is not significant.
|
statistic
|
p.value
|
parameter
|
method
|
|
11.96
|
.063
|
6
|
Pearson’s Chi-squared test
|
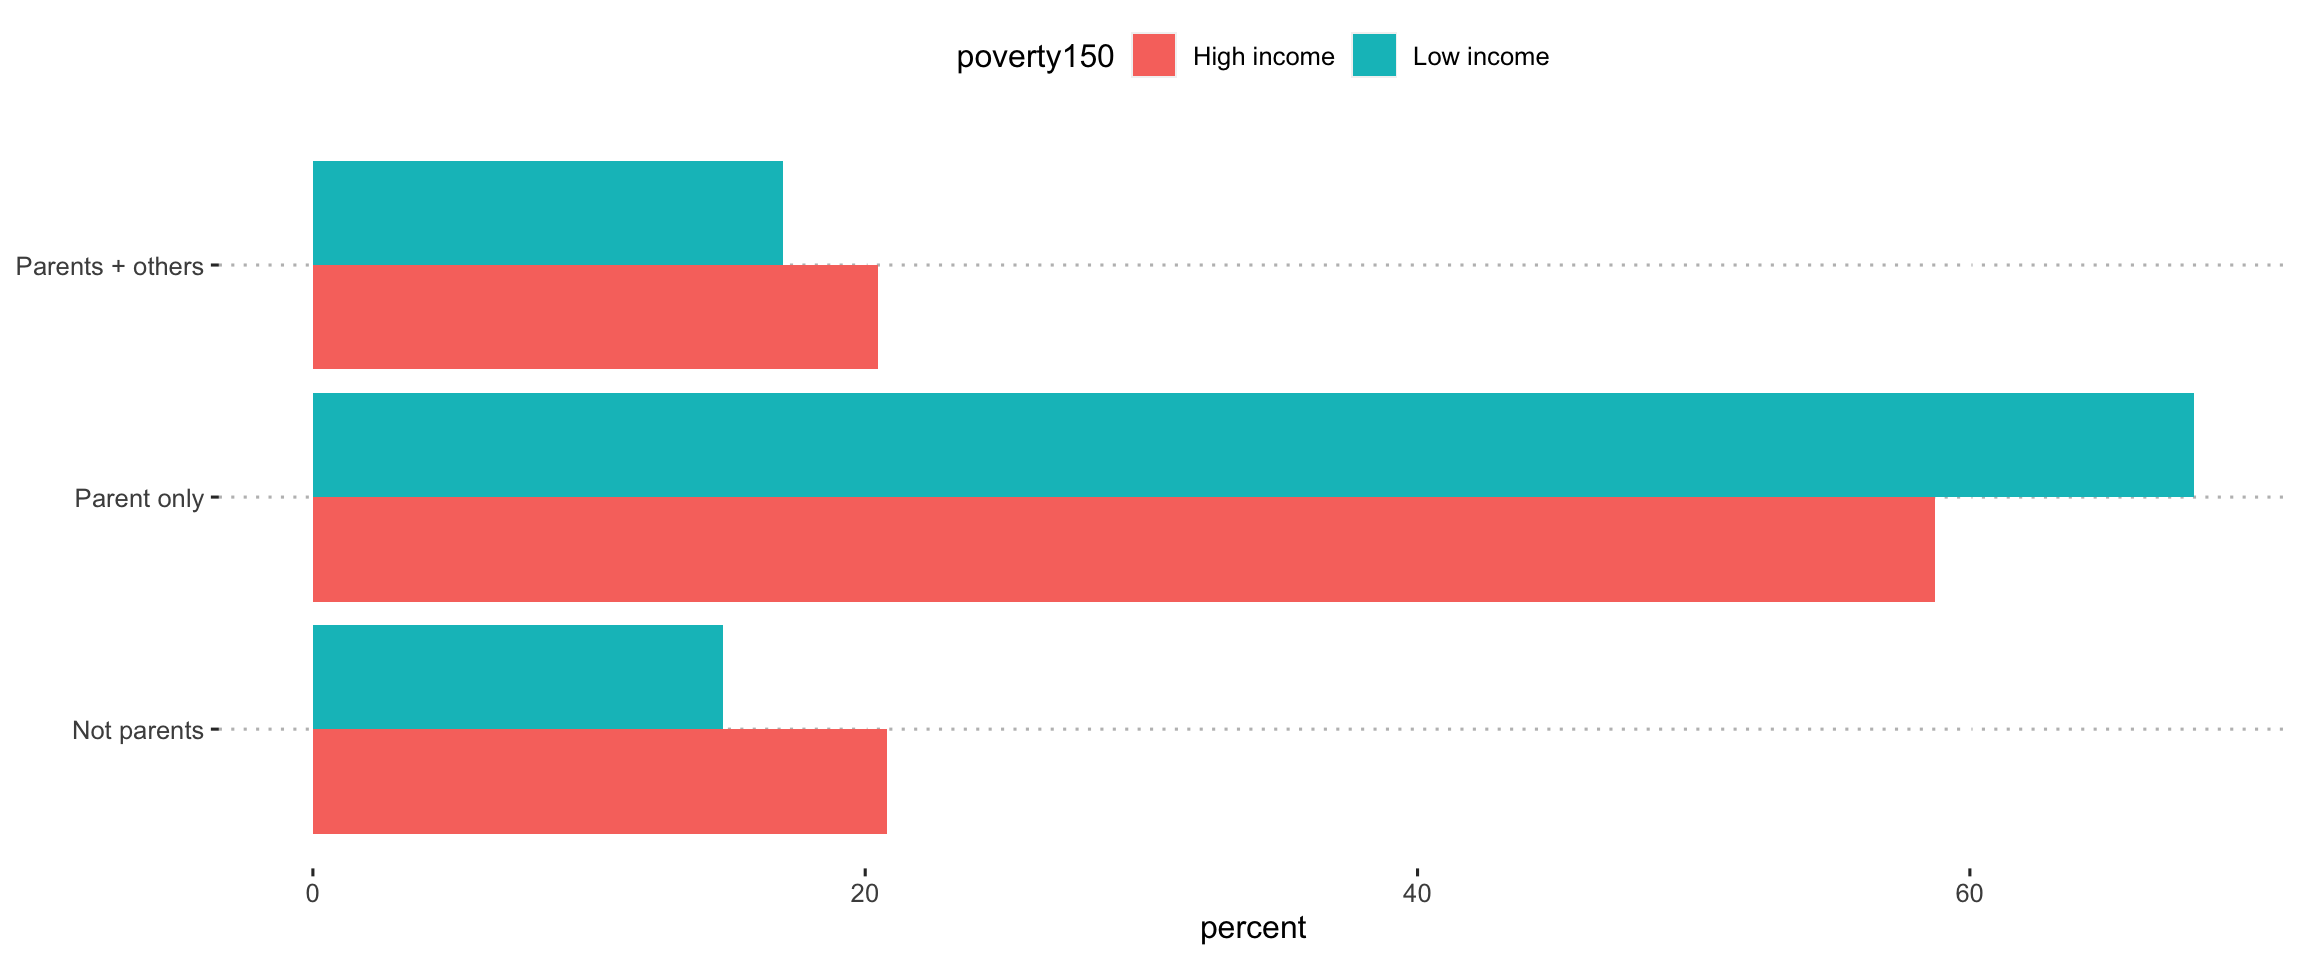
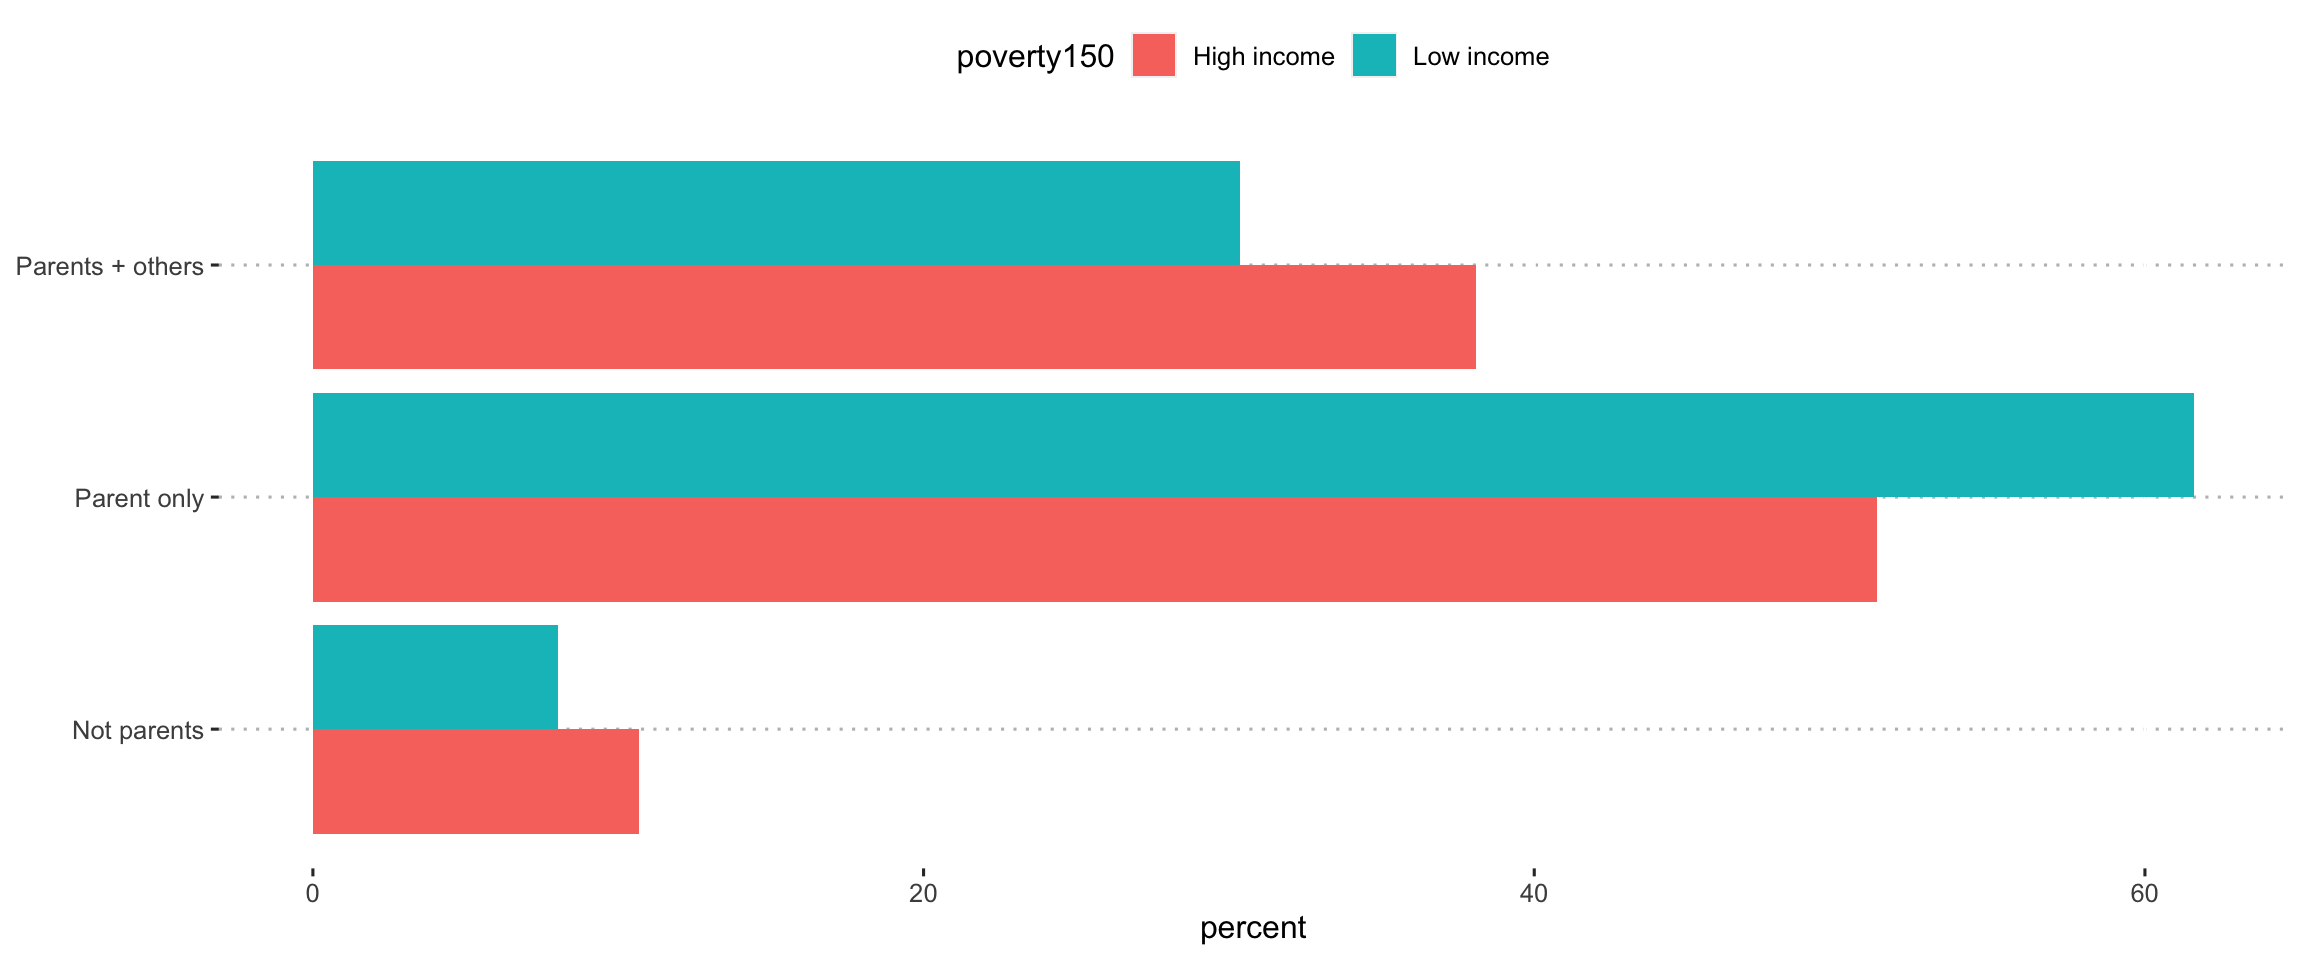
Low Income
The difference between groups is significant.
|
statistic
|
p.value
|
parameter
|
method
|
|
22.91
|
.001
|
6
|
Pearson’s Chi-squared test
|
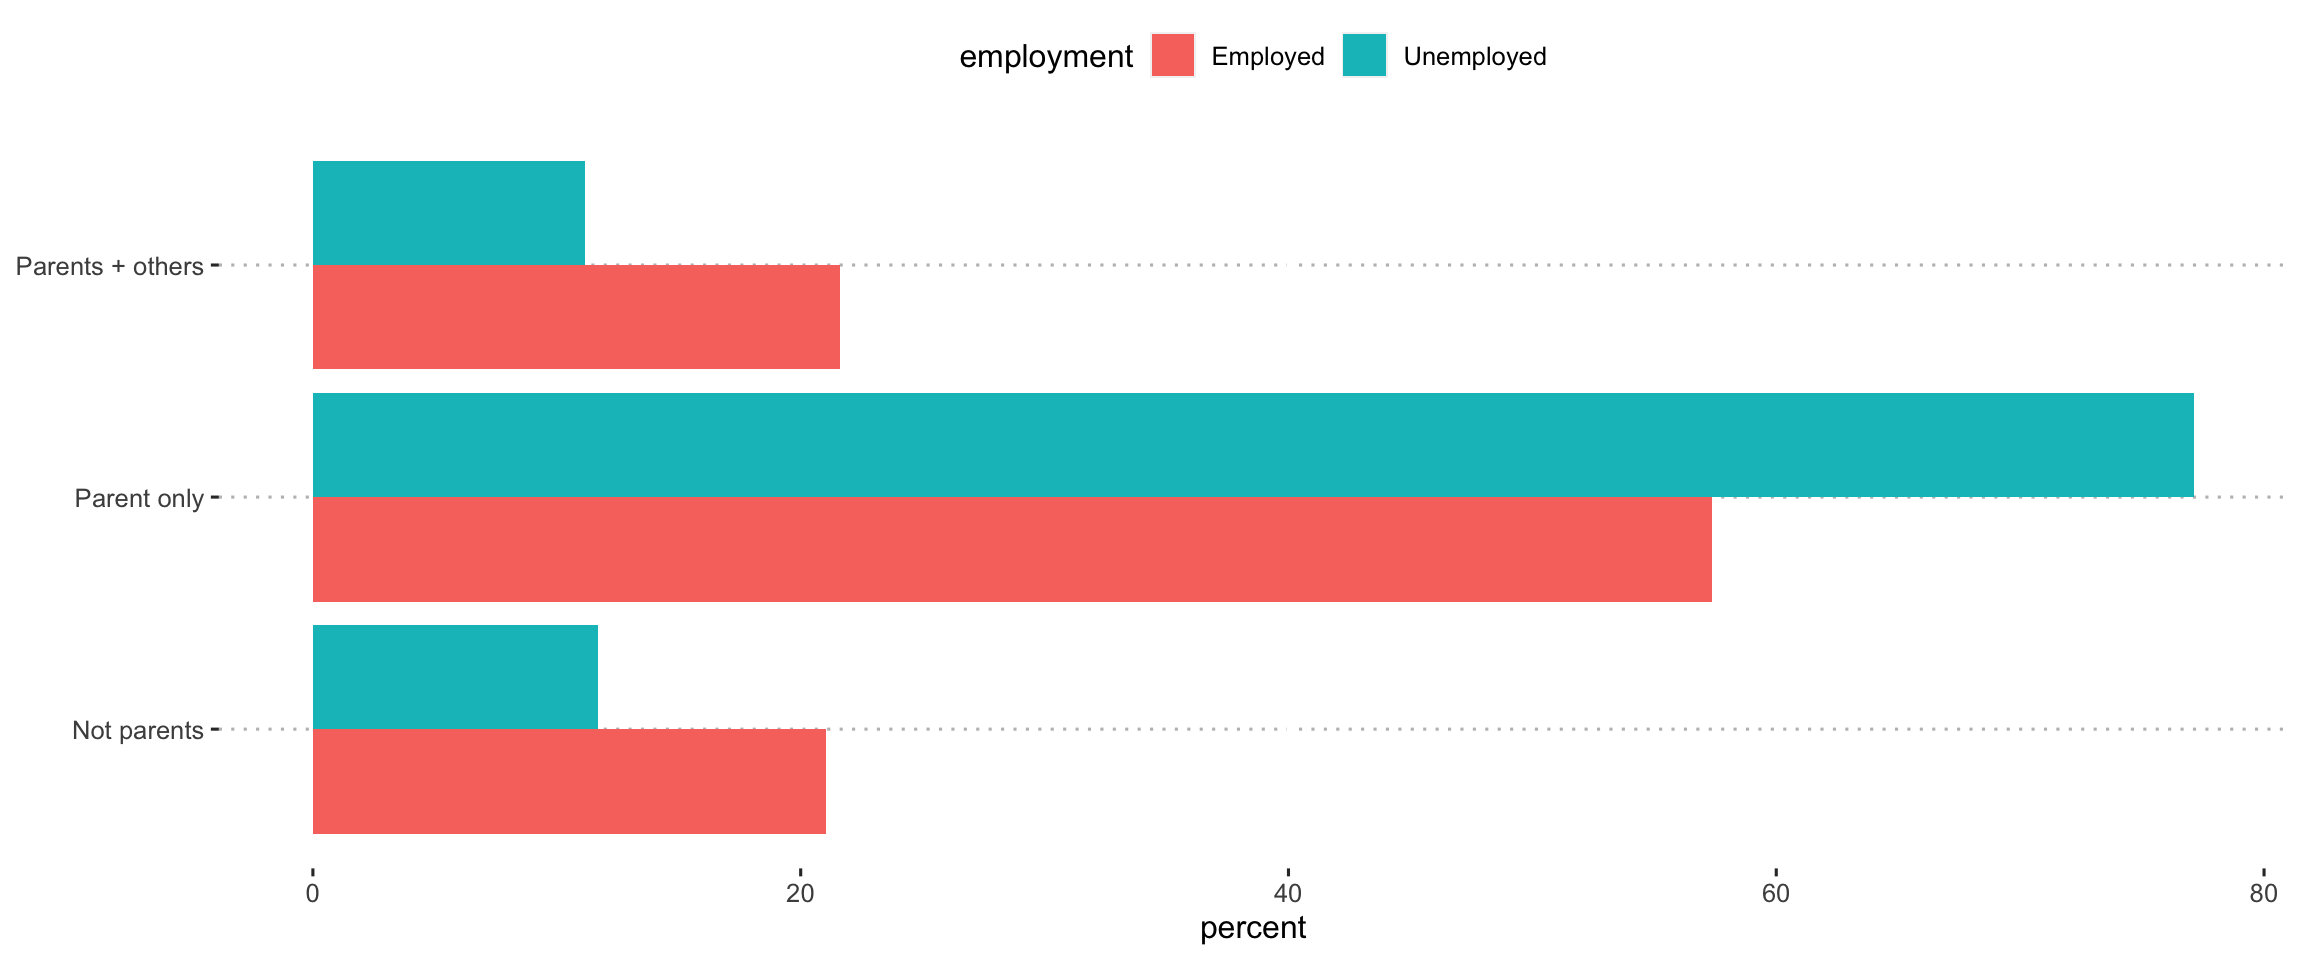
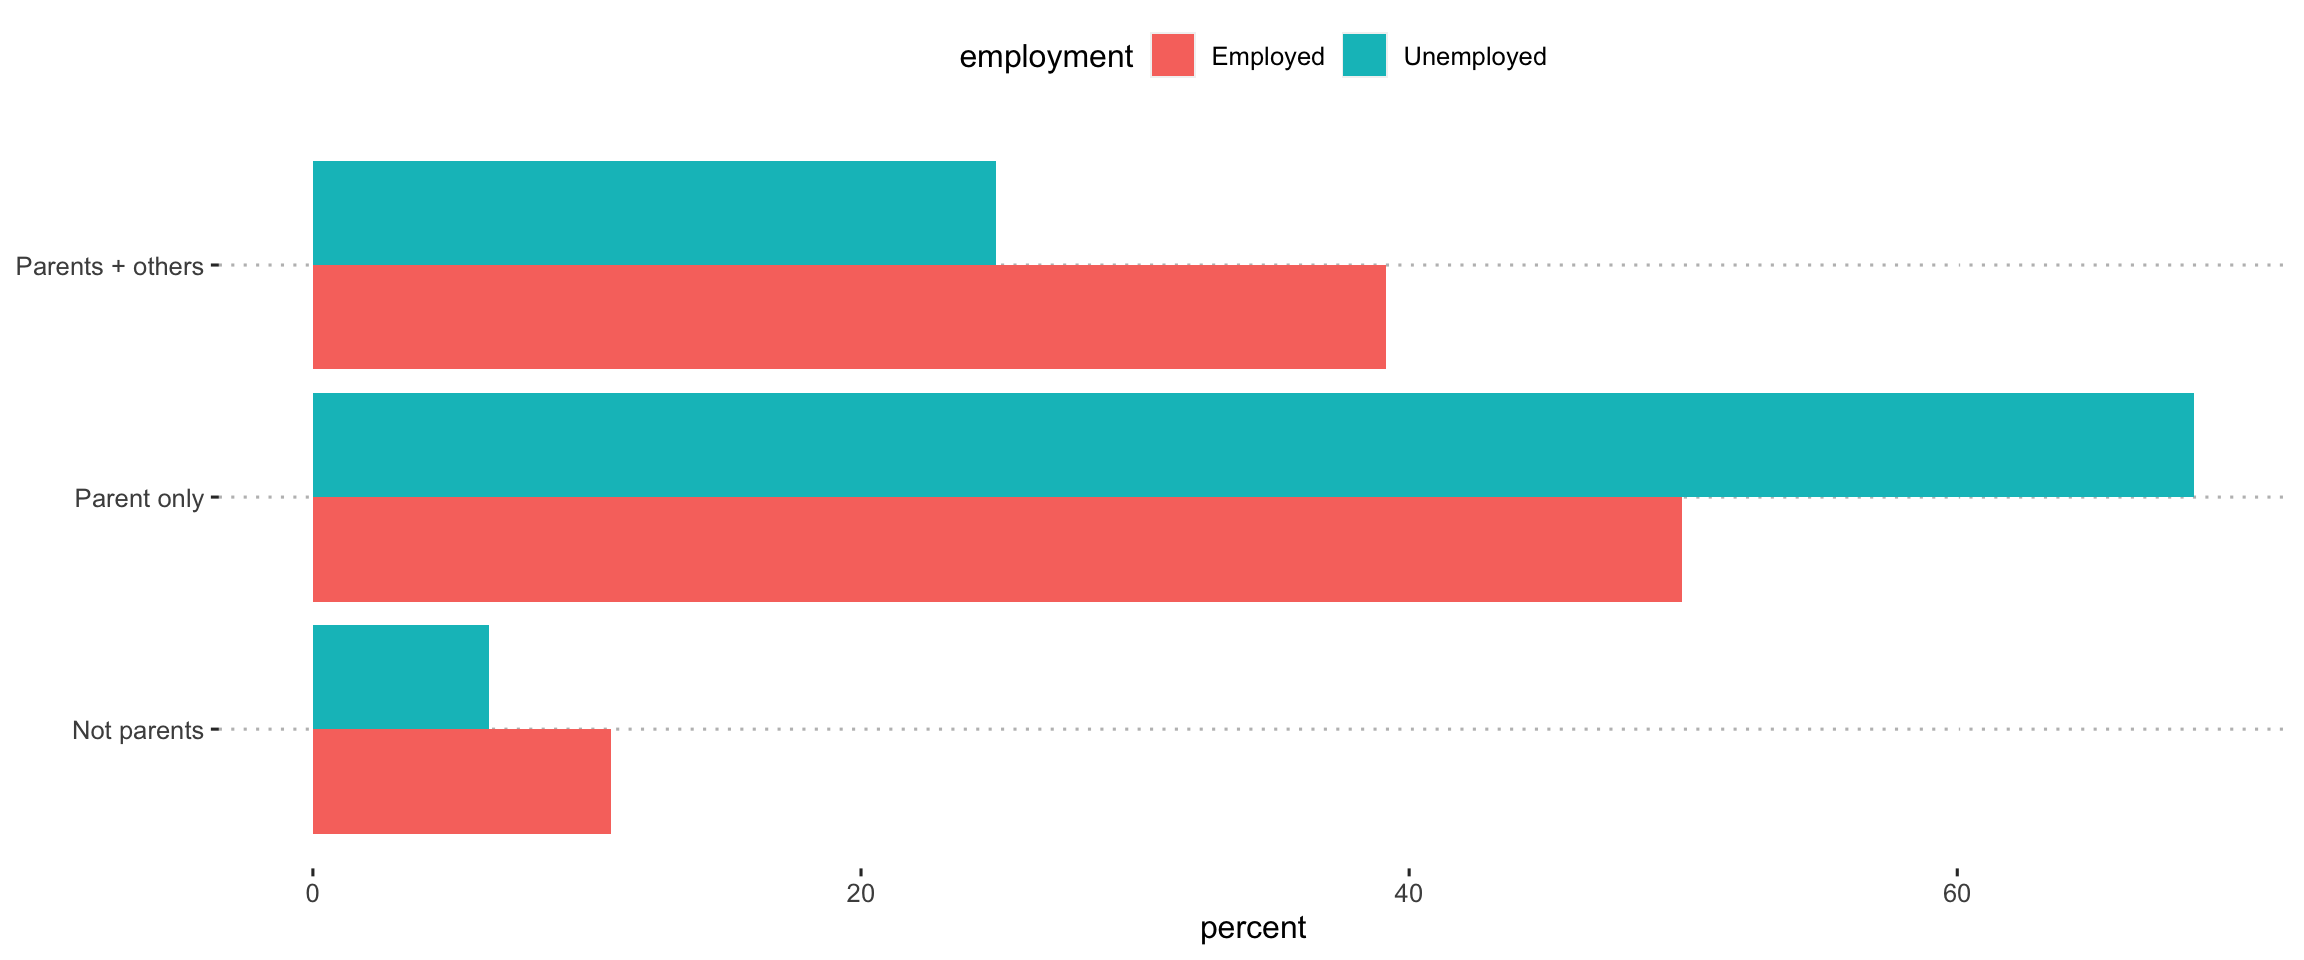
Employment
The difference between groups is not significant.
|
statistic
|
p.value
|
parameter
|
method
|
|
5.09
|
.533
|
6
|
Pearson’s Chi-squared test
|
All groups
A comparison of groups (excluding the average)
|
statistic
|
p.value
|
parameter
|
method
|
|
28.95
|
.049
|
18
|
Pearson’s Chi-squared test
|
Who is managing school?
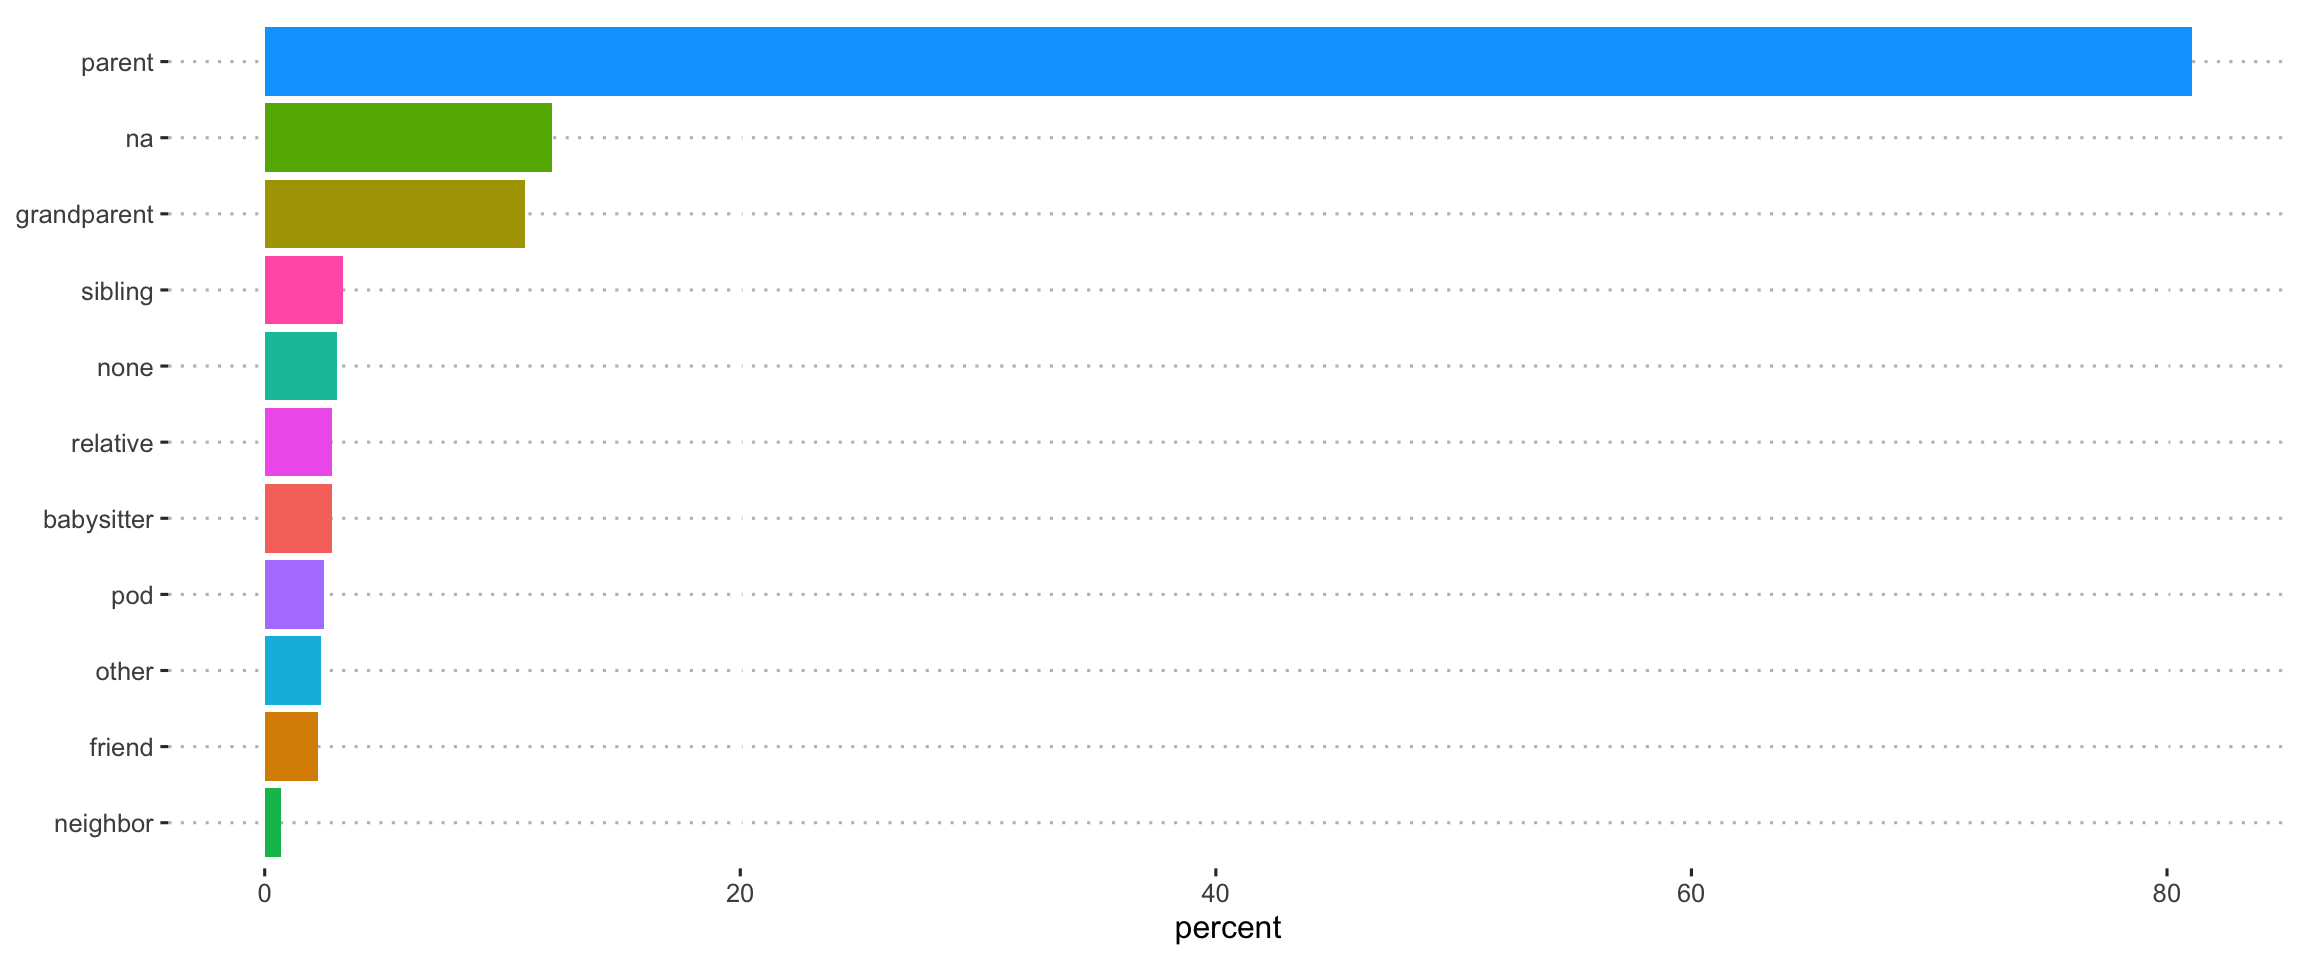
For the time your child will be learning remotely, who will be assisting with your child’s online learning?
Overall
Black
Comparison of responses within person category. p-values have been adjusted using a Holm correction.
|
person
|
estimate
|
estimate1
|
estimate2
|
statistic
|
p.value
|
parameter
|
conf.low
|
conf.high
|
method
|
alternative
|
|
parent
|
0.08
|
0.88
|
0.80
|
2.04
|
.041
|
882
|
0.00
|
0.16
|
Two Sample t-test
|
two.sided
|
|
sibling
|
0.08
|
0.11
|
0.02
|
4.64
|
< .001
|
882
|
0.05
|
0.12
|
Two Sample t-test
|
two.sided
|
|
grandparent
|
0.05
|
0.15
|
0.10
|
1.53
|
.126
|
882
|
-0.01
|
0.11
|
Two Sample t-test
|
two.sided
|
|
relative
|
0.02
|
0.05
|
0.03
|
1.30
|
.195
|
882
|
-0.01
|
0.06
|
Two Sample t-test
|
two.sided
|
|
friend
|
-0.01
|
0.01
|
0.02
|
-0.95
|
.343
|
882
|
-0.05
|
0.02
|
Two Sample t-test
|
two.sided
|
|
neighbor
|
0.01
|
0.02
|
0.01
|
1.65
|
.100
|
882
|
0.00
|
0.03
|
Two Sample t-test
|
two.sided
|
|
pod
|
-0.02
|
0.01
|
0.03
|
-1.06
|
.288
|
882
|
-0.05
|
0.01
|
Two Sample t-test
|
two.sided
|
|
babysitter
|
-0.01
|
0.02
|
0.03
|
-0.59
|
.554
|
882
|
-0.04
|
0.02
|
Two Sample t-test
|
two.sided
|
|
other
|
-0.03
|
0.00
|
0.03
|
-1.69
|
.091
|
882
|
-0.06
|
0.00
|
Two Sample t-test
|
two.sided
|
|
none
|
0.01
|
0.04
|
0.03
|
0.50
|
.618
|
882
|
-0.03
|
0.04
|
Two Sample t-test
|
two.sided
|
|
na
|
-0.13
|
0.01
|
0.14
|
-3.73
|
< .001
|
882
|
-0.19
|
-0.06
|
Two Sample t-test
|
two.sided
|
Comparison of responses within person category after accounting for employment status. p-values have been adjusted using a Holm correction.
|
person
|
estimate
|
std.error
|
statistic
|
p.value
|
|
parent
|
-0.09
|
0.04
|
-2.28
|
.023
|
|
sibling
|
-0.09
|
0.02
|
-4.68
|
< .001
|
|
grandparent
|
-0.04
|
0.03
|
-1.27
|
.204
|
|
relative
|
-0.02
|
0.02
|
-1.31
|
.191
|
|
friend
|
0.01
|
0.02
|
0.94
|
.347
|
|
neighbor
|
-0.01
|
0.01
|
-1.65
|
.098
|
|
pod
|
0.02
|
0.02
|
1.06
|
.288
|
|
babysitter
|
0.01
|
0.02
|
0.59
|
.557
|
|
other
|
0.03
|
0.02
|
1.70
|
.090
|
|
none
|
-0.01
|
0.02
|
-0.51
|
.612
|
|
na
|
0.13
|
0.03
|
3.72
|
< .001
|
LatinX
Comparison of responses within person category. p-values have been adjusted using a Holm correction.
|
person
|
estimate
|
estimate1
|
estimate2
|
statistic
|
p.value
|
parameter
|
conf.low
|
conf.high
|
method
|
alternative
|
|
parent
|
0.02
|
0.83
|
0.81
|
0.73
|
.465
|
883
|
-0.04
|
0.09
|
Two Sample t-test
|
two.sided
|
|
sibling
|
0.03
|
0.05
|
0.03
|
1.74
|
.082
|
883
|
0.00
|
0.06
|
Two Sample t-test
|
two.sided
|
|
grandparent
|
0.02
|
0.13
|
0.11
|
0.80
|
.421
|
883
|
-0.03
|
0.07
|
Two Sample t-test
|
two.sided
|
|
relative
|
0.03
|
0.05
|
0.02
|
2.26
|
.024
|
883
|
0.00
|
0.06
|
Two Sample t-test
|
two.sided
|
|
friend
|
-0.01
|
0.01
|
0.03
|
-1.00
|
.316
|
883
|
-0.04
|
0.01
|
Two Sample t-test
|
two.sided
|
|
neighbor
|
-0.01
|
0.00
|
0.01
|
-1.18
|
.240
|
883
|
-0.02
|
0.01
|
Two Sample t-test
|
two.sided
|
|
pod
|
-0.03
|
0.00
|
0.03
|
-2.28
|
.023
|
883
|
-0.06
|
0.00
|
Two Sample t-test
|
two.sided
|
|
babysitter
|
-0.02
|
0.01
|
0.03
|
-1.39
|
.166
|
883
|
-0.05
|
0.01
|
Two Sample t-test
|
two.sided
|
|
other
|
-0.02
|
0.01
|
0.03
|
-1.65
|
.099
|
883
|
-0.05
|
0.00
|
Two Sample t-test
|
two.sided
|
|
none
|
0.00
|
0.03
|
0.03
|
-0.02
|
.986
|
883
|
-0.03
|
0.03
|
Two Sample t-test
|
two.sided
|
|
na
|
-0.02
|
0.10
|
0.12
|
-0.78
|
.436
|
883
|
-0.08
|
0.03
|
Two Sample t-test
|
two.sided
|
Comparison of responses within person category after accounting for employment status. p-values have been adjusted using a Holm correction.
|
person
|
estimate
|
std.error
|
statistic
|
p.value
|
|
parent
|
-0.02
|
0.03
|
-0.55
|
.583
|
|
sibling
|
-0.03
|
0.02
|
-1.72
|
.086
|
|
grandparent
|
-0.03
|
0.03
|
-1.03
|
.305
|
|
relative
|
-0.03
|
0.01
|
-2.35
|
.019
|
|
friend
|
0.01
|
0.01
|
0.97
|
.331
|
|
neighbor
|
0.01
|
0.01
|
1.11
|
.265
|
|
pod
|
0.03
|
0.01
|
2.19
|
.029
|
|
babysitter
|
0.02
|
0.01
|
1.31
|
.191
|
|
other
|
0.02
|
0.01
|
1.57
|
.118
|
|
none
|
0.00
|
0.01
|
-0.09
|
.925
|
|
na
|
0.02
|
0.03
|
0.73
|
.467
|
Single
Comparison of responses within person category. p-values have been adjusted using a Holm correction.
|
person
|
estimate
|
estimate1
|
estimate2
|
statistic
|
p.value
|
parameter
|
conf.low
|
conf.high
|
method
|
alternative
|
|
parent
|
0.04
|
0.81
|
0.77
|
0.94
|
.347
|
884
|
-0.04
|
0.12
|
Two Sample t-test
|
two.sided
|
|
sibling
|
-0.07
|
0.03
|
0.10
|
-3.69
|
< .001
|
884
|
-0.11
|
-0.03
|
Two Sample t-test
|
two.sided
|
|
grandparent
|
-0.07
|
0.10
|
0.17
|
-2.04
|
.041
|
884
|
-0.14
|
0.00
|
Two Sample t-test
|
two.sided
|
|
relative
|
-0.04
|
0.02
|
0.06
|
-2.24
|
.025
|
884
|
-0.08
|
0.00
|
Two Sample t-test
|
two.sided
|
|
friend
|
-0.02
|
0.02
|
0.04
|
-1.40
|
.161
|
884
|
-0.05
|
0.01
|
Two Sample t-test
|
two.sided
|
|
neighbor
|
0.00
|
0.01
|
0.01
|
-0.49
|
.621
|
884
|
-0.02
|
0.01
|
Two Sample t-test
|
two.sided
|
|
pod
|
0.03
|
0.03
|
0.00
|
1.63
|
.104
|
884
|
-0.01
|
0.06
|
Two Sample t-test
|
two.sided
|
|
babysitter
|
0.02
|
0.03
|
0.01
|
1.07
|
.283
|
884
|
-0.02
|
0.06
|
Two Sample t-test
|
two.sided
|
|
other
|
-0.02
|
0.02
|
0.04
|
-1.29
|
.196
|
884
|
-0.05
|
0.01
|
Two Sample t-test
|
two.sided
|
|
none
|
-0.05
|
0.03
|
0.08
|
-2.66
|
.008
|
884
|
-0.09
|
-0.01
|
Two Sample t-test
|
two.sided
|
|
na
|
0.05
|
0.13
|
0.08
|
1.42
|
.155
|
884
|
-0.02
|
0.12
|
Two Sample t-test
|
two.sided
|
Comparison of responses within person category after accounting for employment status. p-values have been adjusted using a Holm correction.
|
person
|
estimate
|
std.error
|
statistic
|
p.value
|
|
parent
|
-0.04
|
0.04
|
-1.03
|
.301
|
|
sibling
|
0.07
|
0.02
|
3.68
|
< .001
|
|
grandparent
|
0.07
|
0.03
|
2.17
|
.030
|
|
relative
|
0.04
|
0.02
|
2.27
|
.023
|
|
friend
|
0.02
|
0.02
|
1.41
|
.158
|
|
neighbor
|
0.00
|
0.01
|
0.52
|
.603
|
|
pod
|
-0.03
|
0.02
|
-1.59
|
.112
|
|
babysitter
|
-0.02
|
0.02
|
-1.04
|
.297
|
|
other
|
0.02
|
0.02
|
1.33
|
.183
|
|
none
|
0.05
|
0.02
|
2.72
|
.007
|
|
na
|
-0.05
|
0.04
|
-1.40
|
.161
|
Low Income
Comparison of responses within person category. p-values have been adjusted using a Holm correction.
|
person
|
estimate
|
estimate1
|
estimate2
|
statistic
|
p.value
|
parameter
|
conf.low
|
conf.high
|
method
|
alternative
|
|
parent
|
-0.06
|
0.79
|
0.85
|
-2.00
|
.045
|
878
|
-0.11
|
0.00
|
Two Sample t-test
|
two.sided
|
|
sibling
|
-0.03
|
0.02
|
0.05
|
-2.41
|
.016
|
878
|
-0.06
|
-0.01
|
Two Sample t-test
|
two.sided
|
|
grandparent
|
0.00
|
0.11
|
0.11
|
0.03
|
.980
|
878
|
-0.04
|
0.05
|
Two Sample t-test
|
two.sided
|
|
relative
|
0.00
|
0.03
|
0.03
|
-0.21
|
.833
|
878
|
-0.03
|
0.02
|
Two Sample t-test
|
two.sided
|
|
friend
|
0.01
|
0.03
|
0.01
|
1.11
|
.268
|
878
|
-0.01
|
0.03
|
Two Sample t-test
|
two.sided
|
|
neighbor
|
0.01
|
0.01
|
0.00
|
1.66
|
.097
|
878
|
0.00
|
0.02
|
Two Sample t-test
|
two.sided
|
|
pod
|
0.02
|
0.03
|
0.01
|
1.82
|
.070
|
878
|
0.00
|
0.04
|
Two Sample t-test
|
two.sided
|
|
babysitter
|
0.03
|
0.04
|
0.00
|
2.92
|
.004
|
878
|
0.01
|
0.06
|
Two Sample t-test
|
two.sided
|
|
other
|
0.03
|
0.03
|
0.00
|
2.67
|
.008
|
878
|
0.01
|
0.05
|
Two Sample t-test
|
two.sided
|
|
none
|
0.02
|
0.04
|
0.02
|
1.46
|
.144
|
878
|
-0.01
|
0.04
|
Two Sample t-test
|
two.sided
|
|
na
|
0.02
|
0.12
|
0.11
|
0.66
|
.512
|
878
|
-0.03
|
0.06
|
Two Sample t-test
|
two.sided
|
Comparison of responses within person category after accounting for employment status. p-values have been adjusted using a Holm correction.
|
person
|
estimate
|
std.error
|
statistic
|
p.value
|
|
parent
|
0.04
|
0.03
|
1.58
|
.116
|
|
sibling
|
0.03
|
0.01
|
2.37
|
.018
|
|
grandparent
|
0.01
|
0.02
|
0.46
|
.643
|
|
relative
|
0.00
|
0.01
|
0.41
|
.680
|
|
friend
|
-0.01
|
0.01
|
-1.03
|
.303
|
|
neighbor
|
-0.01
|
0.01
|
-1.51
|
.131
|
|
pod
|
-0.02
|
0.01
|
-1.58
|
.114
|
|
babysitter
|
-0.03
|
0.01
|
-2.68
|
.007
|
|
other
|
-0.03
|
0.01
|
-2.45
|
.014
|
|
none
|
-0.01
|
0.01
|
-1.18
|
.236
|
|
na
|
-0.01
|
0.02
|
-0.53
|
.596
|
All groups
A comparison of groups using ANOVA (excluding the average)
|
person
|
term
|
df
|
sumsq
|
meansq
|
statistic
|
p.value
|
|
parent
|
group
|
3
|
0.66
|
0.22
|
1.64
|
.178
|
|
sibling
|
group
|
3
|
0.31
|
0.10
|
1.59
|
.190
|
|
grandparent
|
group
|
3
|
0.35
|
0.12
|
1.03
|
.379
|
|
relative
|
group
|
3
|
0.12
|
0.04
|
0.96
|
.410
|
|
friend
|
group
|
3
|
0.07
|
0.02
|
1.46
|
.224
|
|
neighbor
|
group
|
3
|
0.04
|
0.01
|
2.51
|
.057
|
|
pod
|
group
|
3
|
0.02
|
0.01
|
0.92
|
.433
|
|
babysitter
|
group
|
3
|
0.02
|
0.01
|
0.74
|
.530
|
|
other
|
group
|
3
|
0.13
|
0.04
|
4.55
|
.004
|
|
none
|
group
|
3
|
0.23
|
0.08
|
2.44
|
.064
|
|
na
|
group
|
3
|
0.81
|
0.27
|
3.45
|
.016
|
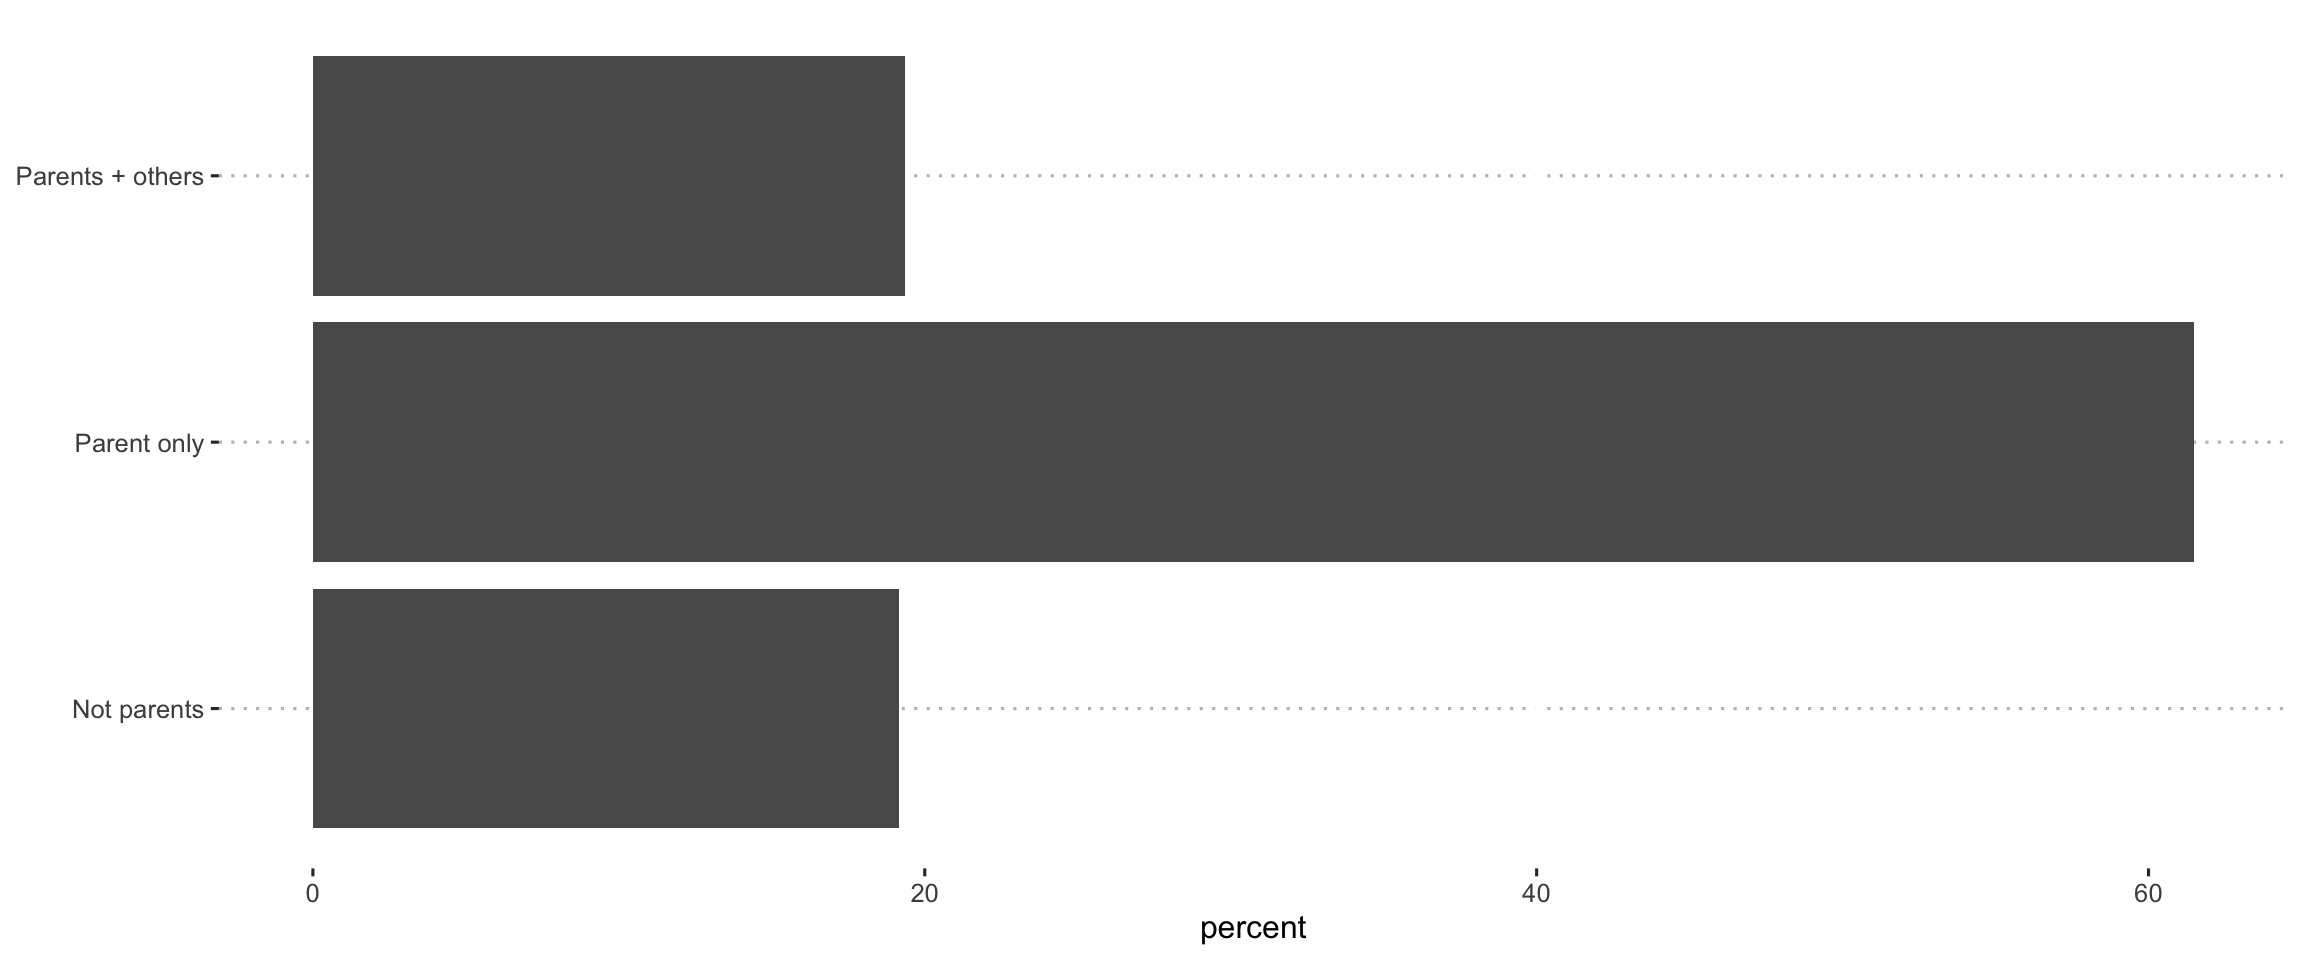
Parents only managing school
Overall
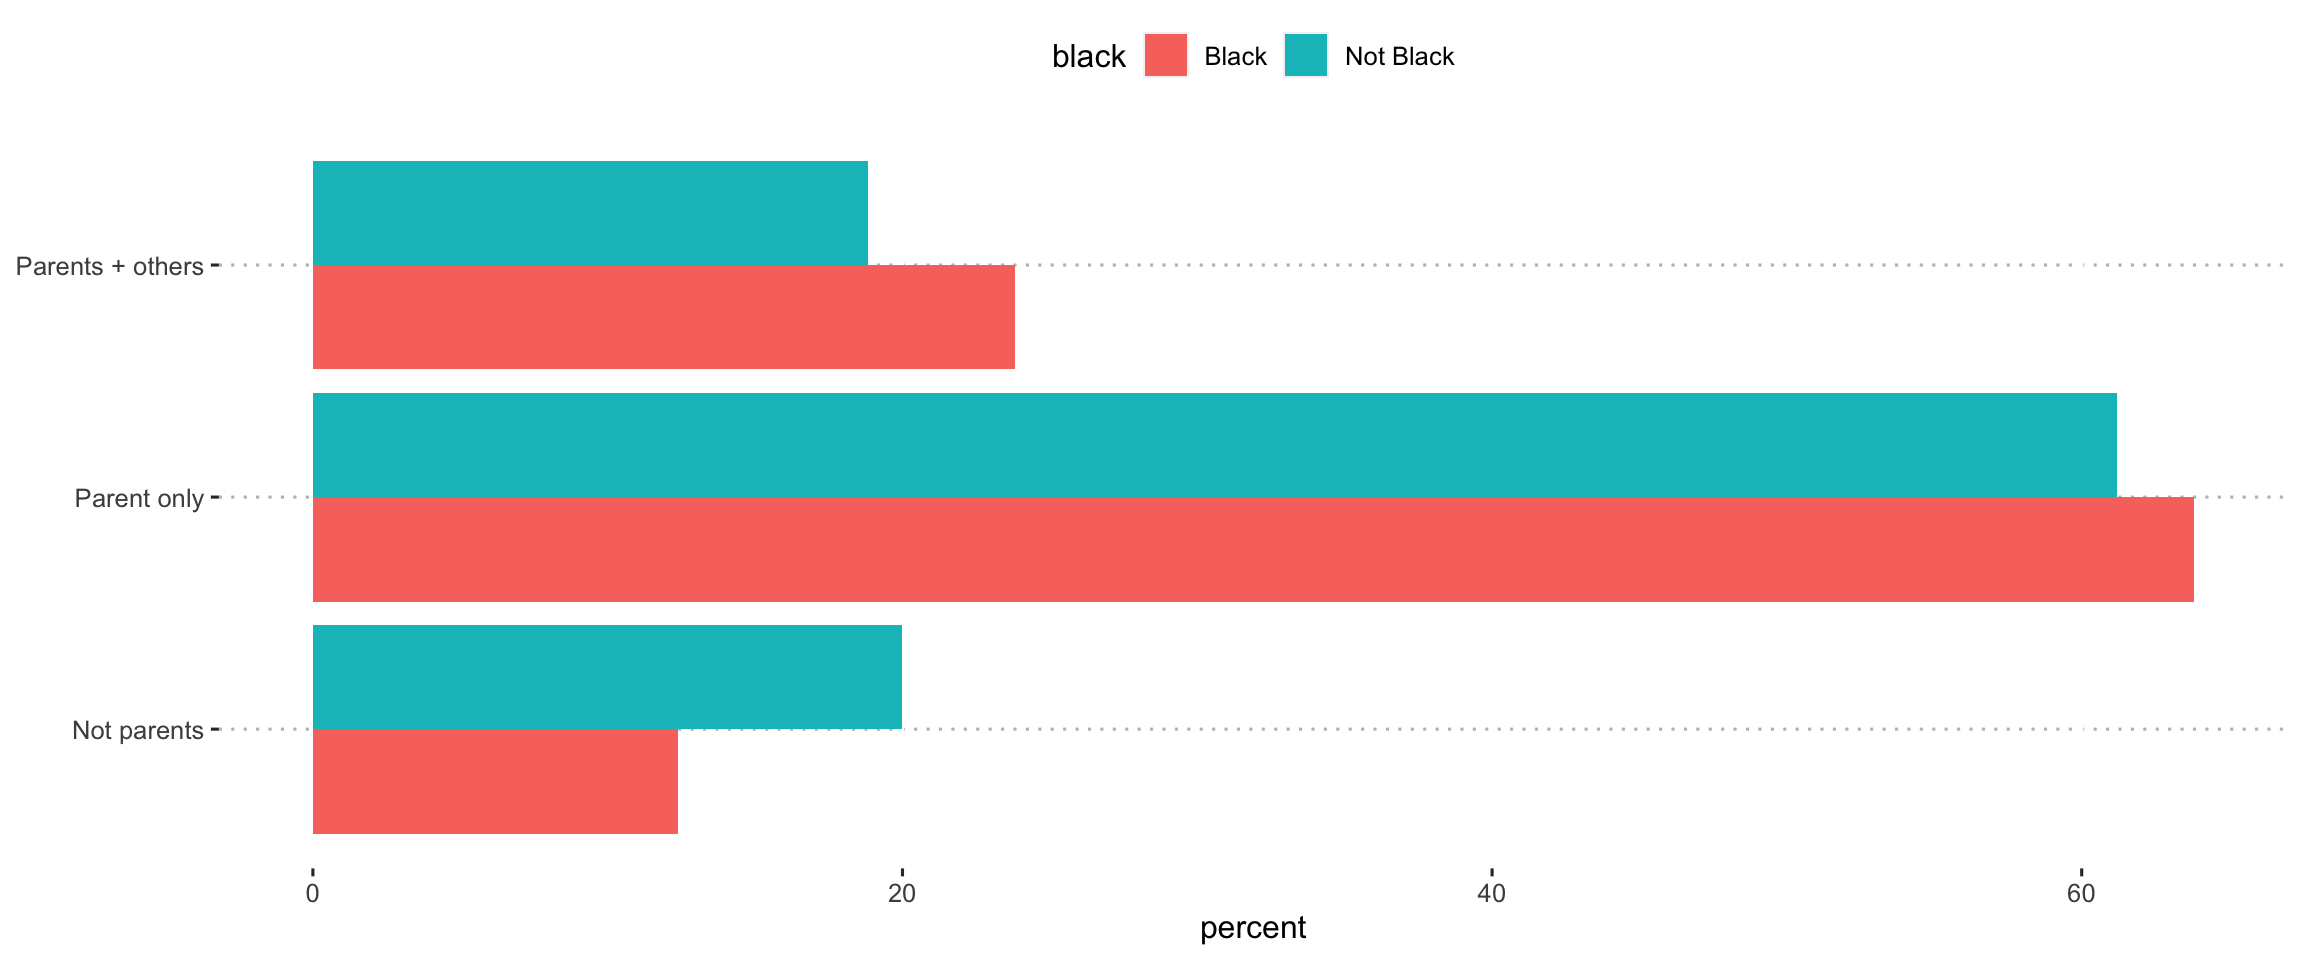
Black
LatinX
Single
Low Income
Employment
Pre-K Learning
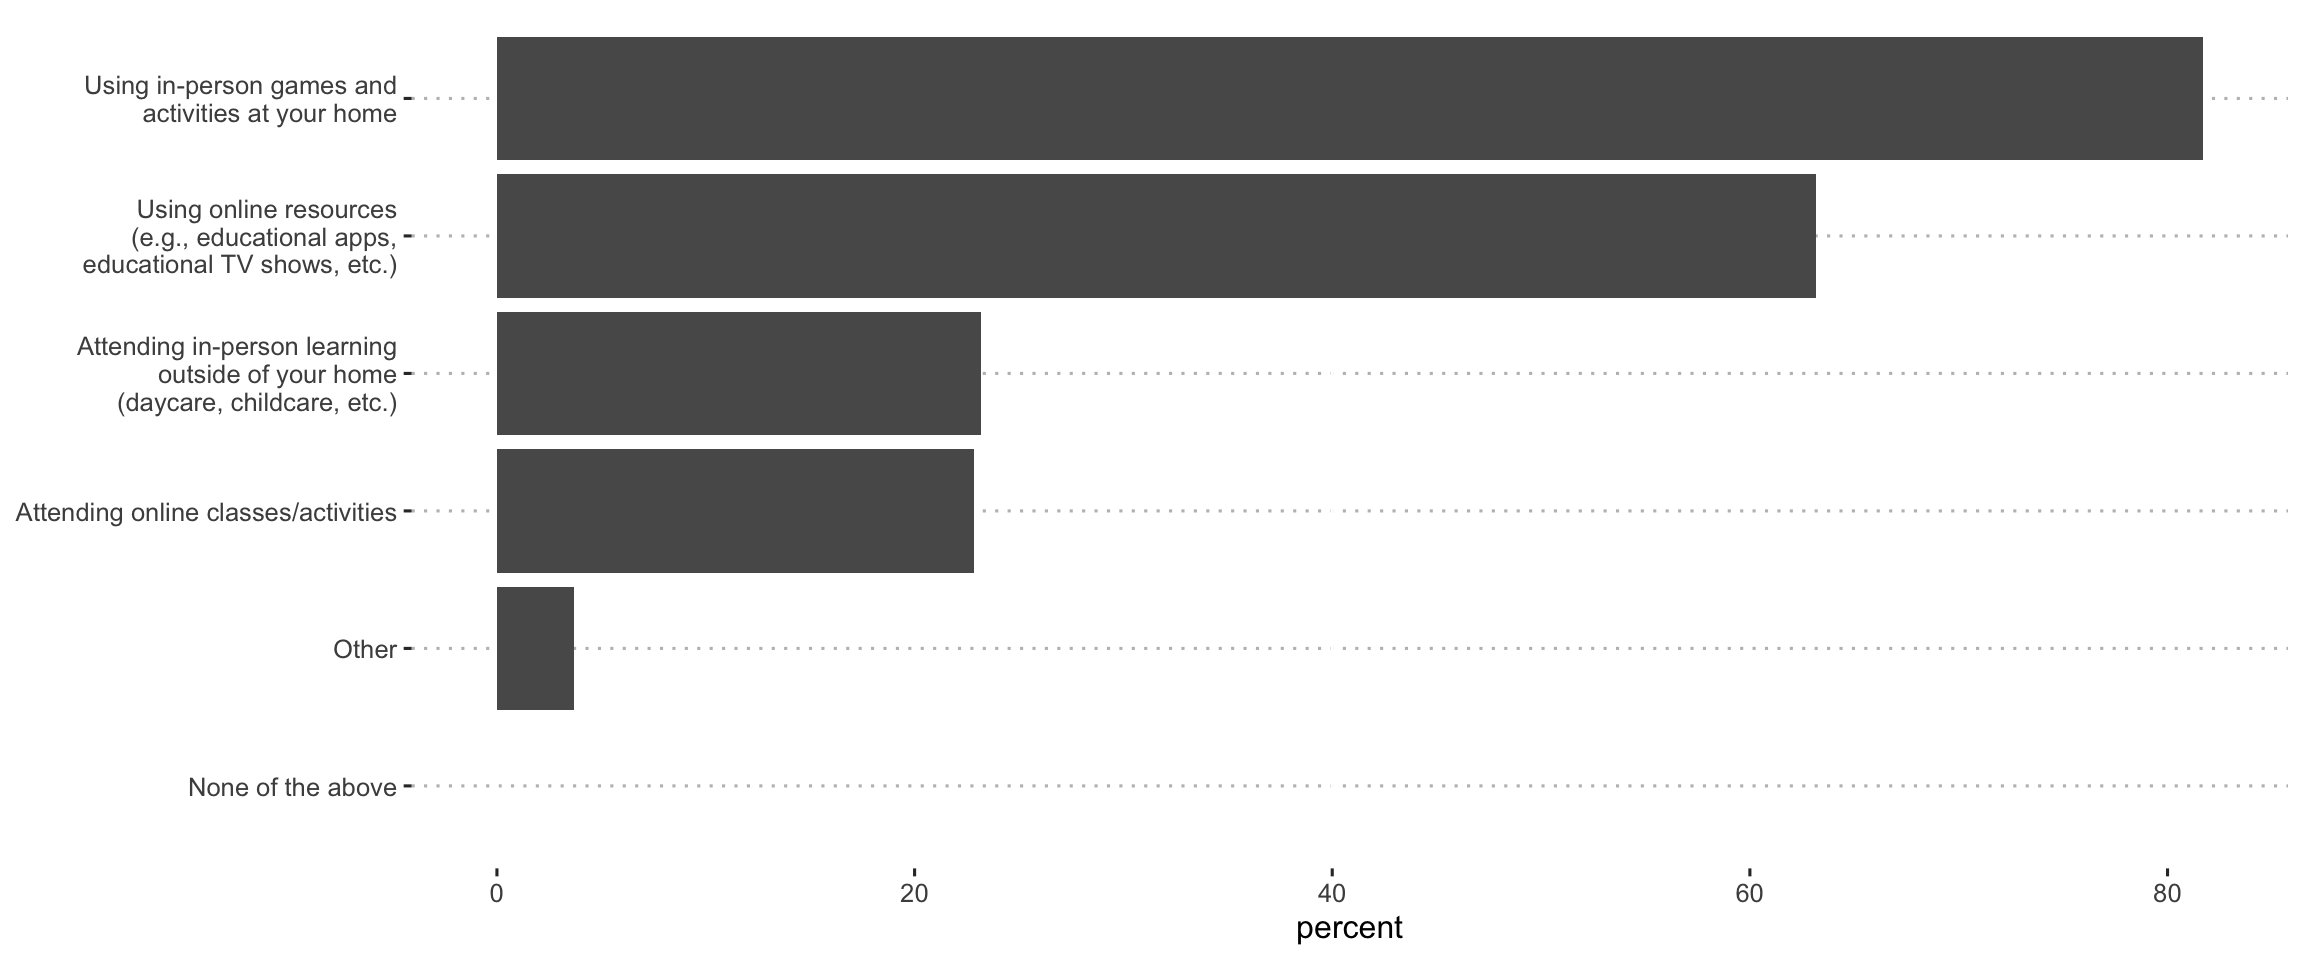
How
For your child(ren) between the ages of 0-5, which of the following are you doing to support their learning?
Overall
Black
Comparison of responses within learning category. p-values have been adjusted using a Holm correction.
|
learning
|
estimate
|
estimate1
|
estimate2
|
statistic
|
p.value
|
parameter
|
conf.low
|
conf.high
|
method
|
alternative
|
|
games
|
-0.12
|
0.71
|
0.83
|
-4.40
|
< .001
|
1940
|
-0.18
|
-0.07
|
Two Sample t-test
|
two.sided
|
|
inperson
|
0.00
|
0.23
|
0.23
|
-0.01
|
.990
|
1940
|
-0.06
|
0.06
|
Two Sample t-test
|
two.sided
|
|
apps
|
0.08
|
0.71
|
0.62
|
2.31
|
.021
|
1940
|
0.01
|
0.15
|
Two Sample t-test
|
two.sided
|
|
online
|
0.08
|
0.30
|
0.22
|
2.57
|
.010
|
1940
|
0.02
|
0.14
|
Two Sample t-test
|
two.sided
|
|
other
|
0.01
|
0.04
|
0.04
|
0.52
|
.606
|
1940
|
-0.02
|
0.03
|
Two Sample t-test
|
two.sided
|
Comparison of responses within learning category after controlling for employment status. p-values have been adjusted using a Holm correction.
|
learning
|
estimate
|
std.error
|
statistic
|
p.value
|
|
games
|
0.13
|
0.03
|
4.45
|
< .001
|
|
inperson
|
0.00
|
0.03
|
-0.07
|
.945
|
|
apps
|
-0.08
|
0.04
|
-2.26
|
.024
|
|
online
|
-0.08
|
0.03
|
-2.44
|
.015
|
|
other
|
-0.01
|
0.01
|
-0.53
|
.598
|
LatinX
Comparison of responses within learning category. p-values have been adjusted using a Holm correction.
|
learning
|
estimate
|
estimate1
|
estimate2
|
statistic
|
p.value
|
parameter
|
conf.low
|
conf.high
|
method
|
alternative
|
|
games
|
-0.03
|
0.79
|
0.82
|
-1.41
|
.158
|
1940
|
-0.08
|
0.01
|
Two Sample t-test
|
two.sided
|
|
inperson
|
-0.12
|
0.13
|
0.25
|
-4.34
|
< .001
|
1940
|
-0.17
|
-0.06
|
Two Sample t-test
|
two.sided
|
|
apps
|
-0.01
|
0.62
|
0.63
|
-0.46
|
.645
|
1940
|
-0.07
|
0.05
|
Two Sample t-test
|
two.sided
|
|
online
|
0.10
|
0.31
|
0.21
|
3.57
|
< .001
|
1940
|
0.04
|
0.15
|
Two Sample t-test
|
two.sided
|
|
other
|
0.00
|
0.03
|
0.04
|
-0.22
|
.828
|
1940
|
-0.03
|
0.02
|
Two Sample t-test
|
two.sided
|
Comparison of responses within learning category after controlling for employment status. p-values have been adjusted using a Holm correction.
|
learning
|
estimate
|
std.error
|
statistic
|
p.value
|
|
games
|
0.04
|
0.02
|
1.44
|
.151
|
|
inperson
|
0.11
|
0.03
|
4.11
|
< .001
|
|
apps
|
0.01
|
0.03
|
0.44
|
.659
|
|
online
|
-0.09
|
0.03
|
-3.51
|
< .001
|
|
other
|
0.00
|
0.01
|
0.23
|
.820
|
Single
Comparison of responses within learning category. p-values have been adjusted using a Holm correction.
|
learning
|
estimate
|
estimate1
|
estimate2
|
statistic
|
p.value
|
parameter
|
conf.low
|
conf.high
|
method
|
alternative
|
|
games
|
0.07
|
0.82
|
0.75
|
2.32
|
.020
|
1942
|
0.01
|
0.13
|
Two Sample t-test
|
two.sided
|
|
inperson
|
0.03
|
0.23
|
0.20
|
0.99
|
.324
|
1942
|
-0.03
|
0.10
|
Two Sample t-test
|
two.sided
|
|
apps
|
-0.07
|
0.63
|
0.69
|
-1.72
|
.085
|
1942
|
-0.14
|
0.01
|
Two Sample t-test
|
two.sided
|
|
online
|
-0.05
|
0.22
|
0.27
|
-1.38
|
.169
|
1942
|
-0.11
|
0.02
|
Two Sample t-test
|
two.sided
|
|
other
|
0.01
|
0.04
|
0.03
|
0.66
|
.507
|
1942
|
-0.02
|
0.04
|
Two Sample t-test
|
two.sided
|
Comparison of responses within learning category after controlling for employment status. p-values have been adjusted using a Holm correction.
|
learning
|
estimate
|
std.error
|
statistic
|
p.value
|
|
games
|
-0.07
|
0.03
|
-2.34
|
.019
|
|
inperson
|
-0.03
|
0.03
|
-0.77
|
.442
|
|
apps
|
0.07
|
0.04
|
1.74
|
.082
|
|
online
|
0.04
|
0.03
|
1.31
|
.189
|
|
other
|
-0.01
|
0.01
|
-0.67
|
.501
|
Low Income
Comparison of responses within learning category. p-values have been adjusted using a Holm correction.
|
learning
|
estimate
|
estimate1
|
estimate2
|
statistic
|
p.value
|
parameter
|
conf.low
|
conf.high
|
method
|
alternative
|
|
games
|
0.03
|
0.82
|
0.79
|
1.38
|
.169
|
1925
|
-0.01
|
0.07
|
Two Sample t-test
|
two.sided
|
|
inperson
|
0.15
|
0.27
|
0.12
|
6.76
|
< .001
|
1925
|
0.11
|
0.20
|
Two Sample t-test
|
two.sided
|
|
apps
|
-0.05
|
0.62
|
0.67
|
-2.02
|
.044
|
1925
|
-0.10
|
0.00
|
Two Sample t-test
|
two.sided
|
|
online
|
-0.03
|
0.22
|
0.26
|
-1.44
|
.150
|
1925
|
-0.08
|
0.01
|
Two Sample t-test
|
two.sided
|
|
other
|
-0.01
|
0.04
|
0.04
|
-0.94
|
.348
|
1925
|
-0.03
|
0.01
|
Two Sample t-test
|
two.sided
|
Comparison of responses within learning category after controlling for employment status. p-values have been adjusted using a Holm correction.
|
learning
|
estimate
|
std.error
|
statistic
|
p.value
|
|
games
|
-0.03
|
0.02
|
-1.46
|
.144
|
|
inperson
|
-0.14
|
0.02
|
-6.08
|
< .001
|
|
apps
|
0.06
|
0.03
|
2.10
|
.036
|
|
online
|
0.03
|
0.02
|
1.21
|
.228
|
|
other
|
0.01
|
0.01
|
0.92
|
.359
|
Employment
Comparison of responses within learning category. p-values have been adjusted using a Holm correction.
|
learning
|
estimate
|
estimate1
|
estimate2
|
statistic
|
p.value
|
parameter
|
conf.low
|
conf.high
|
method
|
alternative
|
|
games
|
-0.01
|
0.81
|
0.83
|
-0.60
|
.549
|
1941
|
-0.06
|
0.03
|
Two Sample t-test
|
two.sided
|
|
inperson
|
0.13
|
0.26
|
0.13
|
5.42
|
< .001
|
1941
|
0.08
|
0.18
|
Two Sample t-test
|
two.sided
|
|
apps
|
0.01
|
0.63
|
0.63
|
0.24
|
.812
|
1941
|
-0.05
|
0.06
|
Two Sample t-test
|
two.sided
|
|
online
|
-0.04
|
0.22
|
0.26
|
-1.83
|
.067
|
1941
|
-0.09
|
0.00
|
Two Sample t-test
|
two.sided
|
|
other
|
0.00
|
0.04
|
0.04
|
-0.19
|
.852
|
1941
|
-0.02
|
0.02
|
Two Sample t-test
|
two.sided
|
NULL
All groups
A comparison of groups using ANOVA (excluding the average)
|
person
|
term
|
df
|
sumsq
|
meansq
|
statistic
|
p.value
|
|
games
|
group
|
3
|
1.27
|
0.42
|
2.39
|
.067
|
|
inperson
|
group
|
3
|
2.44
|
0.81
|
6.26
|
< .001
|
|
apps
|
group
|
3
|
1.05
|
0.35
|
1.58
|
.192
|
|
online
|
group
|
3
|
0.64
|
0.21
|
1.05
|
.369
|
|
other
|
group
|
3
|
0.04
|
0.01
|
0.40
|
.756
|
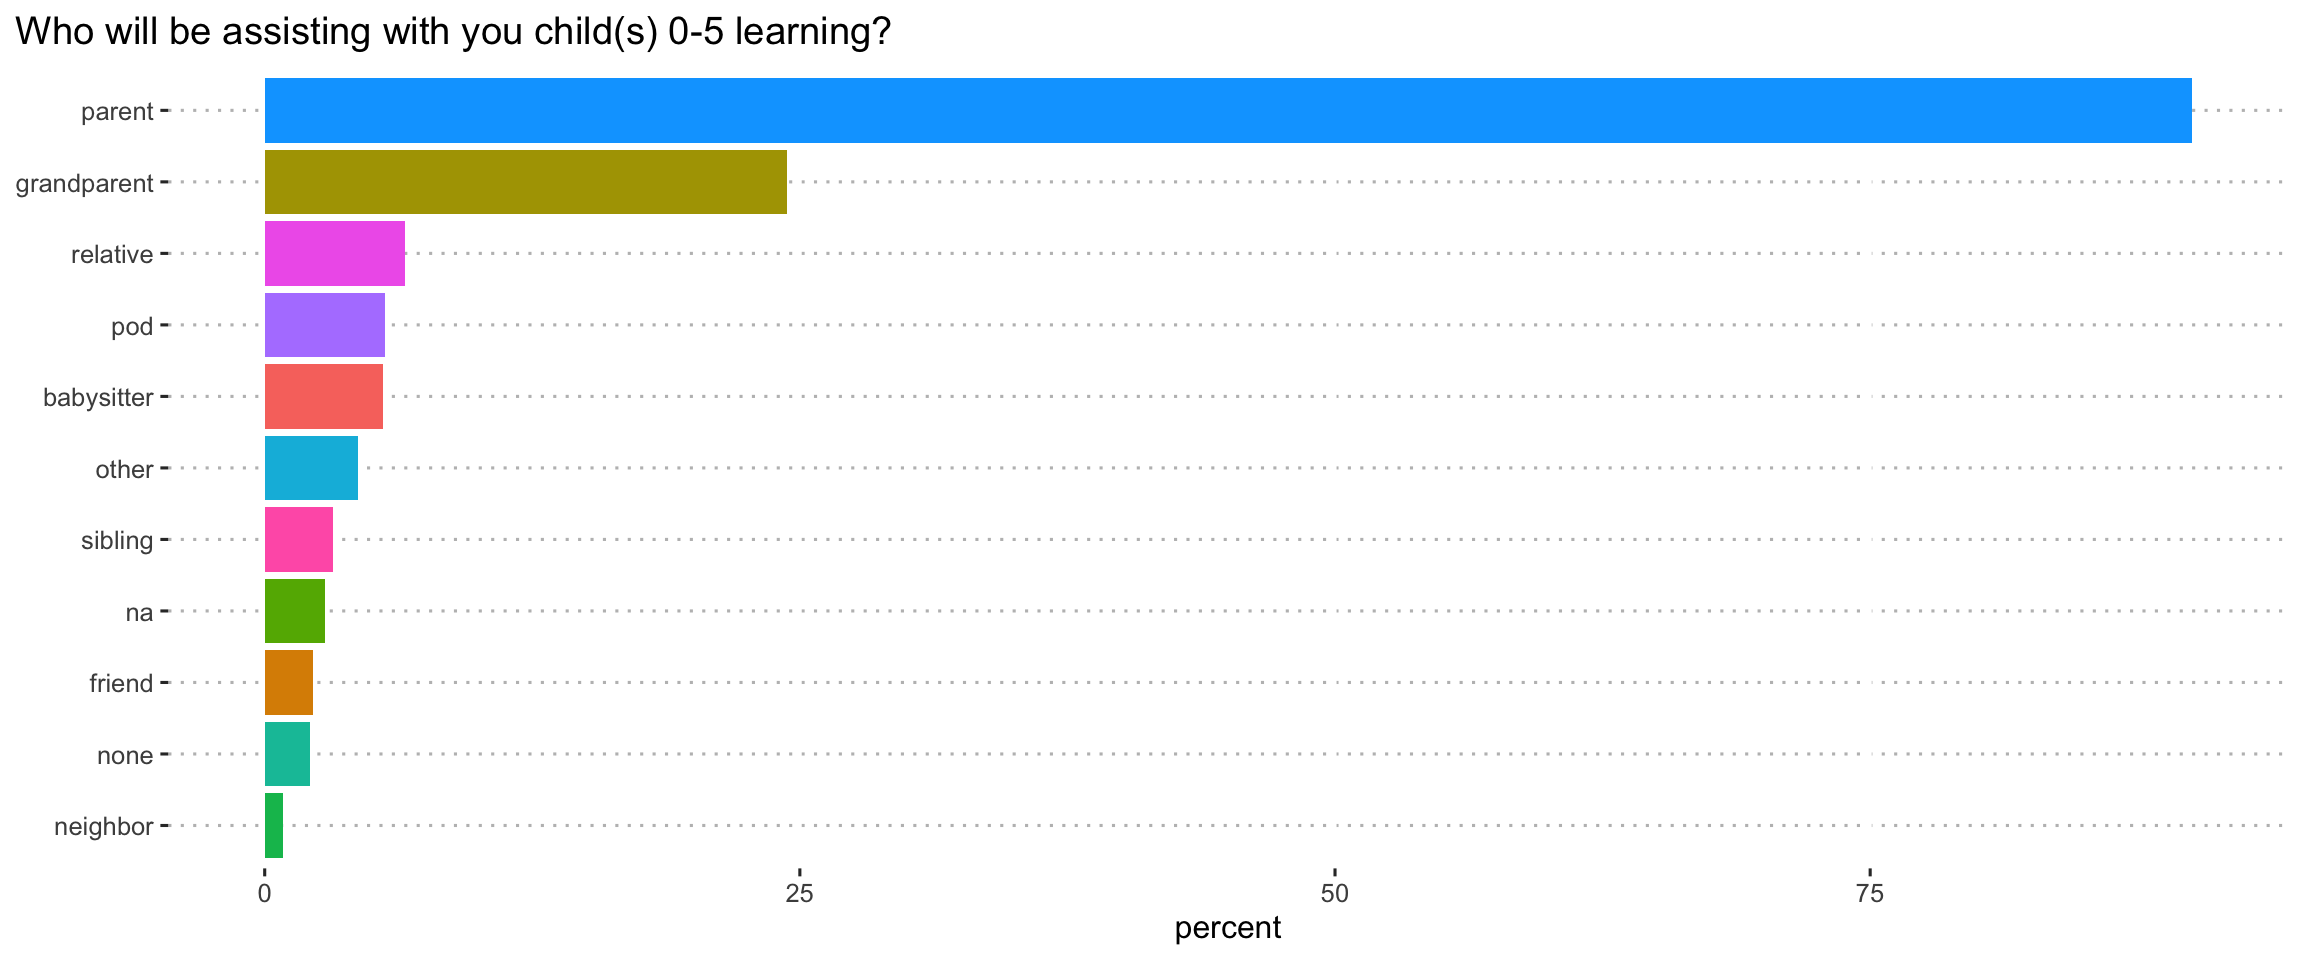
Who
Who will be assisting with you child(s) 0-5 learning?
Overall
Black
Comparison of responses within learning category. p-values have been adjusted using a Holm correction.
|
learning
|
estimate
|
estimate1
|
estimate2
|
statistic
|
p.value
|
parameter
|
conf.low
|
conf.high
|
method
|
alternative
|
|
parent
|
-0.06
|
0.85
|
0.91
|
-2.50
|
.012
|
1940
|
-0.10
|
-0.01
|
Two Sample t-test
|
two.sided
|
|
sibling
|
0.06
|
0.08
|
0.03
|
4.42
|
< .001
|
1940
|
0.03
|
0.08
|
Two Sample t-test
|
two.sided
|
|
grandparent
|
0.00
|
0.24
|
0.24
|
-0.13
|
.896
|
1940
|
-0.07
|
0.06
|
Two Sample t-test
|
two.sided
|
|
relative
|
0.03
|
0.09
|
0.06
|
1.60
|
.109
|
1940
|
-0.01
|
0.06
|
Two Sample t-test
|
two.sided
|
|
friend
|
-0.01
|
0.01
|
0.02
|
-0.95
|
.343
|
882
|
-0.05
|
0.02
|
Two Sample t-test
|
two.sided
|
|
neighbor
|
0.01
|
0.01
|
0.01
|
0.93
|
.353
|
1940
|
-0.01
|
0.02
|
Two Sample t-test
|
two.sided
|
|
pod
|
0.00
|
0.05
|
0.06
|
-0.21
|
.830
|
1940
|
-0.04
|
0.03
|
Two Sample t-test
|
two.sided
|
|
babysitter
|
0.00
|
0.05
|
0.06
|
-0.15
|
.882
|
1940
|
-0.04
|
0.03
|
Two Sample t-test
|
two.sided
|
|
other
|
-0.01
|
0.03
|
0.04
|
-0.75
|
.451
|
1940
|
-0.04
|
0.02
|
Two Sample t-test
|
two.sided
|
|
none
|
0.02
|
0.04
|
0.02
|
1.84
|
.066
|
1940
|
0.00
|
0.04
|
Two Sample t-test
|
two.sided
|
|
na
|
-0.01
|
0.02
|
0.03
|
-0.84
|
.403
|
1940
|
-0.03
|
0.01
|
Two Sample t-test
|
two.sided
|
Comparison of responses within learning category after accounting for employment status. p-values have been adjusted using a Holm correction.
|
learning
|
estimate
|
std.error
|
statistic
|
p.value
|
|
parent
|
0.06
|
0.02
|
2.50
|
.012
|
|
sibling
|
-0.06
|
0.01
|
-4.42
|
< .001
|
|
grandparent
|
0.00
|
0.03
|
0.13
|
.896
|
|
relative
|
-0.03
|
0.02
|
-1.60
|
.109
|
|
friend
|
0.01
|
0.02
|
0.95
|
.343
|
|
neighbor
|
-0.01
|
0.01
|
-0.93
|
.353
|
|
pod
|
0.00
|
0.02
|
0.21
|
.830
|
|
babysitter
|
0.00
|
0.02
|
0.15
|
.882
|
|
other
|
0.01
|
0.02
|
0.75
|
.451
|
|
none
|
-0.02
|
0.01
|
-1.84
|
.066
|
|
na
|
0.01
|
0.01
|
0.84
|
.403
|
LatinX
Comparison of responses within learning category. p-values have been adjusted using a Holm correction.
|
learning
|
estimate
|
estimate1
|
estimate2
|
statistic
|
p.value
|
parameter
|
conf.low
|
conf.high
|
method
|
alternative
|
|
parent
|
0.02
|
0.92
|
0.90
|
1.21
|
.227
|
1940
|
-0.01
|
0.06
|
Two Sample t-test
|
two.sided
|
|
sibling
|
0.03
|
0.06
|
0.03
|
2.86
|
.004
|
1940
|
0.01
|
0.05
|
Two Sample t-test
|
two.sided
|
|
grandparent
|
-0.02
|
0.23
|
0.25
|
-0.60
|
.547
|
1940
|
-0.07
|
0.04
|
Two Sample t-test
|
two.sided
|
|
relative
|
-0.01
|
0.06
|
0.07
|
-0.46
|
.648
|
1940
|
-0.04
|
0.02
|
Two Sample t-test
|
two.sided
|
|
friend
|
-0.01
|
0.01
|
0.03
|
-1.00
|
.316
|
883
|
-0.04
|
0.01
|
Two Sample t-test
|
two.sided
|
|
neighbor
|
-0.01
|
0.00
|
0.01
|
-1.04
|
.299
|
1940
|
-0.02
|
0.01
|
Two Sample t-test
|
two.sided
|
|
pod
|
-0.02
|
0.04
|
0.06
|
-1.14
|
.254
|
1940
|
-0.05
|
0.01
|
Two Sample t-test
|
two.sided
|
|
babysitter
|
-0.02
|
0.04
|
0.06
|
-1.31
|
.189
|
1940
|
-0.05
|
0.01
|
Two Sample t-test
|
two.sided
|
|
other
|
-0.03
|
0.02
|
0.05
|
-2.05
|
.040
|
1940
|
-0.05
|
0.00
|
Two Sample t-test
|
two.sided
|
|
none
|
0.00
|
0.02
|
0.02
|
-0.47
|
.638
|
1940
|
-0.02
|
0.01
|
Two Sample t-test
|
two.sided
|
|
na
|
-0.01
|
0.02
|
0.03
|
-0.82
|
.412
|
1940
|
-0.03
|
0.01
|
Two Sample t-test
|
two.sided
|
Comparison of responses within learning category after accounting for employment status. p-values have been adjusted using a Holm correction.
|
learning
|
estimate
|
std.error
|
statistic
|
p.value
|
|
parent
|
-0.02
|
0.02
|
-1.21
|
.227
|
|
sibling
|
-0.03
|
0.01
|
-2.86
|
.004
|
|
grandparent
|
0.02
|
0.03
|
0.60
|
.547
|
|
relative
|
0.01
|
0.02
|
0.46
|
.648
|
|
friend
|
0.01
|
0.01
|
1.00
|
.316
|
|
neighbor
|
0.01
|
0.01
|
1.04
|
.299
|
|
pod
|
0.02
|
0.01
|
1.14
|
.254
|
|
babysitter
|
0.02
|
0.01
|
1.31
|
.189
|
|
other
|
0.03
|
0.01
|
2.05
|
.040
|
|
none
|
0.00
|
0.01
|
0.47
|
.638
|
|
na
|
0.01
|
0.01
|
0.82
|
.412
|
Single
Comparison of responses within learning category. p-values have been adjusted using a Holm correction.
|
learning
|
estimate
|
estimate1
|
estimate2
|
statistic
|
p.value
|
parameter
|
conf.low
|
conf.high
|
method
|
alternative
|
|
parent
|
0.04
|
0.90
|
0.86
|
1.87
|
.062
|
1942
|
0.00
|
0.09
|
Two Sample t-test
|
two.sided
|
|
sibling
|
-0.04
|
0.03
|
0.07
|
-3.26
|
.001
|
1942
|
-0.07
|
-0.02
|
Two Sample t-test
|
two.sided
|
|
grandparent
|
-0.07
|
0.24
|
0.31
|
-2.08
|
.038
|
1942
|
-0.14
|
0.00
|
Two Sample t-test
|
two.sided
|
|
relative
|
-0.06
|
0.06
|
0.12
|
-3.28
|
.001
|
1942
|
-0.10
|
-0.03
|
Two Sample t-test
|
two.sided
|
|
friend
|
-0.02
|
0.02
|
0.04
|
-1.40
|
.161
|
884
|
-0.05
|
0.01
|
Two Sample t-test
|
two.sided
|
|
neighbor
|
0.00
|
0.01
|
0.01
|
-0.37
|
.714
|
1942
|
-0.02
|
0.01
|
Two Sample t-test
|
two.sided
|
|
pod
|
0.02
|
0.06
|
0.04
|
1.04
|
.301
|
1942
|
-0.02
|
0.05
|
Two Sample t-test
|
two.sided
|
|
babysitter
|
0.01
|
0.06
|
0.04
|
0.64
|
.524
|
1942
|
-0.02
|
0.05
|
Two Sample t-test
|
two.sided
|
|
other
|
-0.01
|
0.04
|
0.06
|
-0.83
|
.405
|
1942
|
-0.04
|
0.02
|
Two Sample t-test
|
two.sided
|
|
none
|
-0.01
|
0.02
|
0.03
|
-1.21
|
.225
|
1942
|
-0.04
|
0.01
|
Two Sample t-test
|
two.sided
|
|
na
|
0.01
|
0.03
|
0.02
|
0.98
|
.329
|
1942
|
-0.01
|
0.04
|
Two Sample t-test
|
two.sided
|
Comparison of responses within learning category after accounting for employment status. p-values have been adjusted using a Holm correction.
|
learning
|
estimate
|
std.error
|
statistic
|
p.value
|
|
parent
|
-0.04
|
0.02
|
-1.87
|
.062
|
|
sibling
|
0.04
|
0.01
|
3.26
|
.001
|
|
grandparent
|
0.07
|
0.03
|
2.08
|
.038
|
|
relative
|
0.06
|
0.02
|
3.28
|
.001
|
|
friend
|
0.02
|
0.02
|
1.40
|
.161
|
|
neighbor
|
0.00
|
0.01
|
0.37
|
.714
|
|
pod
|
-0.02
|
0.02
|
-1.04
|
.301
|
|
babysitter
|
-0.01
|
0.02
|
-0.64
|
.524
|
|
other
|
0.01
|
0.02
|
0.83
|
.405
|
|
none
|
0.01
|
0.01
|
1.21
|
.225
|
|
na
|
-0.01
|
0.01
|
-0.98
|
.329
|
Low Income
Comparison of responses within learning category. p-values have been adjusted using a Holm correction.
|
learning
|
estimate
|
estimate1
|
estimate2
|
statistic
|
p.value
|
parameter
|
conf.low
|
conf.high
|
method
|
alternative
|
|
parent
|
-0.03
|
0.89
|
0.92
|
-1.59
|
.111
|
1925
|
-0.06
|
0.01
|
Two Sample t-test
|
two.sided
|
|
sibling
|
-0.04
|
0.02
|
0.06
|
-3.96
|
< .001
|
1925
|
-0.06
|
-0.02
|
Two Sample t-test
|
two.sided
|
|
grandparent
|
0.04
|
0.25
|
0.21
|
1.86
|
.063
|
1925
|
0.00
|
0.09
|
Two Sample t-test
|
two.sided
|
|
relative
|
-0.03
|
0.06
|
0.09
|
-2.62
|
.009
|
1925
|
-0.06
|
-0.01
|
Two Sample t-test
|
two.sided
|
|
friend
|
0.01
|
0.03
|
0.01
|
1.11
|
.268
|
878
|
-0.01
|
0.03
|
Two Sample t-test
|
two.sided
|
|
neighbor
|
-0.01
|
0.01
|
0.01
|
-1.18
|
.238
|
1925
|
-0.02
|
0.00
|
Two Sample t-test
|
two.sided
|
|
pod
|
0.04
|
0.07
|
0.03
|
3.12
|
.002
|
1925
|
0.01
|
0.06
|
Two Sample t-test
|
two.sided
|
|
babysitter
|
0.05
|
0.07
|
0.02
|
3.95
|
< .001
|
1925
|
0.02
|
0.07
|
Two Sample t-test
|
two.sided
|
|
other
|
0.02
|
0.05
|
0.03
|
1.51
|
.130
|
1925
|
0.00
|
0.04
|
Two Sample t-test
|
two.sided
|
|
none
|
0.01
|
0.02
|
0.01
|
1.69
|
.090
|
1925
|
0.00
|
0.03
|
Two Sample t-test
|
two.sided
|
|
na
|
0.01
|
0.03
|
0.02
|
0.90
|
.367
|
1925
|
-0.01
|
0.03
|
Two Sample t-test
|
two.sided
|
Comparison of responses within learning category after accounting for employment status. p-values have been adjusted using a Holm correction.
|
learning
|
estimate
|
std.error
|
statistic
|
p.value
|
|
parent
|
0.03
|
0.02
|
1.59
|
.111
|
|
sibling
|
0.04
|
0.01
|
3.96
|
< .001
|
|
grandparent
|
-0.04
|
0.02
|
-1.86
|
.063
|
|
relative
|
0.03
|
0.01
|
2.62
|
.009
|
|
friend
|
-0.01
|
0.01
|
-1.11
|
.268
|
|
neighbor
|
0.01
|
0.01
|
1.18
|
.238
|
|
pod
|
-0.04
|
0.01
|
-3.12
|
.002
|
|
babysitter
|
-0.05
|
0.01
|
-3.95
|
< .001
|
|
other
|
-0.02
|
0.01
|
-1.51
|
.130
|
|
none
|
-0.01
|
0.01
|
-1.69
|
.090
|
|
na
|
-0.01
|
0.01
|
-0.90
|
.367
|
Employment
Comparison of responses within learning category. p-values have been adjusted using a Holm correction.
|
learning
|
estimate
|
estimate1
|
estimate2
|
statistic
|
p.value
|
parameter
|
conf.low
|
conf.high
|
method
|
alternative
|
|
parent
|
-0.04
|
0.89
|
0.94
|
-2.59
|
.010
|
1941
|
-0.08
|
-0.01
|
Two Sample t-test
|
two.sided
|
|
sibling
|
-0.01
|
0.03
|
0.04
|
-0.83
|
.404
|
1941
|
-0.03
|
0.01
|
Two Sample t-test
|
two.sided
|
|
grandparent
|
0.10
|
0.26
|
0.16
|
4.07
|
< .001
|
1941
|
0.05
|
0.15
|
Two Sample t-test
|
two.sided
|
|
relative
|
0.04
|
0.07
|
0.03
|
2.85
|
.004
|
1941
|
0.01
|
0.07
|
Two Sample t-test
|
two.sided
|
|
friend
|
0.01
|
0.02
|
0.02
|
0.68
|
.498
|
883
|
-0.02
|
0.03
|
Two Sample t-test
|
two.sided
|
|
neighbor
|
0.00
|
0.01
|
0.01
|
0.25
|
.806
|
1941
|
-0.01
|
0.01
|
Two Sample t-test
|
two.sided
|
|
pod
|
0.03
|
0.06
|
0.03
|
2.18
|
.030
|
1941
|
0.00
|
0.05
|
Two Sample t-test
|
two.sided
|
|
babysitter
|
0.07
|
0.07
|
0.00
|
5.11
|
< .001
|
1941
|
0.04
|
0.09
|
Two Sample t-test
|
two.sided
|
|
other
|
0.03
|
0.05
|
0.02
|
2.78
|
.005
|
1941
|
0.01
|
0.05
|
Two Sample t-test
|
two.sided
|
|
none
|
0.01
|
0.02
|
0.02
|
0.87
|
.384
|
1941
|
-0.01
|
0.02
|
Two Sample t-test
|
two.sided
|
|
na
|
0.01
|
0.03
|
0.02
|
0.69
|
.492
|
1941
|
-0.01
|
0.02
|
Two Sample t-test
|
two.sided
|
All groups
A comparison of groups using ANOVA (excluding the average)
|
person
|
term
|
df
|
sumsq
|
meansq
|
statistic
|
p.value
|
|
parent
|
group
|
3
|
1.06
|
0.35
|
3.87
|
.009
|
|
sibling
|
group
|
3
|
0.09
|
0.03
|
0.47
|
.703
|
|
grandparent
|
group
|
3
|
1.23
|
0.41
|
2.28
|
.078
|
|
relative
|
group
|
3
|
0.46
|
0.15
|
1.92
|
.124
|
|
friend
|
group
|
3
|
0.07
|
0.02
|
1.46
|
.224
|
|
neighbor
|
group
|
3
|
0.02
|
0.01
|
0.66
|
.574
|
|
pod
|
group
|
3
|
0.11
|
0.04
|
0.98
|
.400
|
|
babysitter
|
group
|
3
|
0.22
|
0.07
|
2.21
|
.085
|
|
other
|
group
|
3
|
0.14
|
0.05
|
1.43
|
.232
|
|
none
|
group
|
3
|
0.14
|
0.05
|
2.21
|
.085
|
|
na
|
group
|
3
|
0.00
|
0.00
|
0.07
|
.975
|
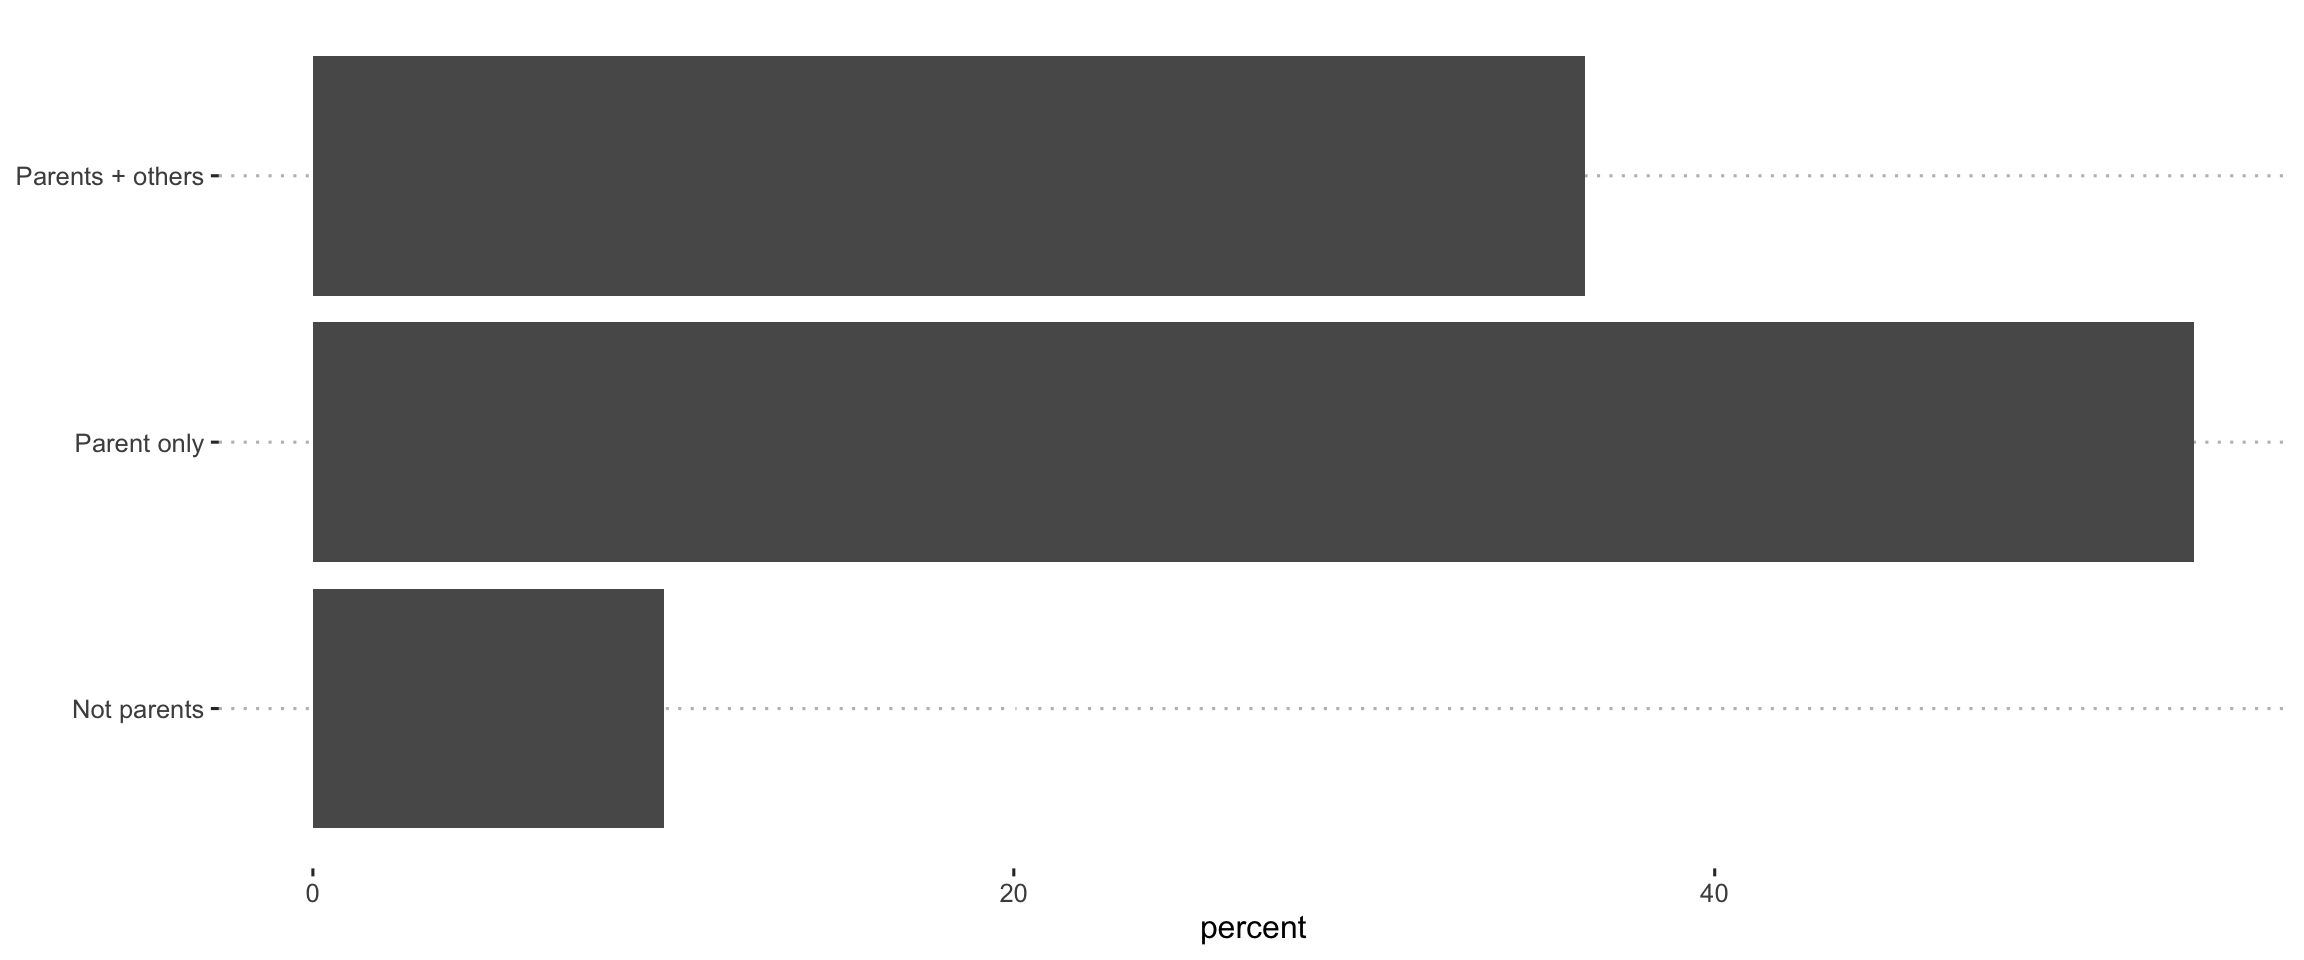
Parents only
Overall
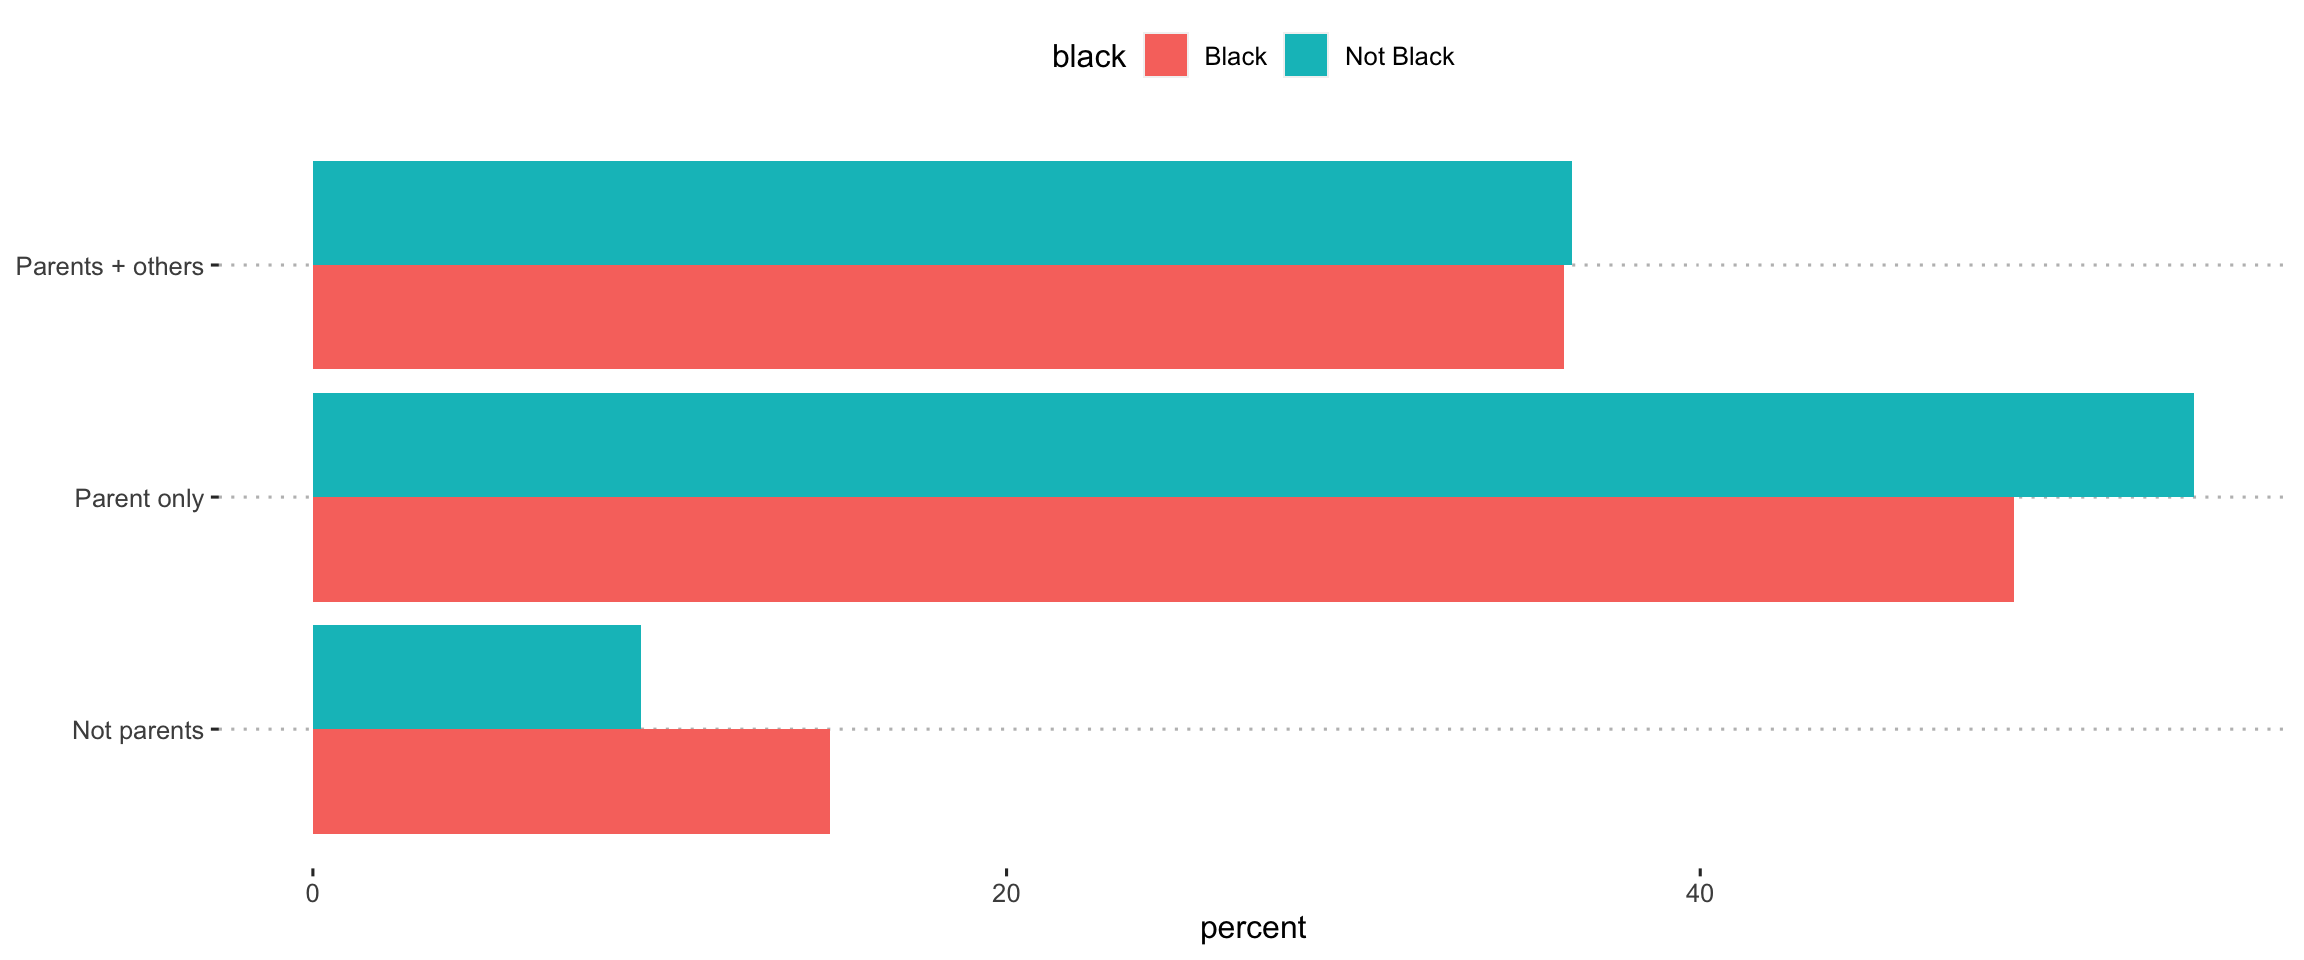
Black
LatinX
Single
Low Income
Employment
Caregiver Mental Health
Mental health composite
Caregiver mental health is a composite variable indexing anxiety, depression, stress, and loneliness. The scale ranges from 0 (worse possible mental health) to 100 (best possible mental health).
Overall
This model is based on the data from 441 caregivers.
Relationship between mental health and child school plans
|
term
|
estimate
|
std.error
|
statistic
|
p.value
|
|
(Intercept)
|
60.65
|
2.26
|
26.85
|
< .001
|
|
Older child: Remote learning
|
-5.94
|
2.33
|
-2.55
|
.011
|
|
Older child: Parent responsible
|
-2.46
|
2.75
|
-0.90
|
.370
|
|
Younger child: In-person care
|
6.62
|
3.00
|
2.21
|
.028
|
|
Younger child: Parent responsible
|
2.56
|
2.74
|
0.93
|
.351
|
Black
This model is based on the data from 53 caregivers.
Relationship between mental health and child school plans
|
term
|
estimate
|
std.error
|
statistic
|
p.value
|
|
(Intercept)
|
59.27
|
5.71
|
10.39
|
< .001
|
|
Older child: Remote learning
|
3.08
|
6.61
|
0.47
|
.643
|
|
Older child: Parent responsible
|
-0.92
|
7.77
|
-0.12
|
.907
|
|
Younger child: In-person care
|
15.06
|
8.37
|
1.80
|
.078
|
|
Younger child: Parent responsible
|
3.39
|
7.71
|
0.44
|
.663
|
LatinX
This model is based on the data from 76 caregivers.
Relationship between mental health and child school plans
|
term
|
estimate
|
std.error
|
statistic
|
p.value
|
|
(Intercept)
|
66.85
|
6.47
|
10.33
|
< .001
|
|
Older child: Remote learning
|
-8.53
|
6.09
|
-1.40
|
.166
|
|
Older child: Parent responsible
|
2.33
|
9.24
|
0.25
|
.802
|
|
Younger child: In-person care
|
2.62
|
10.98
|
0.24
|
.812
|
|
Younger child: Parent responsible
|
-4.53
|
8.91
|
-0.51
|
.613
|
Single
This model is based on the data from 49 caregivers.
Relationship between mental health and child school plans
|
term
|
estimate
|
std.error
|
statistic
|
p.value
|
|
(Intercept)
|
62.84
|
6.13
|
10.25
|
< .001
|
|
Older child: Remote learning
|
-12.54
|
6.67
|
-1.88
|
.067
|
|
Older child: Parent responsible
|
-1.26
|
7.01
|
-0.18
|
.858
|
|
Younger child: In-person care
|
-10.64
|
12.20
|
-0.87
|
.388
|
|
Younger child: Parent responsible
|
0.45
|
7.05
|
0.06
|
.949
|
Low income
This model is based on the data from 128 caregivers.
Relationship between mental health and child school plans
|
term
|
estimate
|
std.error
|
statistic
|
p.value
|
|
(Intercept)
|
62.85
|
5.05
|
12.44
|
< .001
|
|
Older child: Remote learning
|
-6.24
|
4.53
|
-1.38
|
.171
|
|
Older child: Parent responsible
|
-3.93
|
5.74
|
-0.69
|
.495
|
|
Younger child: In-person care
|
2.86
|
8.75
|
0.33
|
.744
|
|
Younger child: Parent responsible
|
-0.74
|
5.52
|
-0.13
|
.894
|
Unemployed
This model is based on the data from 102 caregivers.
Relationship between mental health and child school plans
|
term
|
estimate
|
std.error
|
statistic
|
p.value
|
|
(Intercept)
|
61.07
|
5.96
|
10.25
|
< .001
|
|
Older child: Remote learning
|
-6.07
|
5.07
|
-1.20
|
.233
|
|
Older child: Parent responsible
|
-12.01
|
7.26
|
-1.65
|
.101
|
|
Younger child: In-person care
|
6.66
|
7.20
|
0.93
|
.357
|
|
Younger child: Parent responsible
|
5.74
|
6.19
|
0.93
|
.356
|