Social support
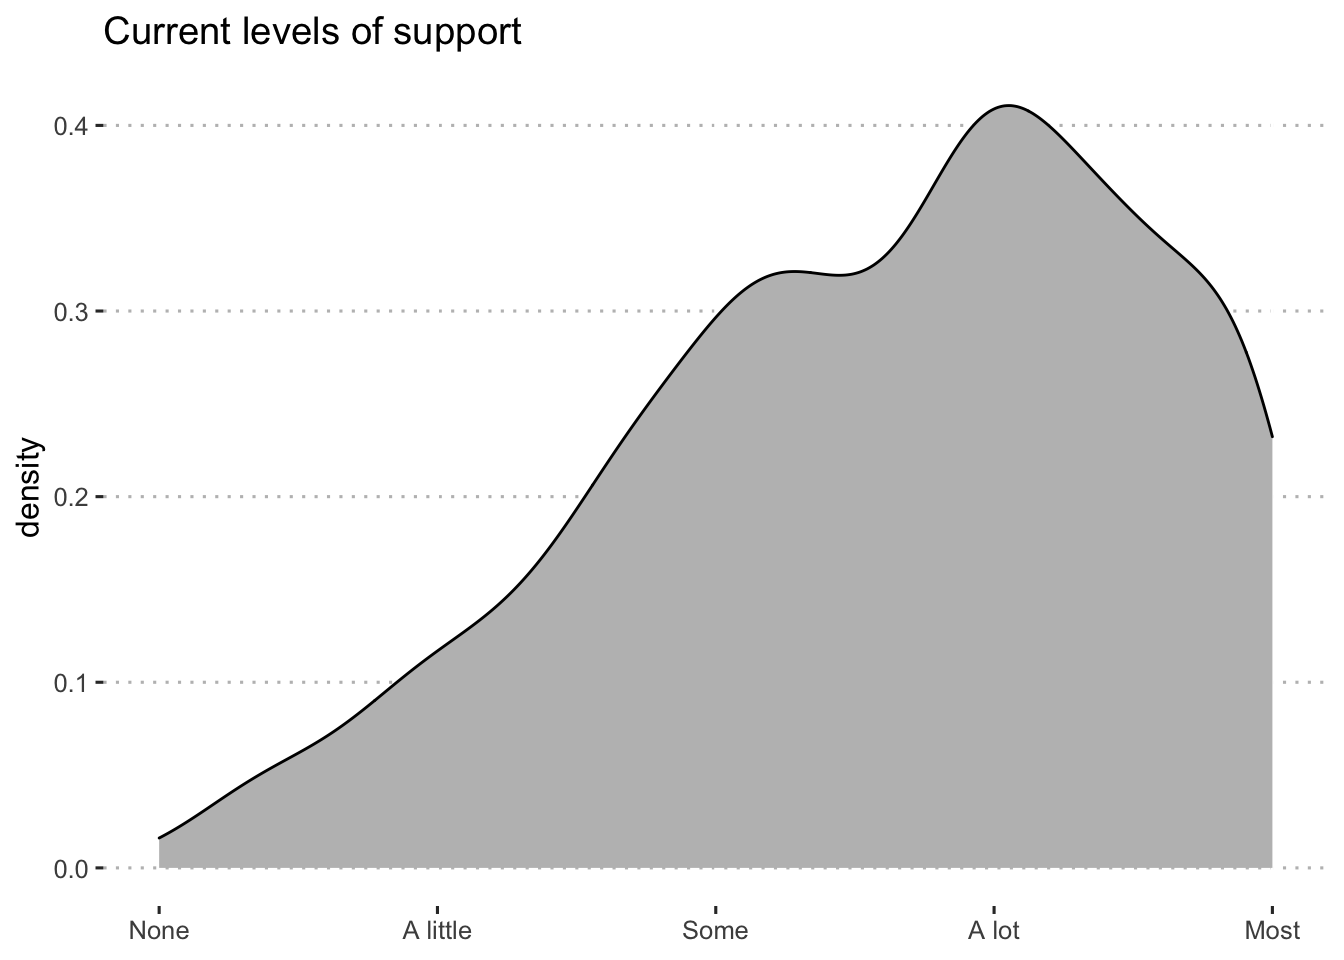
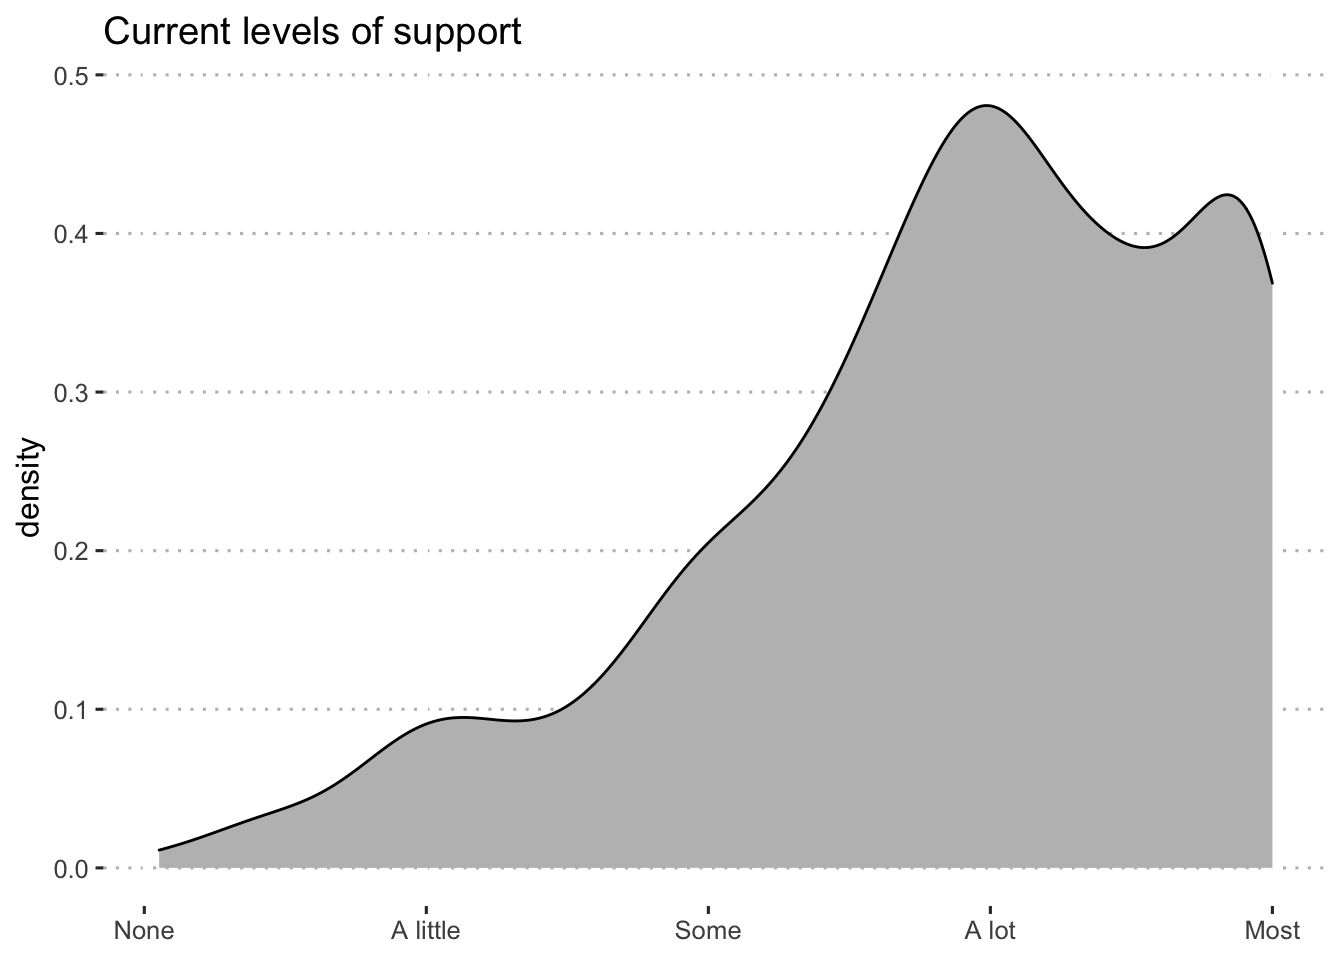
Current social support
Distribution
By Income
| group1 | group2 | p.value |
|---|---|---|
| Low Income | High Income | < .001 |
By Race
| group1 | group2 | p.value |
|---|---|---|
| Asian | American Indian/Alaska Native | > .999 |
| Black/African American | American Indian/Alaska Native | > .999 |
| Black/African American | Asian | > .999 |
| Multiple races | American Indian/Alaska Native | > .999 |
| Multiple races | Asian | .266 |
| Multiple races | Black/African American | > .999 |
| Native Hawaiian/Pacific Islander | American Indian/Alaska Native | > .999 |
| Native Hawaiian/Pacific Islander | Asian | > .999 |
| Native Hawaiian/Pacific Islander | Black/African American | > .999 |
| Native Hawaiian/Pacific Islander | Multiple races | > .999 |
| Other race | American Indian/Alaska Native | > .999 |
| Other race | Asian | > .999 |
| Other race | Black/African American | > .999 |
| Other race | Multiple races | > .999 |
| Other race | Native Hawaiian/Pacific Islander | > .999 |
| White/Caucasian | American Indian/Alaska Native | > .999 |
| White/Caucasian | Asian | > .999 |
| White/Caucasian | Black/African American | .842 |
| White/Caucasian | Multiple races | .035 |
| White/Caucasian | Native Hawaiian/Pacific Islander | > .999 |
| White/Caucasian | Other race | .476 |
By Ethnicity
| group1 | group2 | p.value |
|---|---|---|
| Latinx | Not Latinx | .016 |
Caregiver Wellbeing
Overall
$plot 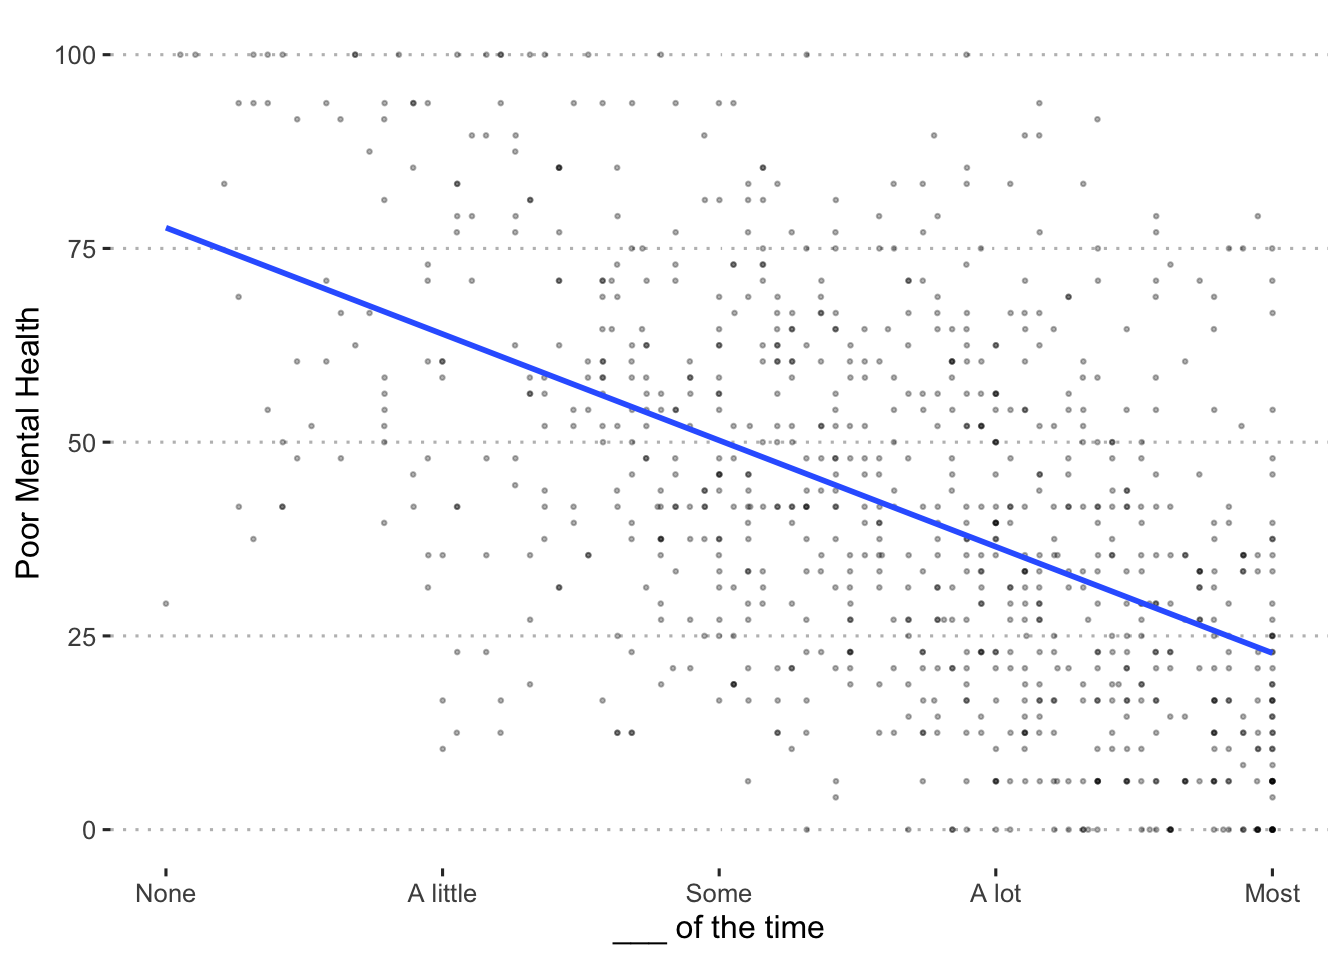 $summary
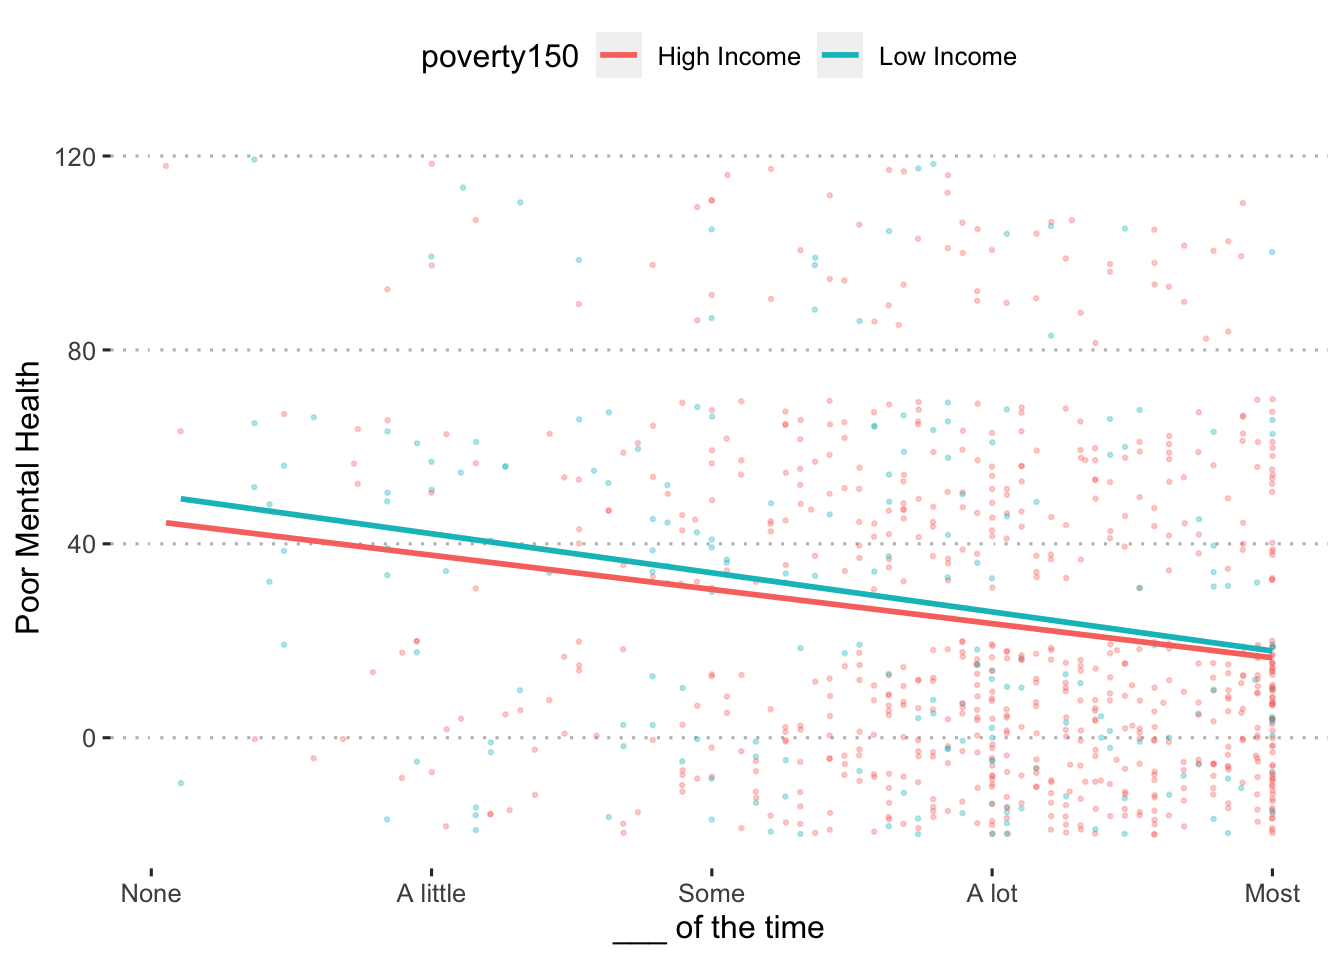
Income
$plot 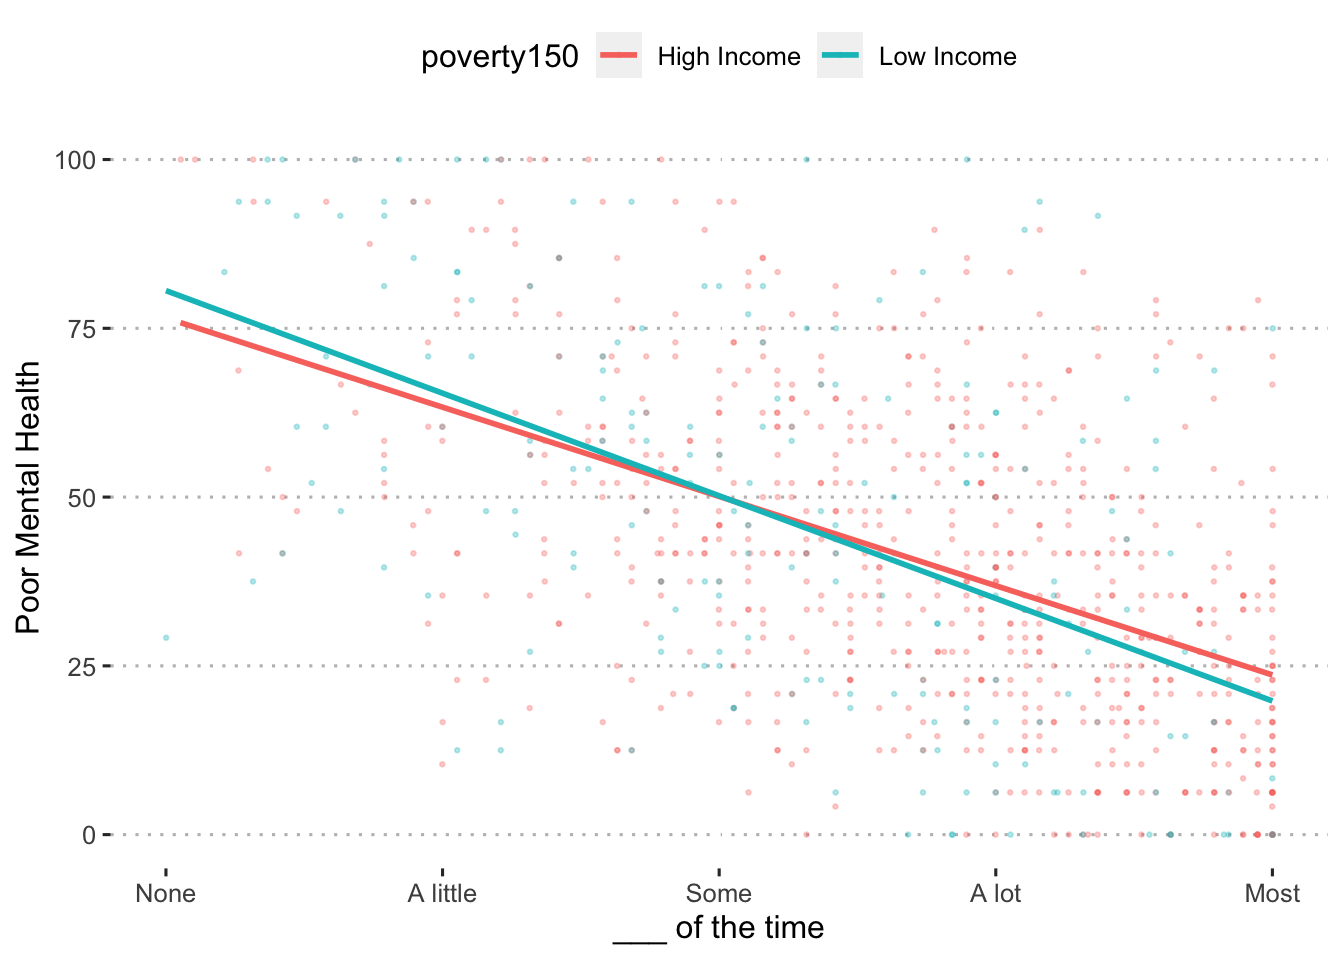 $summary
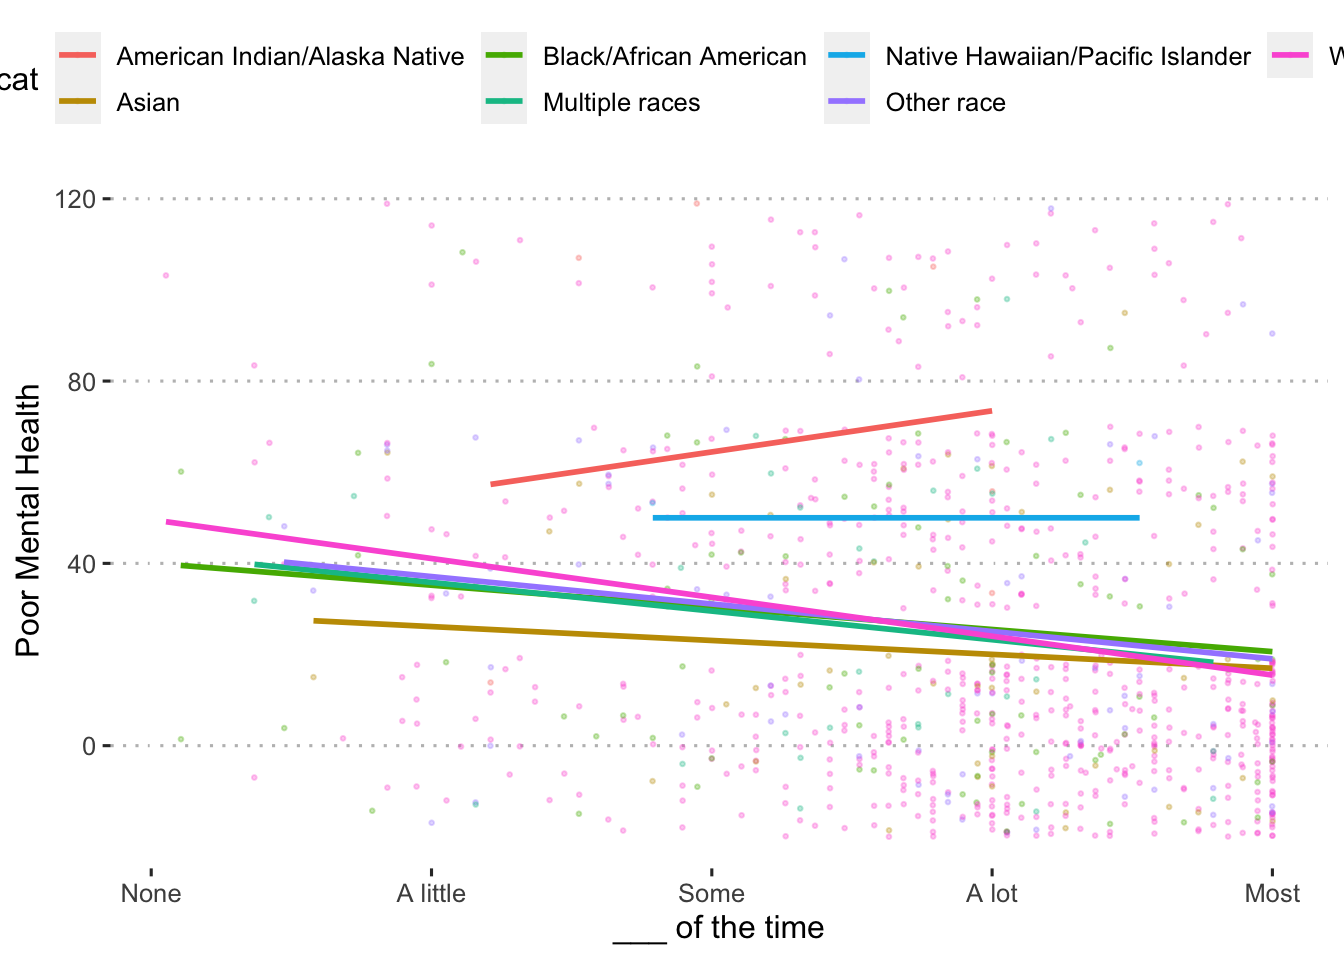
Race
$plot 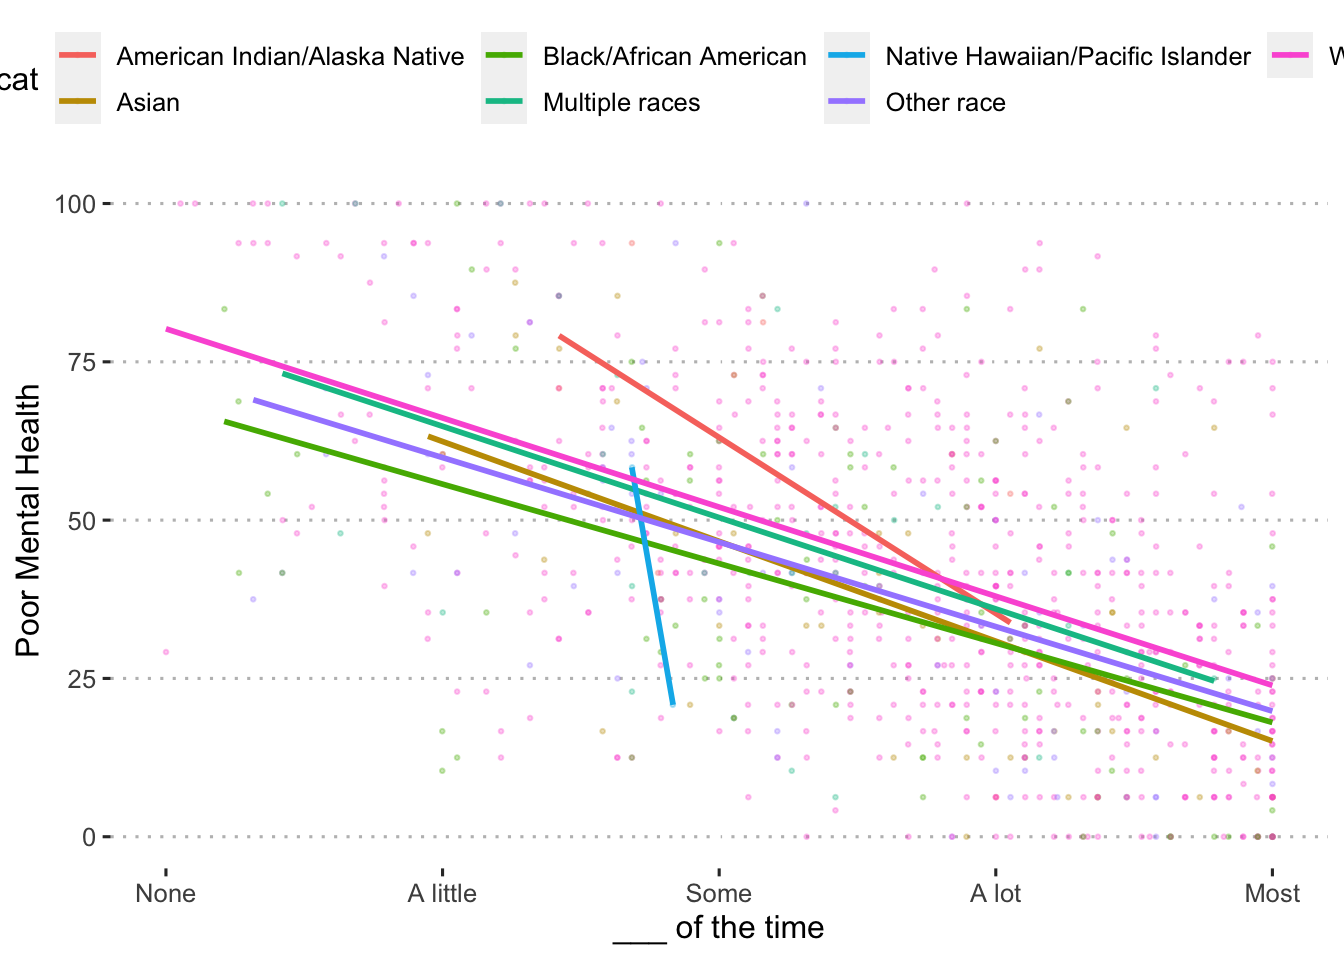 $summary
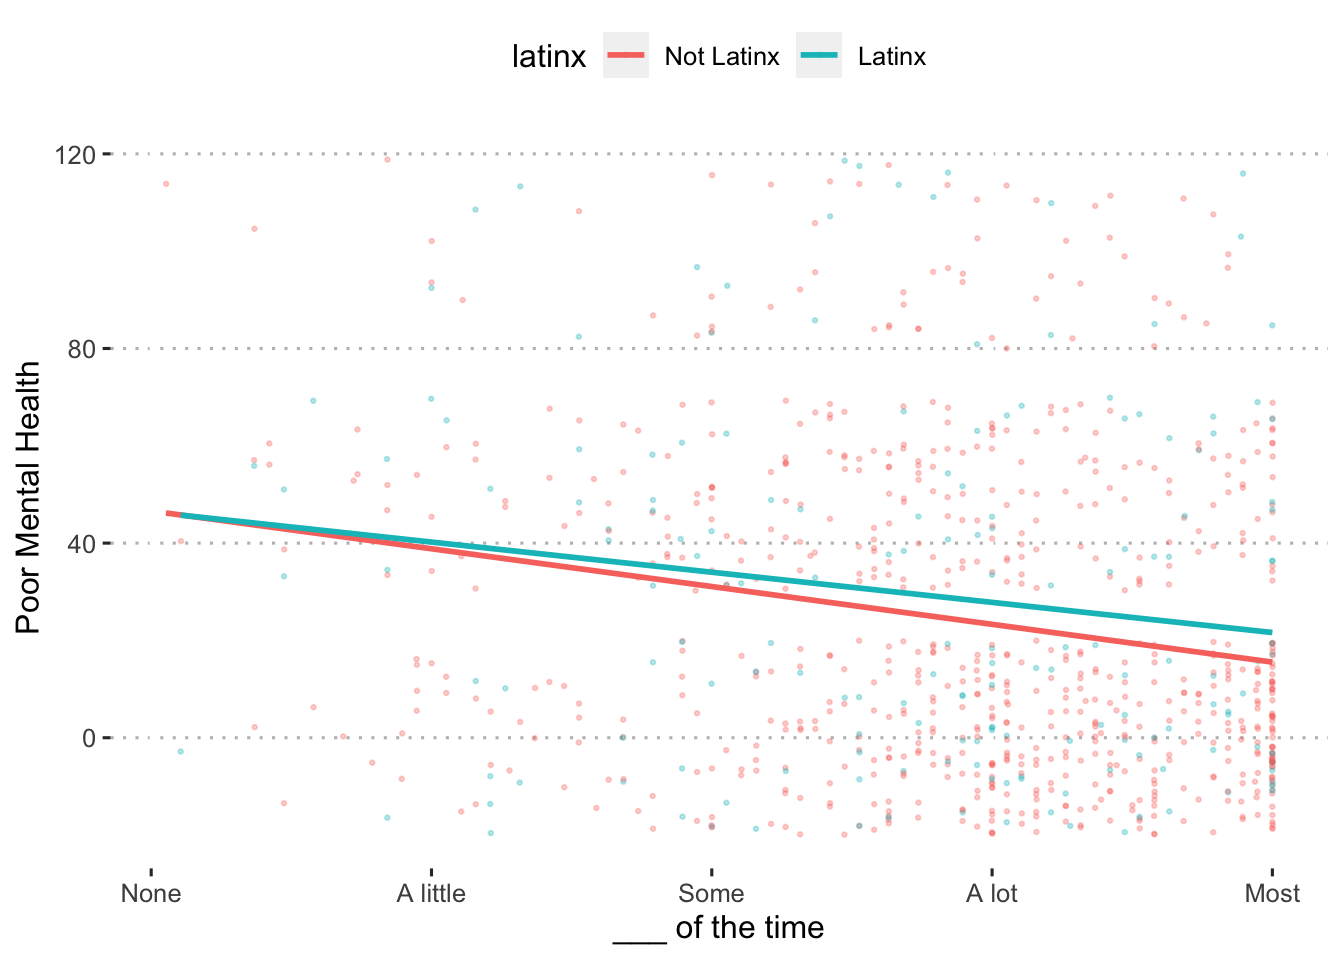
Ethnicity
$plot 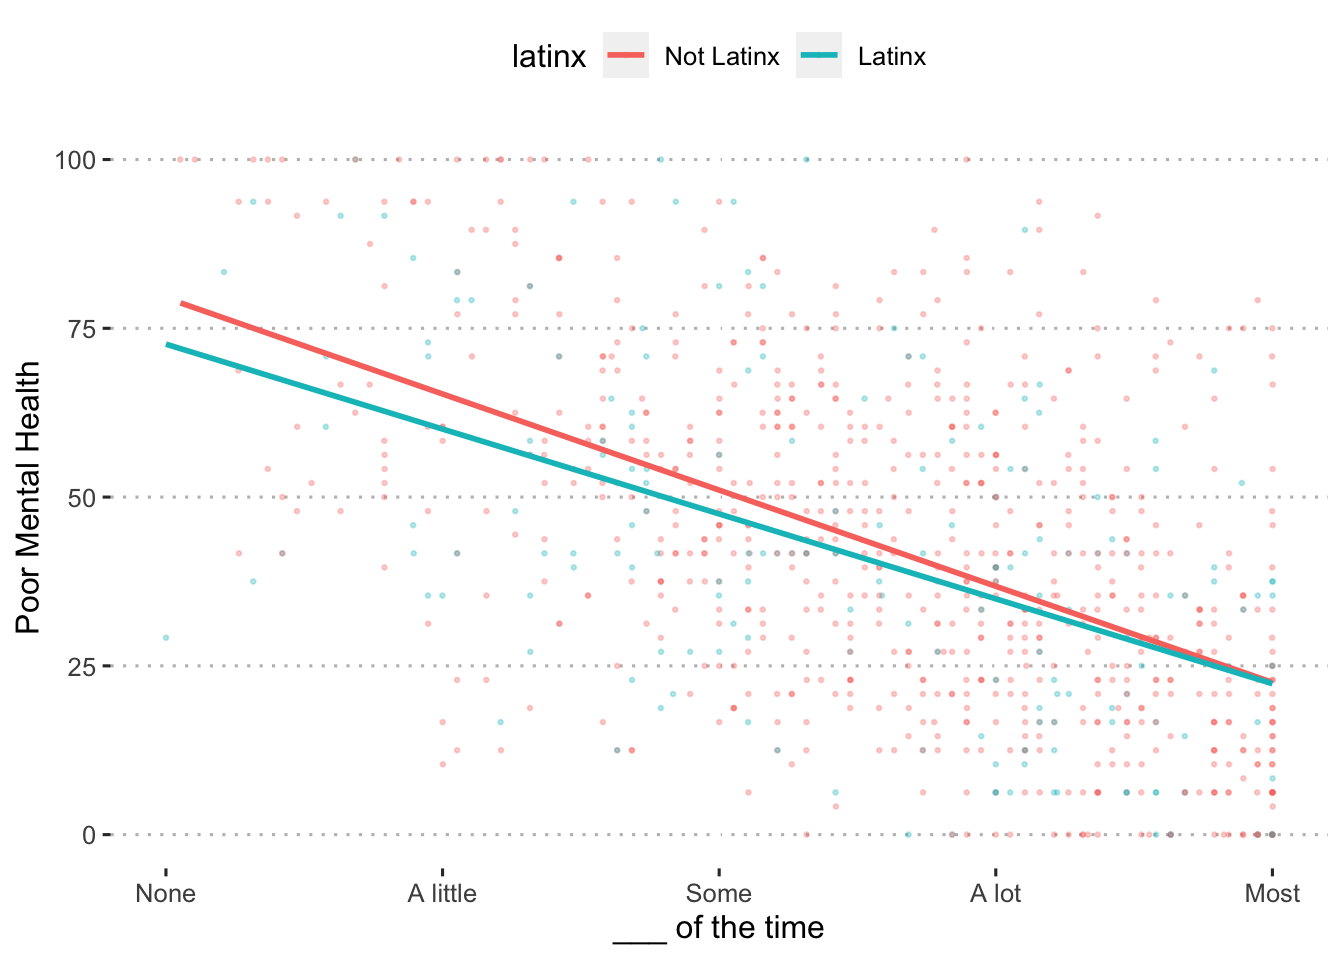 $summary
Child Externalizing
Overall
$plot 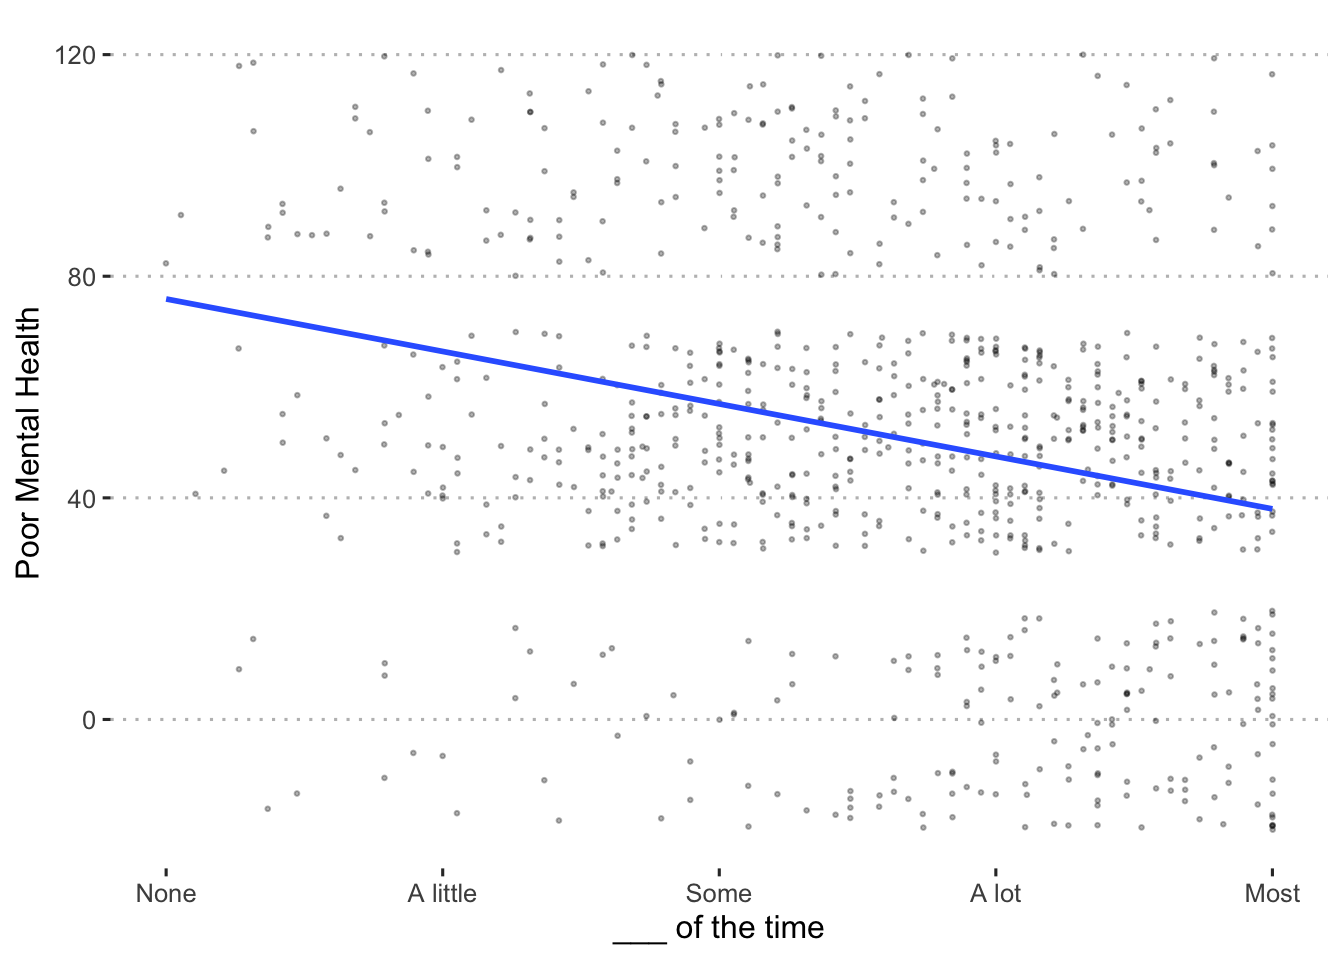 $summary
Income
$plot 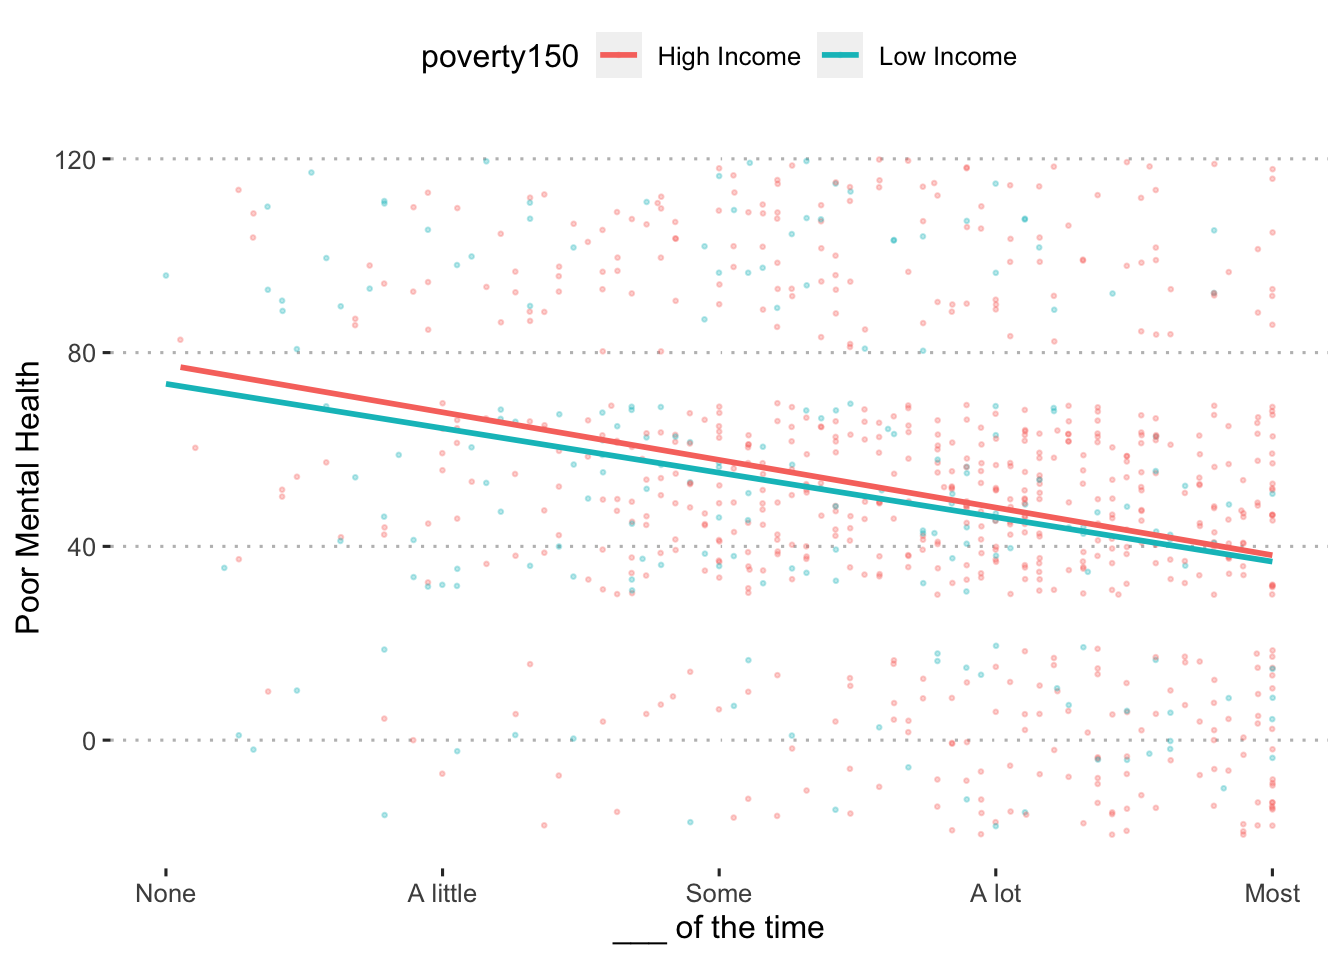 $summary
Race
$plot 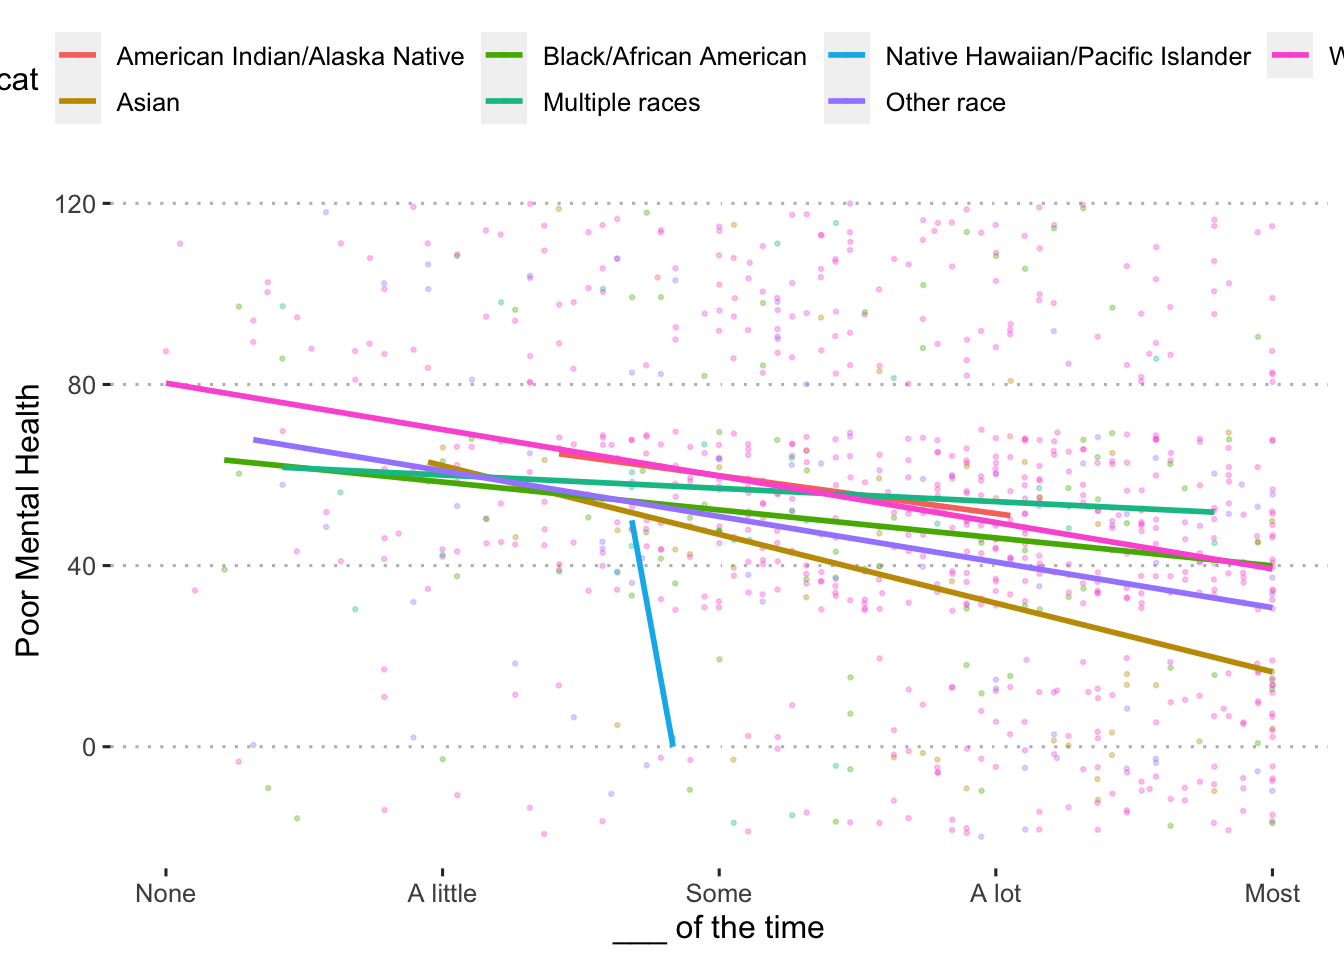 $summary
Ethnicity
$plot 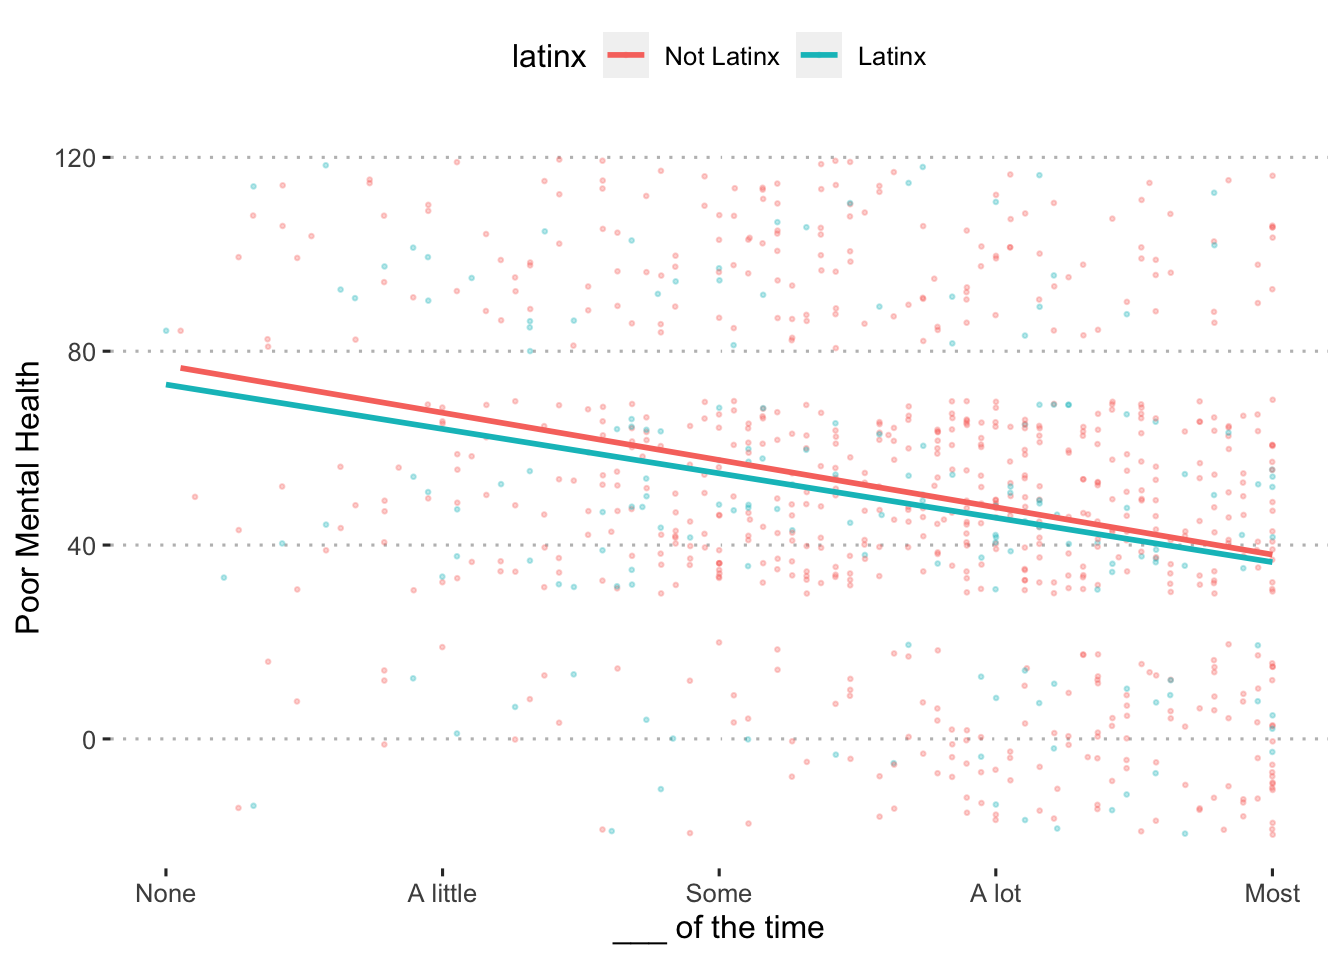 $summary
Child Internalizing
Overall
$plot 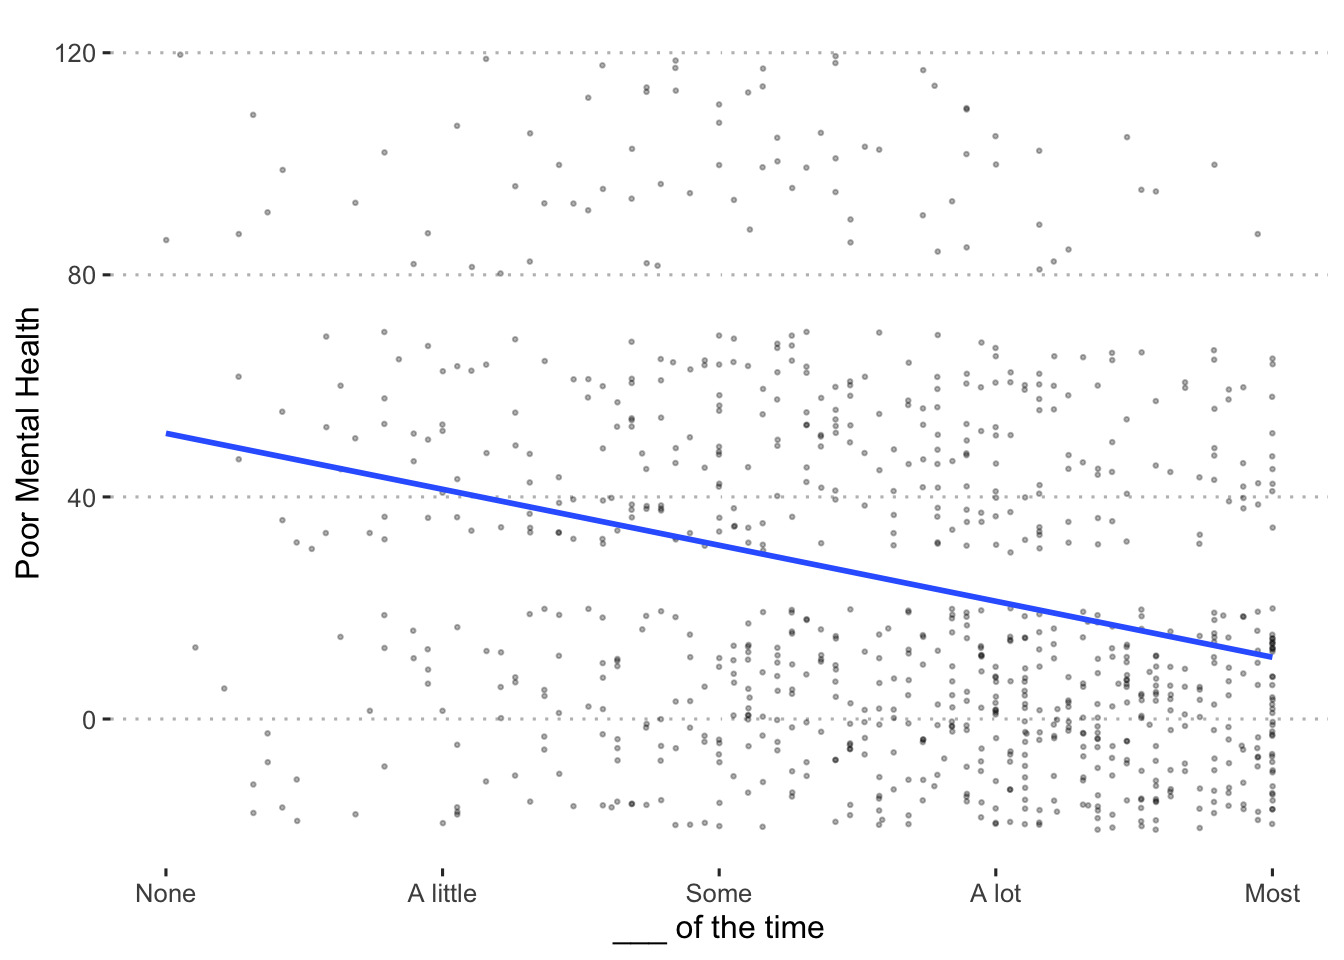 $summary
Income
$plot 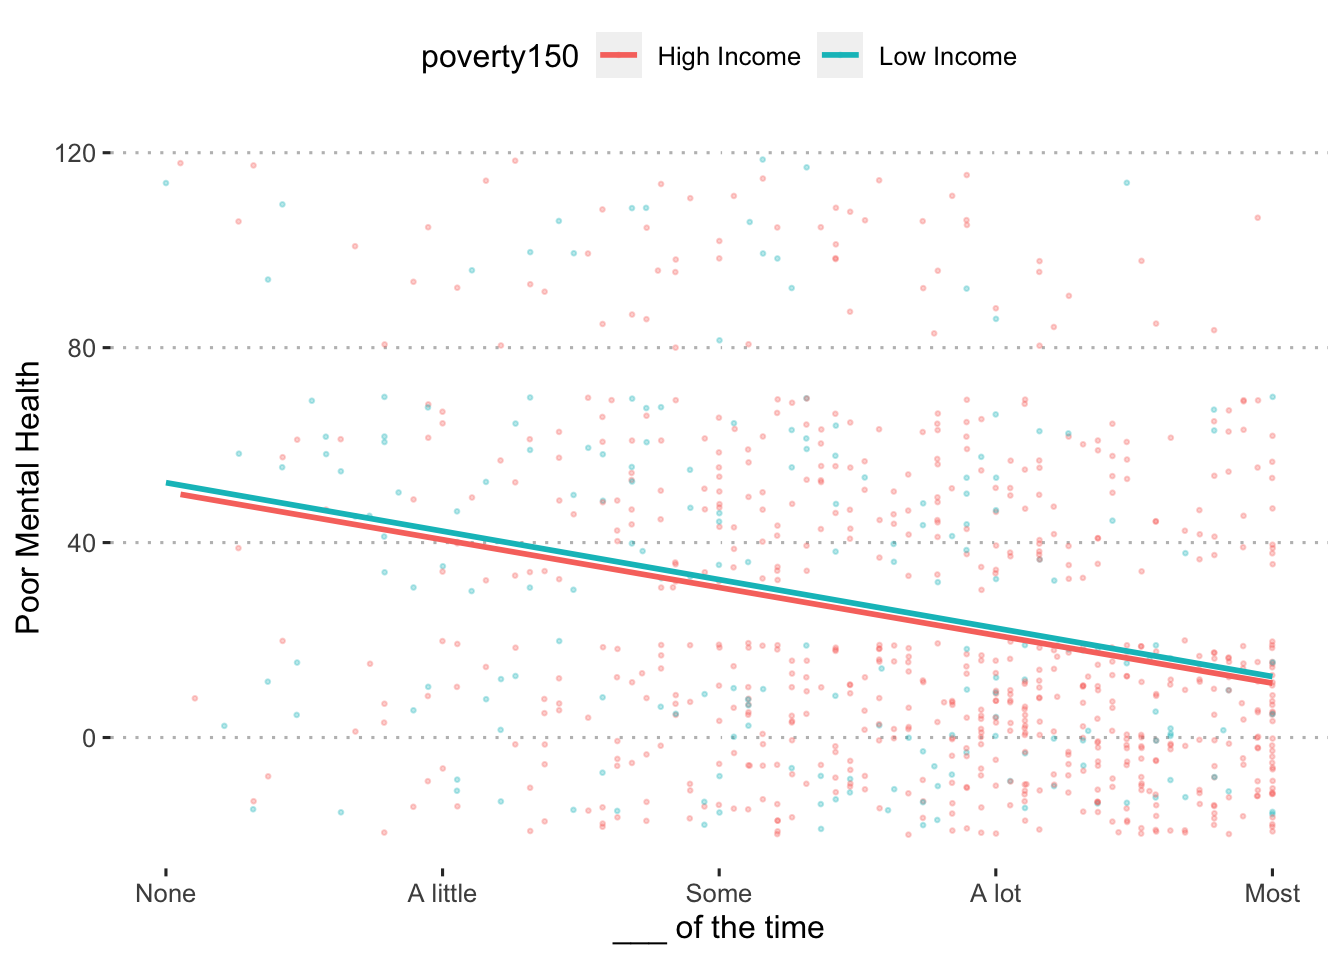 $summary
Race
$plot 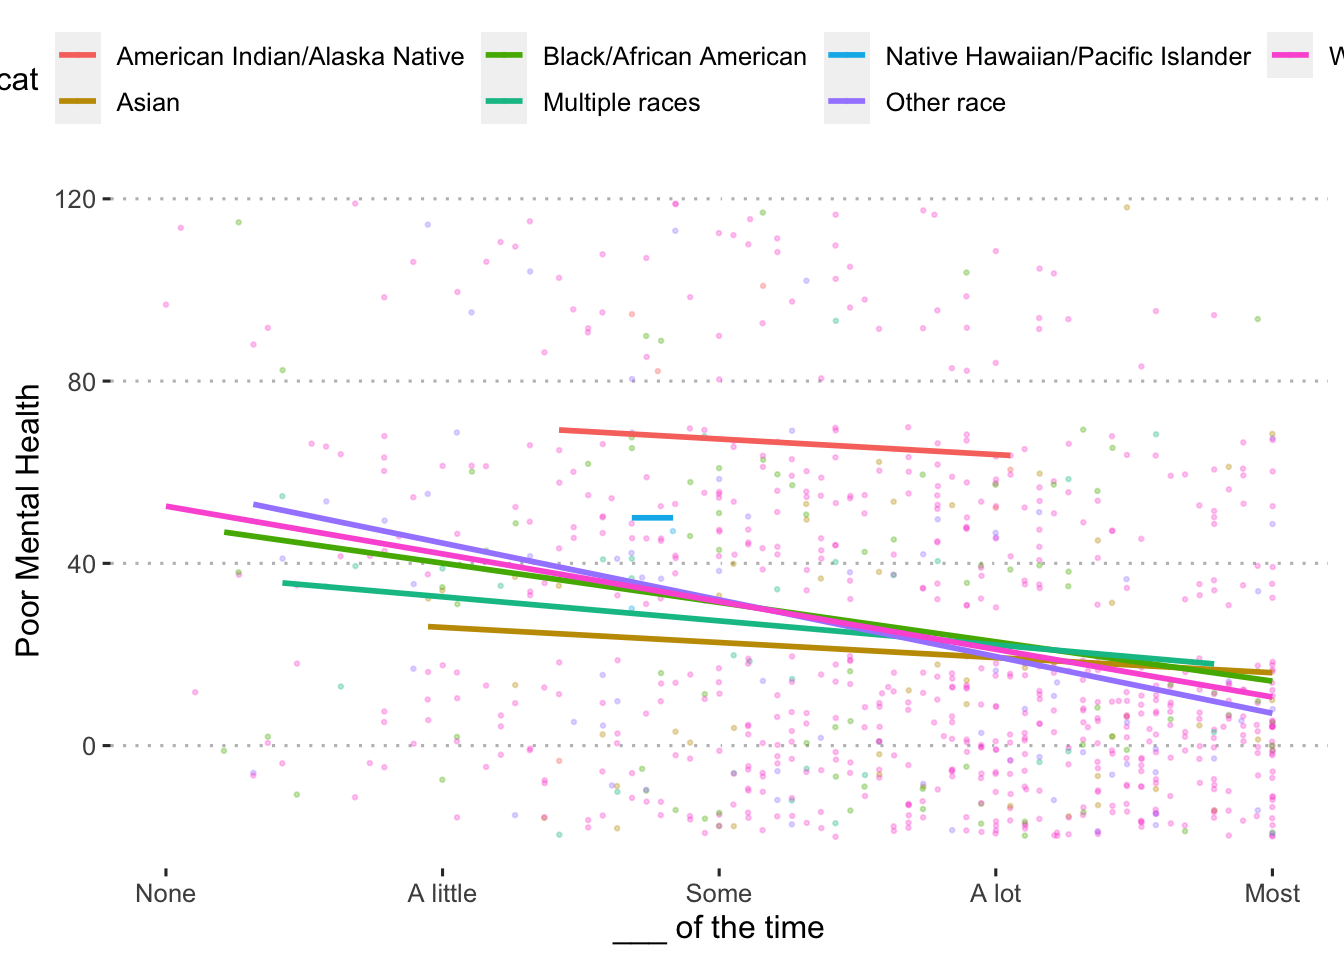 $summary
Ethnicity
$plot 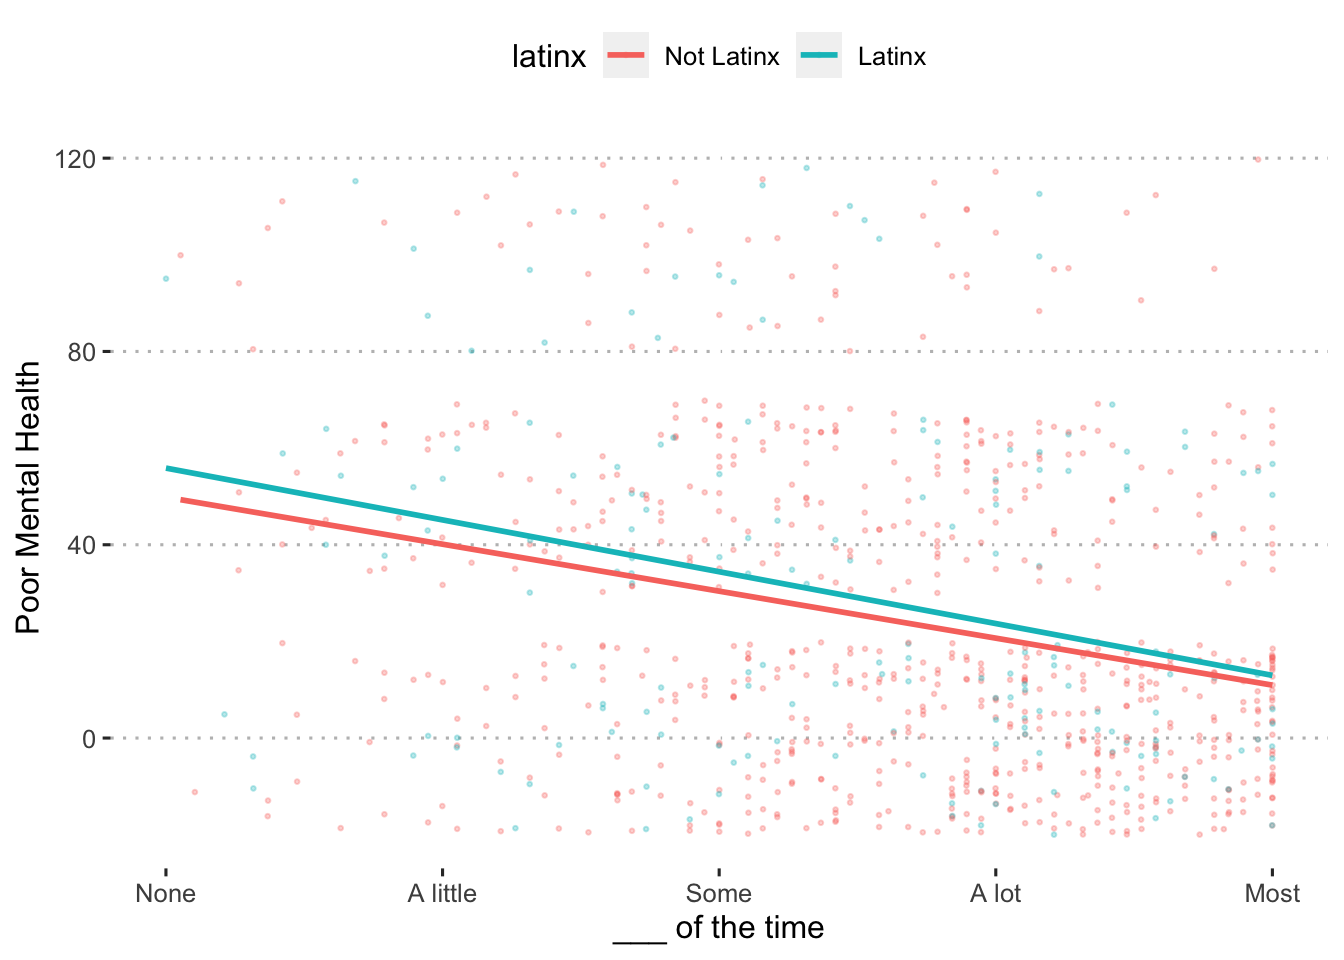 $summary
Prior social support
Distribution
By Income
| group1 | group2 | p.value |
|---|---|---|
| Low Income | High Income | < .001 |
By Race
| group1 | group2 | p.value |
|---|---|---|
| Asian | American Indian/Alaska Native | > .999 |
| Black/African American | American Indian/Alaska Native | > .999 |
| Black/African American | Asian | > .999 |
| Multiple races | American Indian/Alaska Native | > .999 |
| Multiple races | Asian | .708 |
| Multiple races | Black/African American | > .999 |
| Native Hawaiian/Pacific Islander | American Indian/Alaska Native | > .999 |
| Native Hawaiian/Pacific Islander | Asian | > .999 |
| Native Hawaiian/Pacific Islander | Black/African American | > .999 |
| Native Hawaiian/Pacific Islander | Multiple races | > .999 |
| Other race | American Indian/Alaska Native | > .999 |
| Other race | Asian | > .999 |
| Other race | Black/African American | > .999 |
| Other race | Multiple races | > .999 |
| Other race | Native Hawaiian/Pacific Islander | > .999 |
| White/Caucasian | American Indian/Alaska Native | .846 |
| White/Caucasian | Asian | > .999 |
| White/Caucasian | Black/African American | .019 |
| White/Caucasian | Multiple races | .052 |
| White/Caucasian | Native Hawaiian/Pacific Islander | > .999 |
| White/Caucasian | Other race | .714 |
By Ethnicity
| group1 | group2 | p.value |
|---|---|---|
| Latinx | Not Latinx | .022 |
Caregiver Wellbeing
Overall
$plot 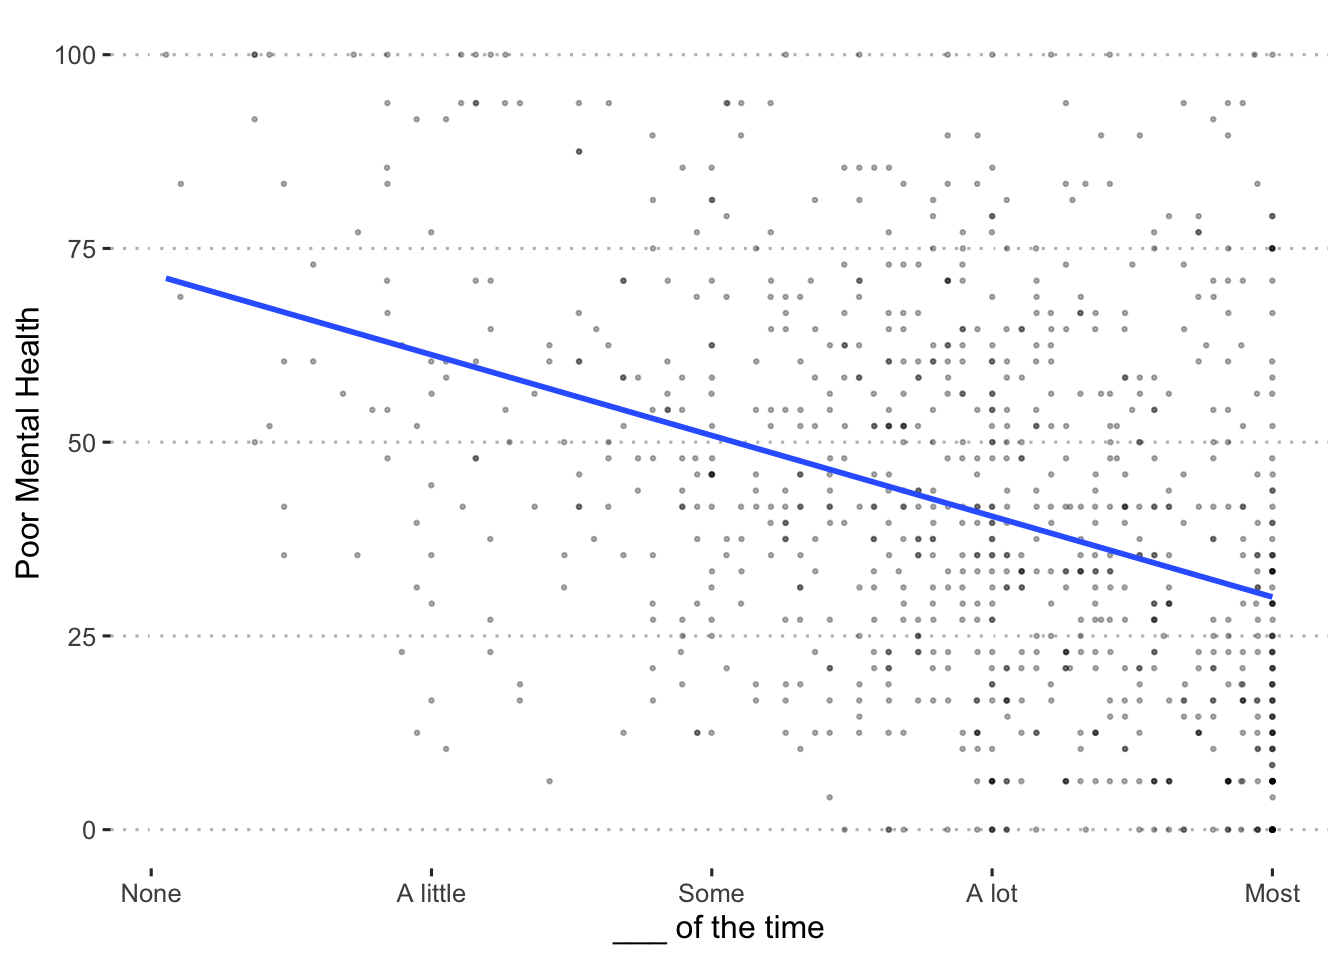 $summary
Income
$plot 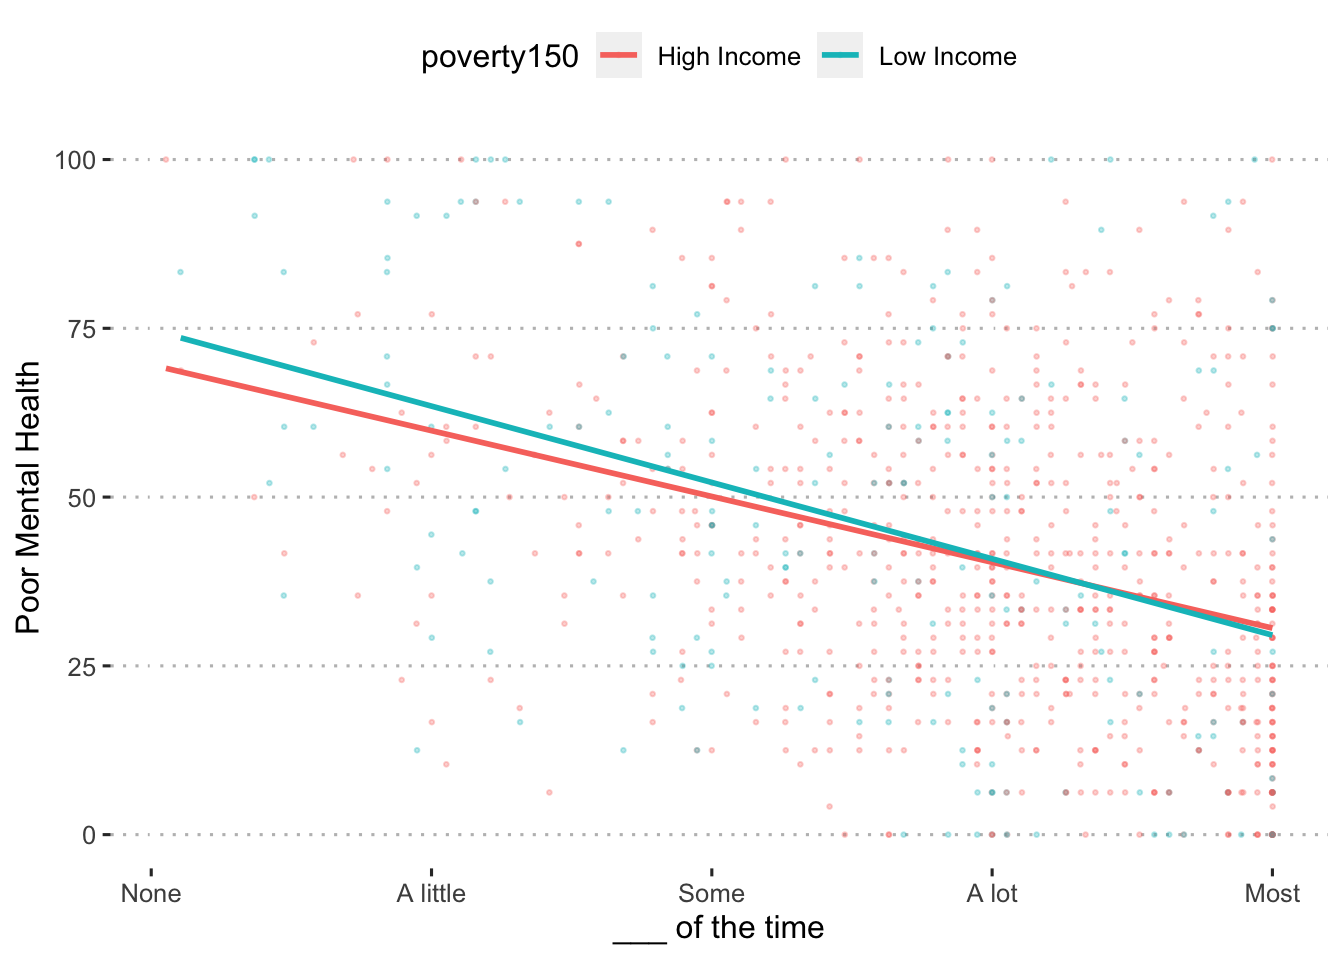 $summary
Race
$plot 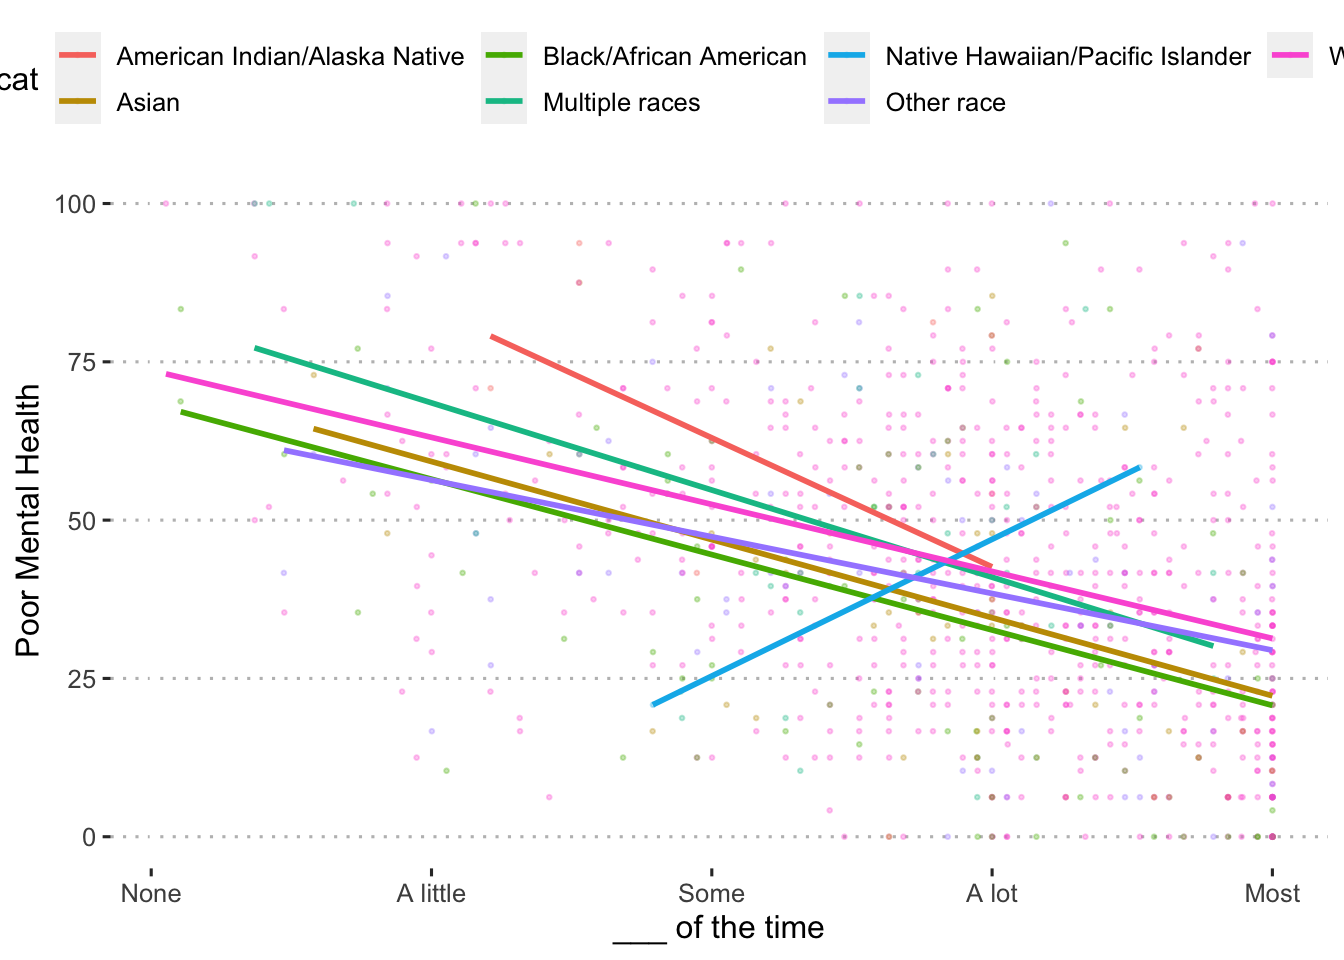 $summary
Ethnicity
$plot 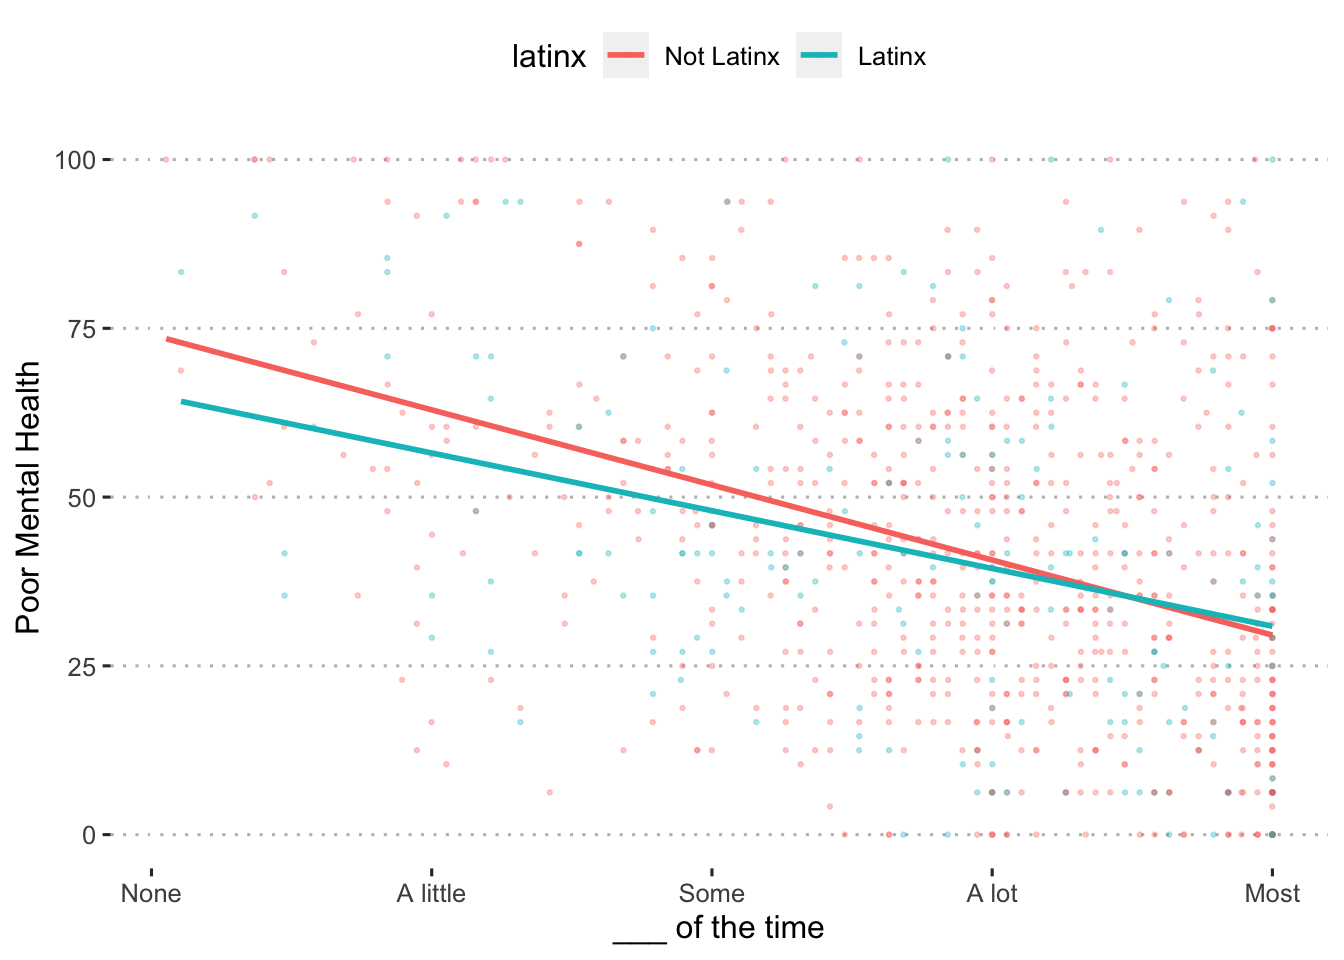 $summary
Child Externalizing
Overall
$plot 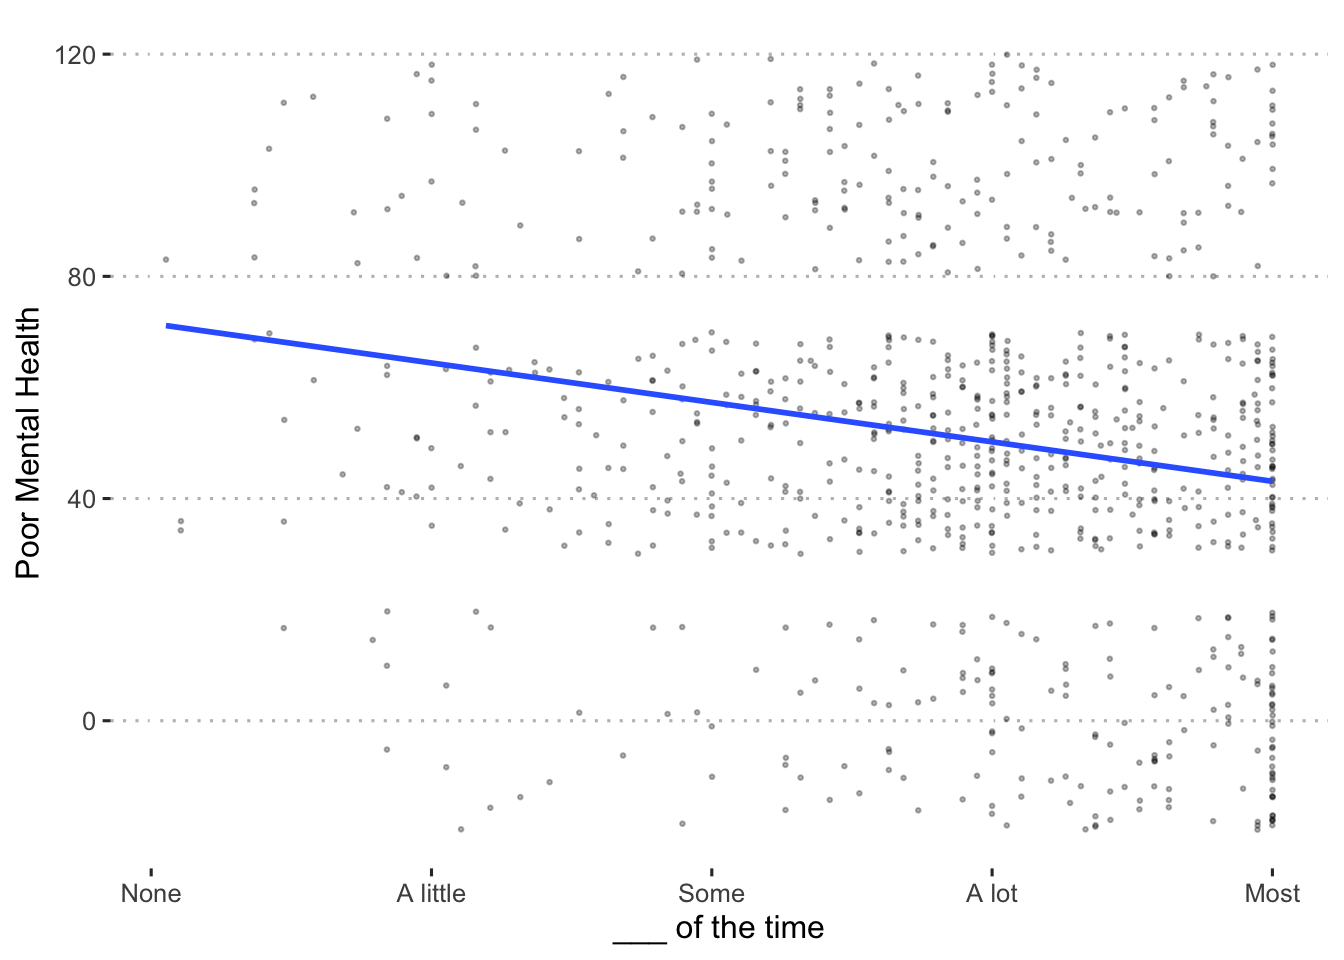 $summary
Income
$plot 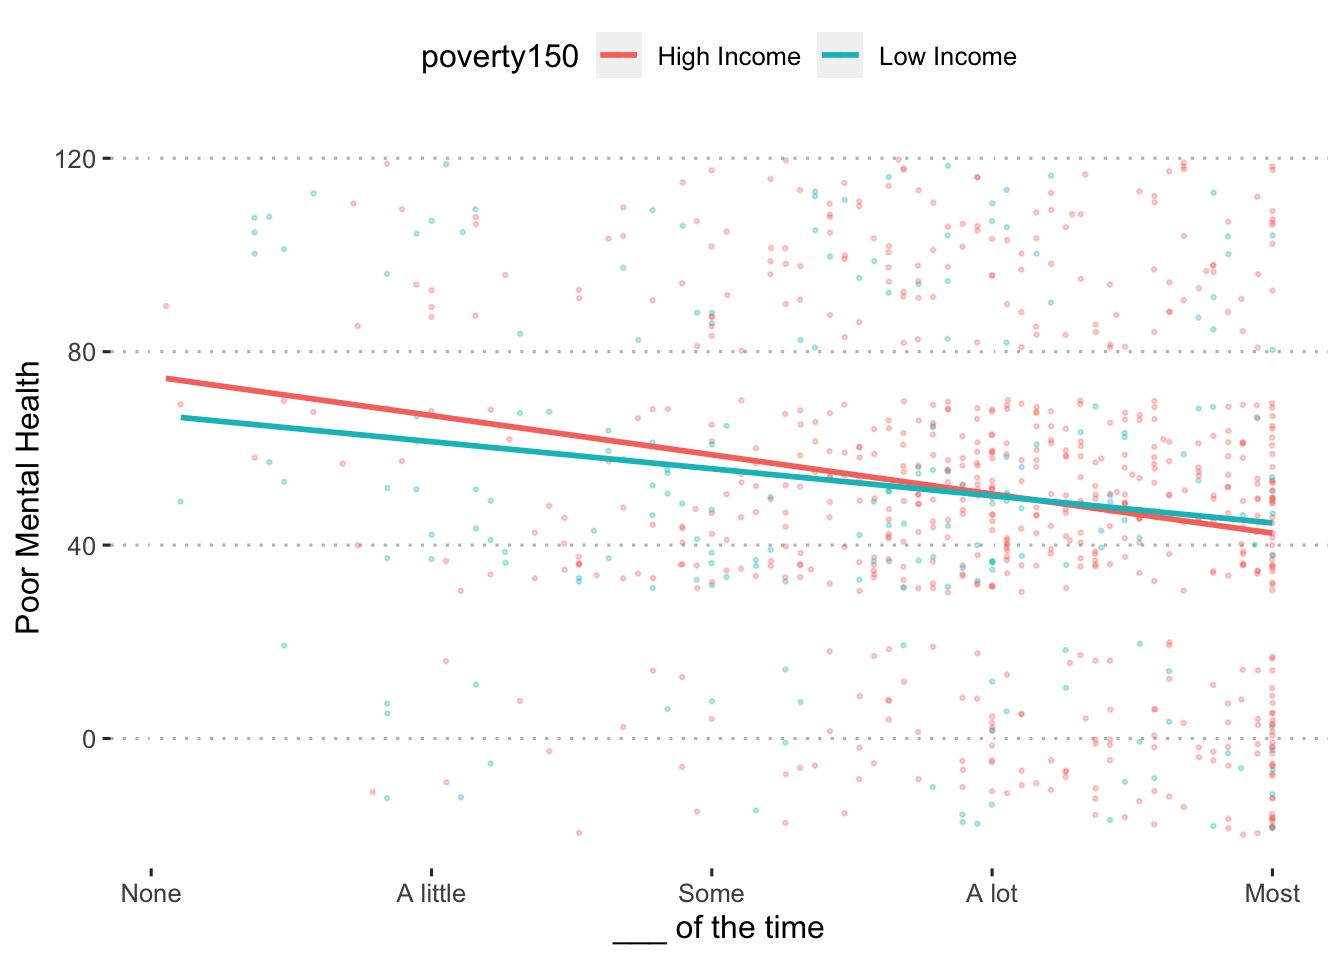 $summary
Race
$plot 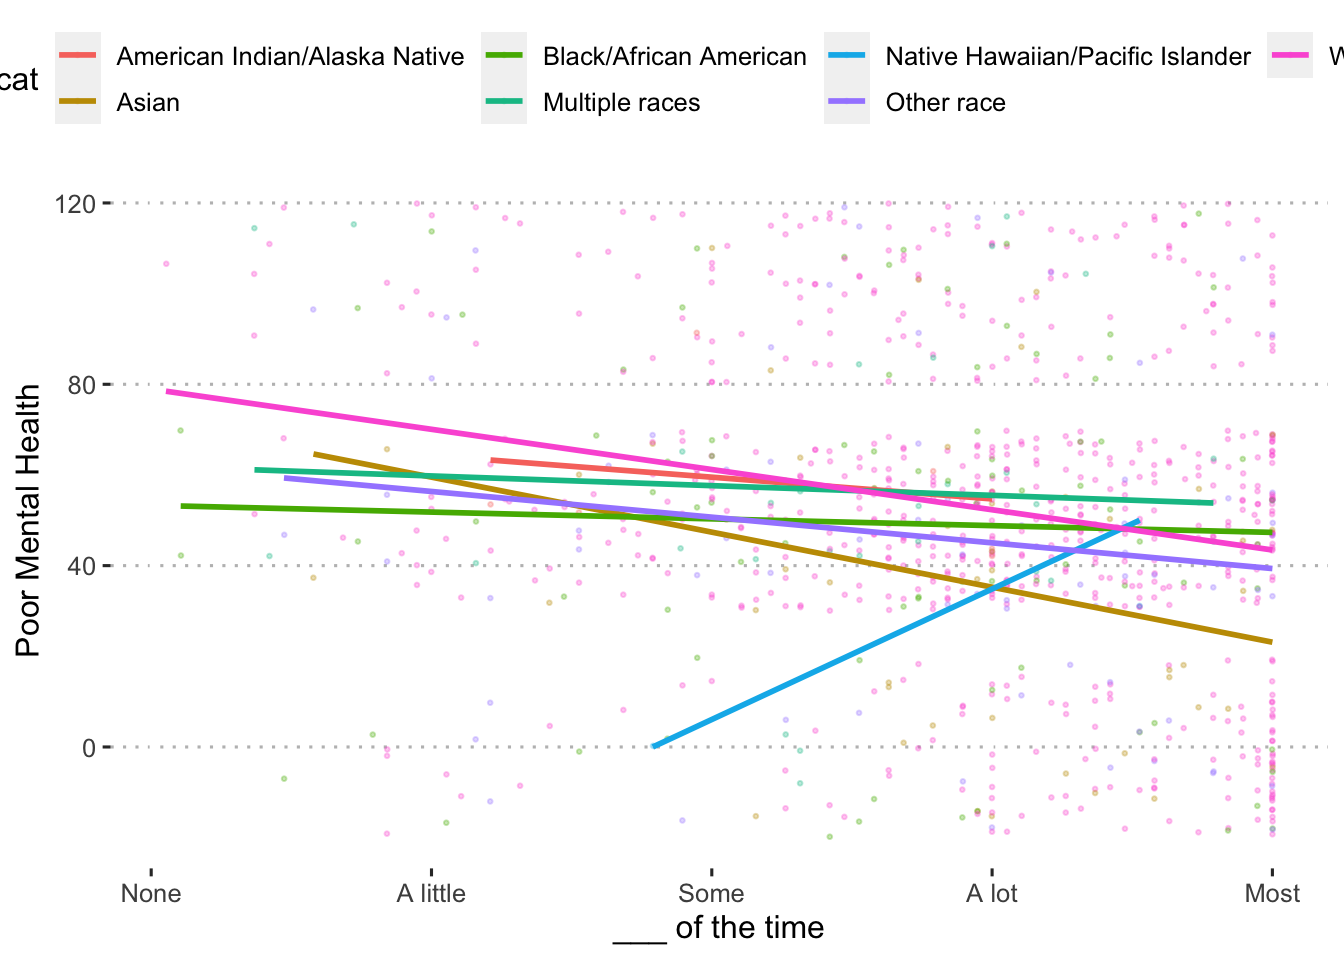 $summary
Ethnicity
$plot 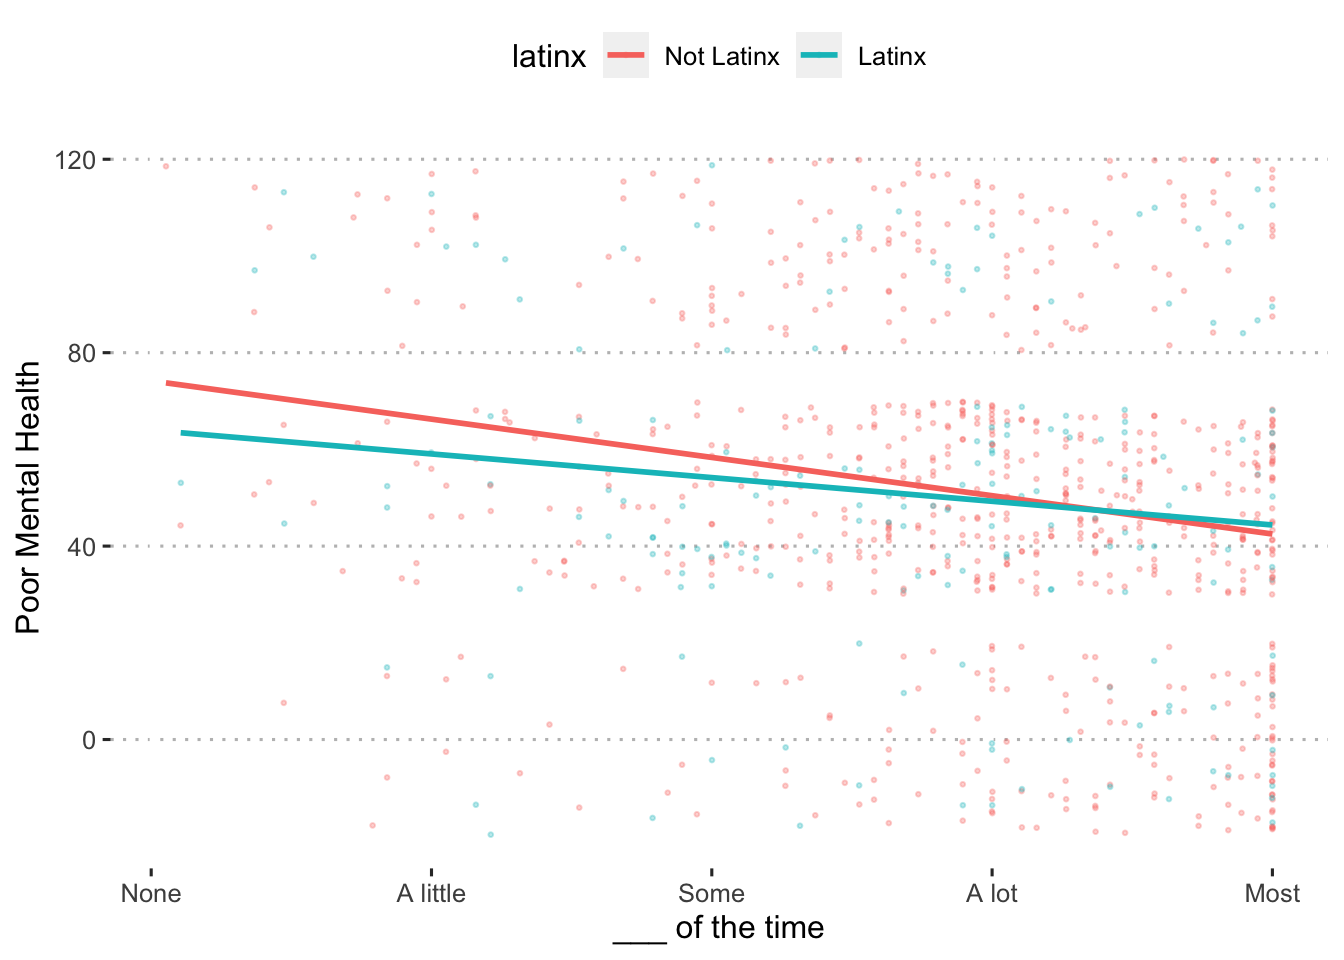 $summary
Child Internalizing
Overall
$plot 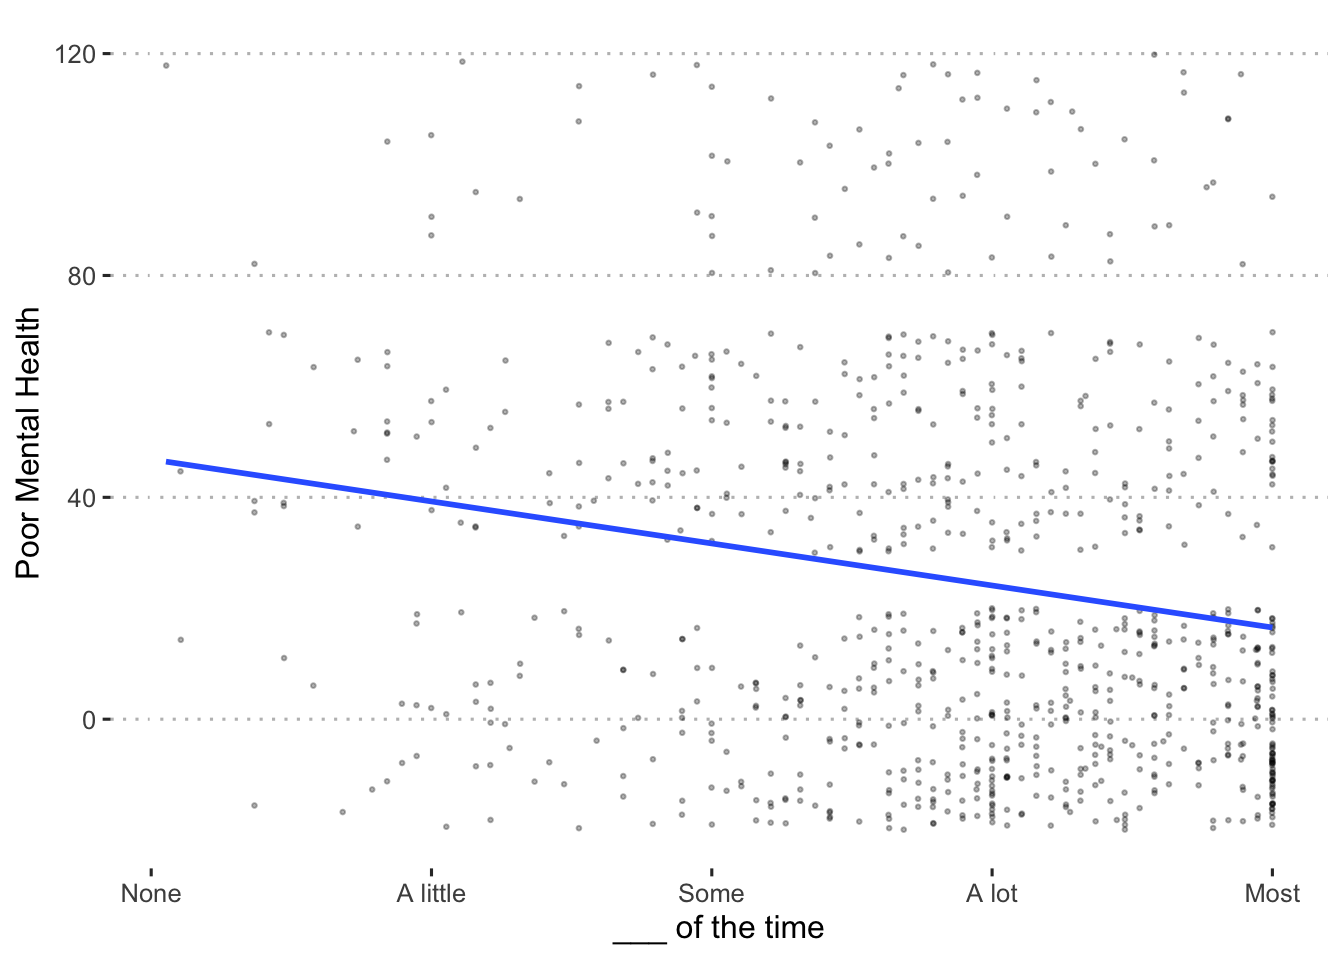 $summary
Income
| term | estimate | std.error | statistic | p.value |
|---|---|---|---|---|
| (Intercept) | 51.76 | 6.13 | 8.44 | < .001 |
| poverty150Low Income | 6.44 | 10.22 | 0.63 | .528 |
| prior.support | -7.05 | 1.51 | -4.67 | < .001 |
| poverty150Low Income:prior.support | -1.01 | 2.71 | -0.37 | .710 |
Race
| term | estimate | std.error | statistic | p.value |
|---|---|---|---|---|
| (Intercept) | 37.39 | 60.18 | 0.62 | .535 |
| race_cat2 | -5.16 | 64.36 | -0.08 | .936 |
| race_cat3 | 7.53 | 61.67 | 0.12 | .903 |
| race_cat4 | 11.00 | 64.94 | 0.17 | .866 |
| race_cat5 | 12.61 | 114.78 | 0.11 | .913 |
| race_cat6 | 11.76 | 61.87 | 0.19 | .849 |
| race_cat7 | 20.73 | 60.47 | 0.34 | .732 |
| prior.support | 9.02 | 18.10 | 0.50 | .618 |
| race_cat2:prior.support | -12.07 | 19.00 | -0.64 | .525 |
| race_cat3:prior.support | -13.88 | 18.46 | -0.75 | .452 |
| race_cat4:prior.support | -15.31 | 19.36 | -0.79 | .429 |
| race_cat5:prior.support | -9.02 | 31.68 | -0.28 | .776 |
| race_cat6:prior.support | -15.04 | 18.48 | -0.81 | .416 |
| race_cat7:prior.support | -17.55 | 18.16 | -0.97 | .334 |
Ethnicity
| term | estimate | std.error | statistic | p.value |
|---|---|---|---|---|
| (Intercept) | 54.37 | 5.55 | 9.80 | < .001 |
| latinxLatinx | -1.76 | 11.33 | -0.16 | .877 |
| prior.support | -7.76 | 1.39 | -5.60 | < .001 |
| latinxLatinx:prior.support | 1.57 | 2.92 | 0.54 | .591 |
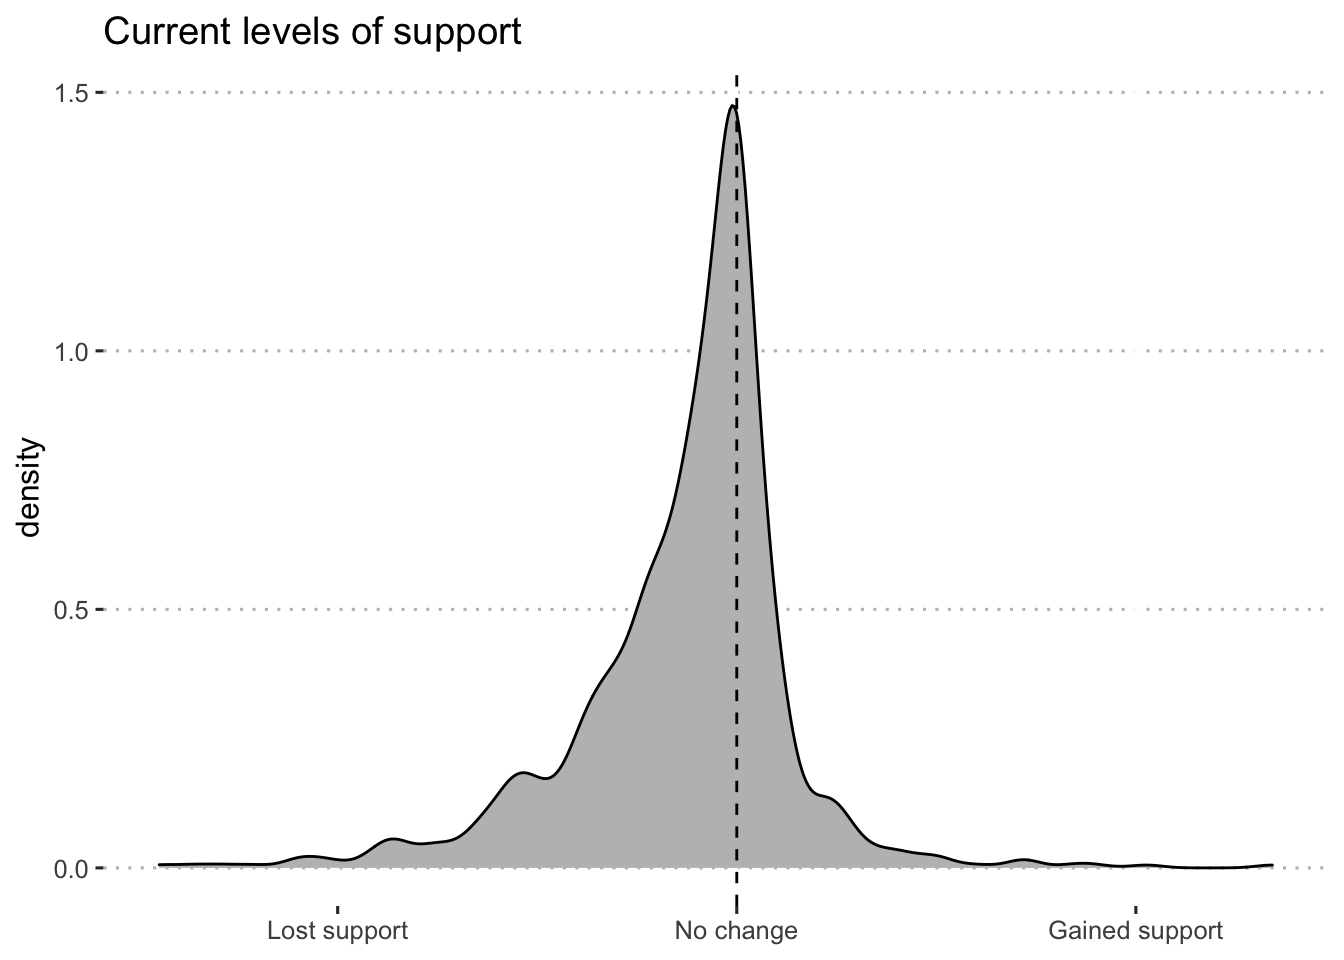
Change in social support
Distribution
By Income
| group1 | group2 | p.value |
|---|---|---|
| Low Income | High Income | .979 |
By Race
| group1 | group2 | p.value |
|---|---|---|
| Asian | American Indian/Alaska Native | > .999 |
| Black/African American | American Indian/Alaska Native | > .999 |
| Black/African American | Asian | > .999 |
| Multiple races | American Indian/Alaska Native | > .999 |
| Multiple races | Asian | > .999 |
| Multiple races | Black/African American | > .999 |
| Native Hawaiian/Pacific Islander | American Indian/Alaska Native | > .999 |
| Native Hawaiian/Pacific Islander | Asian | > .999 |
| Native Hawaiian/Pacific Islander | Black/African American | > .999 |
| Native Hawaiian/Pacific Islander | Multiple races | > .999 |
| Other race | American Indian/Alaska Native | > .999 |
| Other race | Asian | > .999 |
| Other race | Black/African American | > .999 |
| Other race | Multiple races | > .999 |
| Other race | Native Hawaiian/Pacific Islander | > .999 |
| White/Caucasian | American Indian/Alaska Native | > .999 |
| White/Caucasian | Asian | > .999 |
| White/Caucasian | Black/African American | > .999 |
| White/Caucasian | Multiple races | > .999 |
| White/Caucasian | Native Hawaiian/Pacific Islander | > .999 |
| White/Caucasian | Other race | > .999 |
By Ethnicity
| group1 | group2 | p.value |
|---|---|---|
| Latinx | Not Latinx | .658 |
Caregiver Wellbeing
Overall
$plot 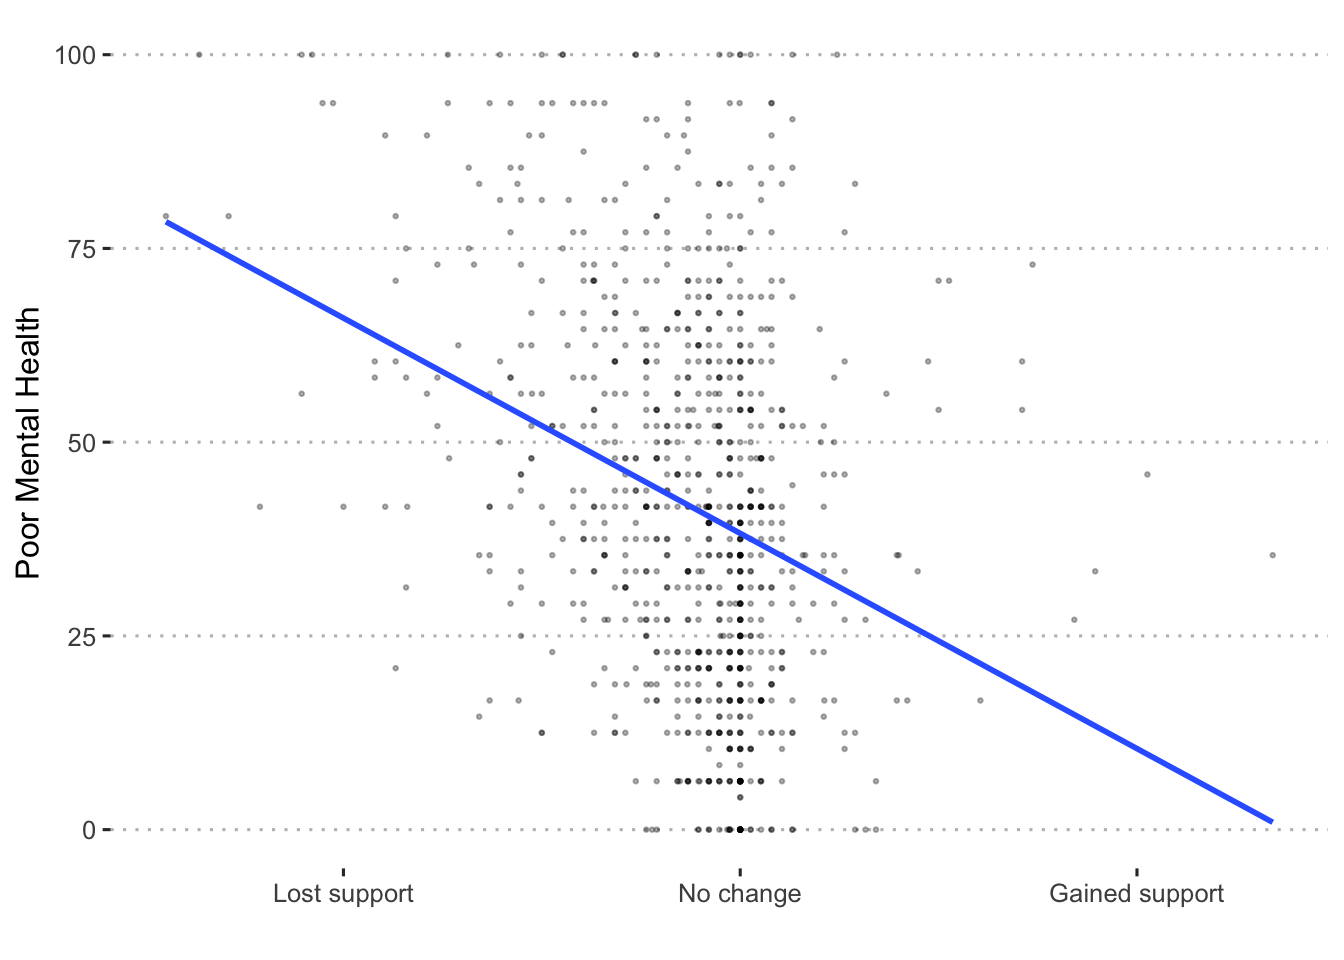 $summary
Income
$plot 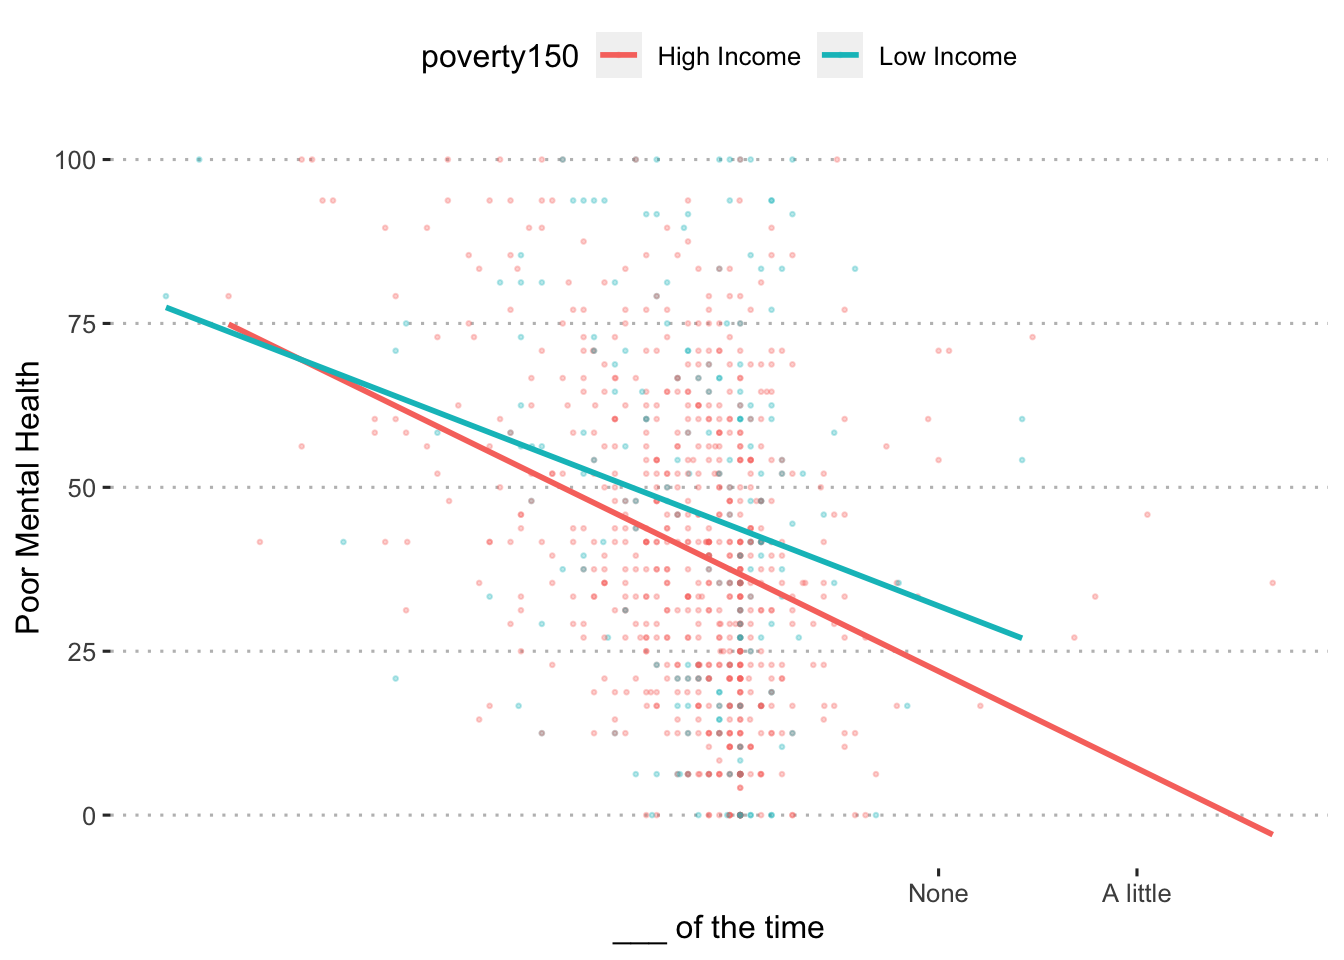 $summary
Race
$plot 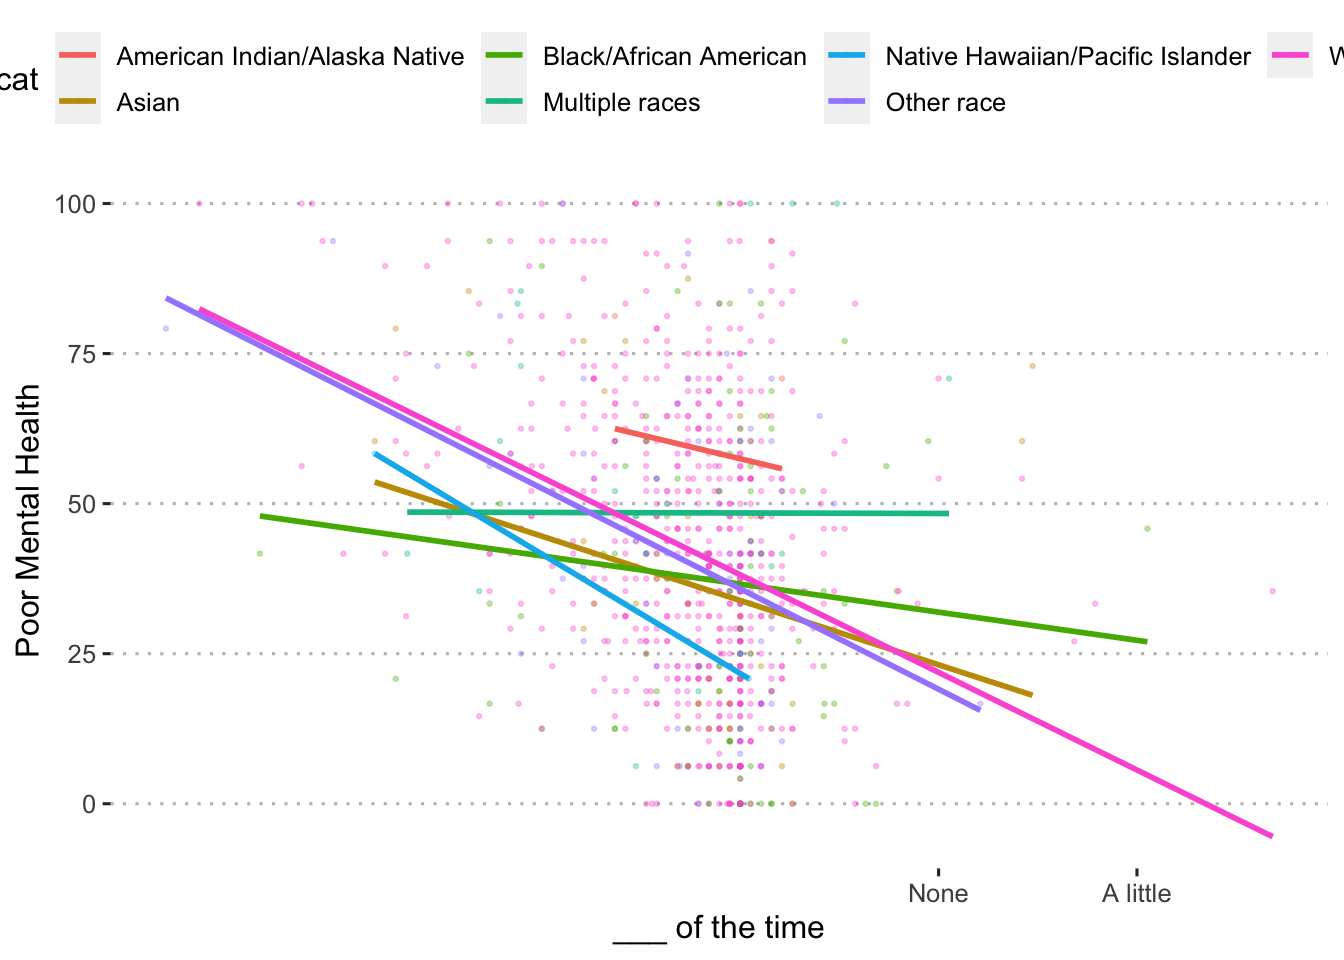 $summary
Ethnicity
$plot 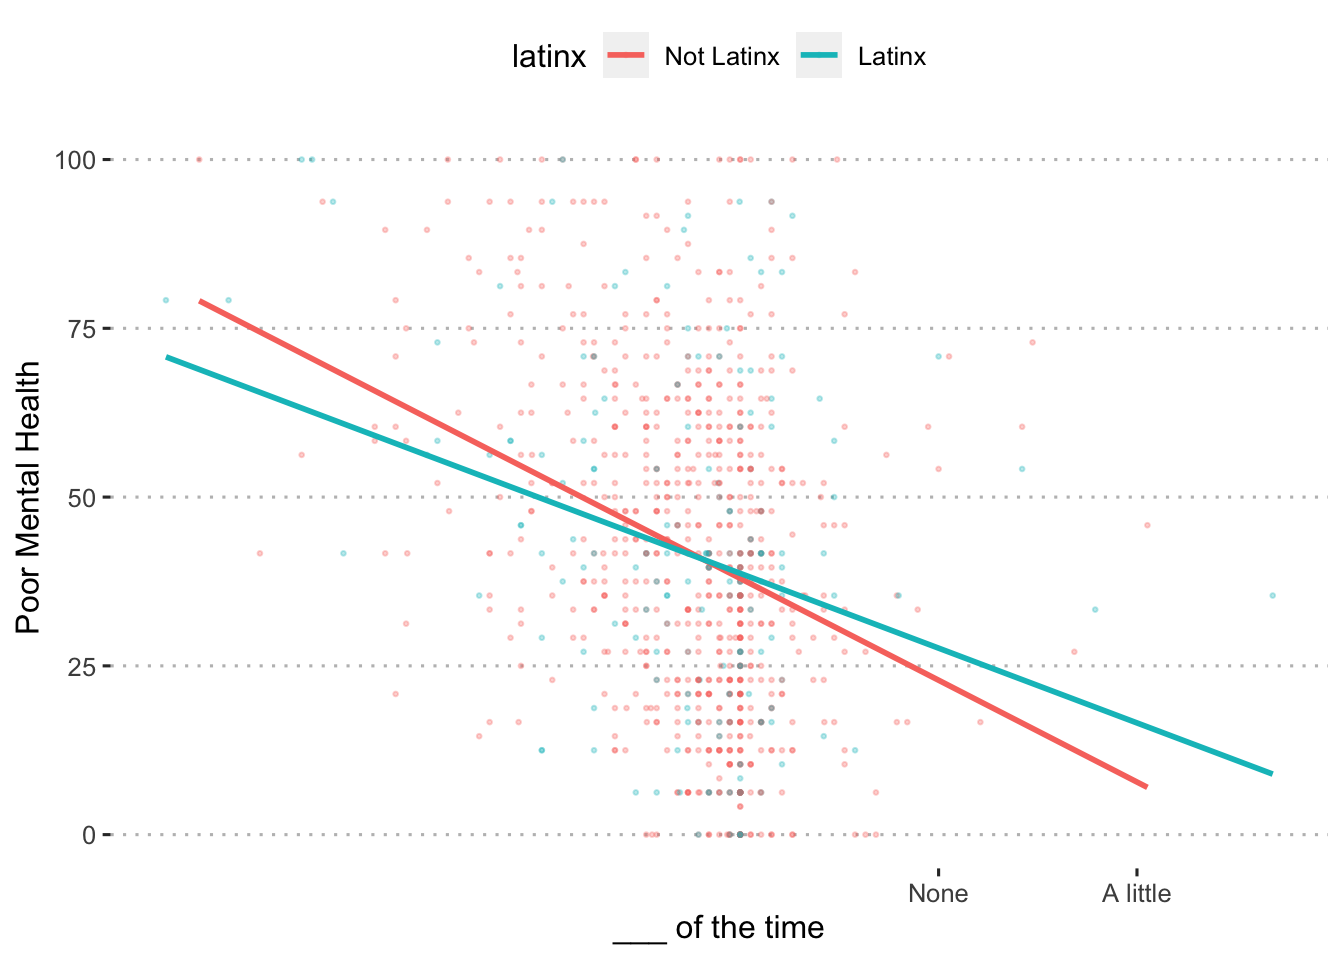 $summary
Child Externalizing
Overall
$plot 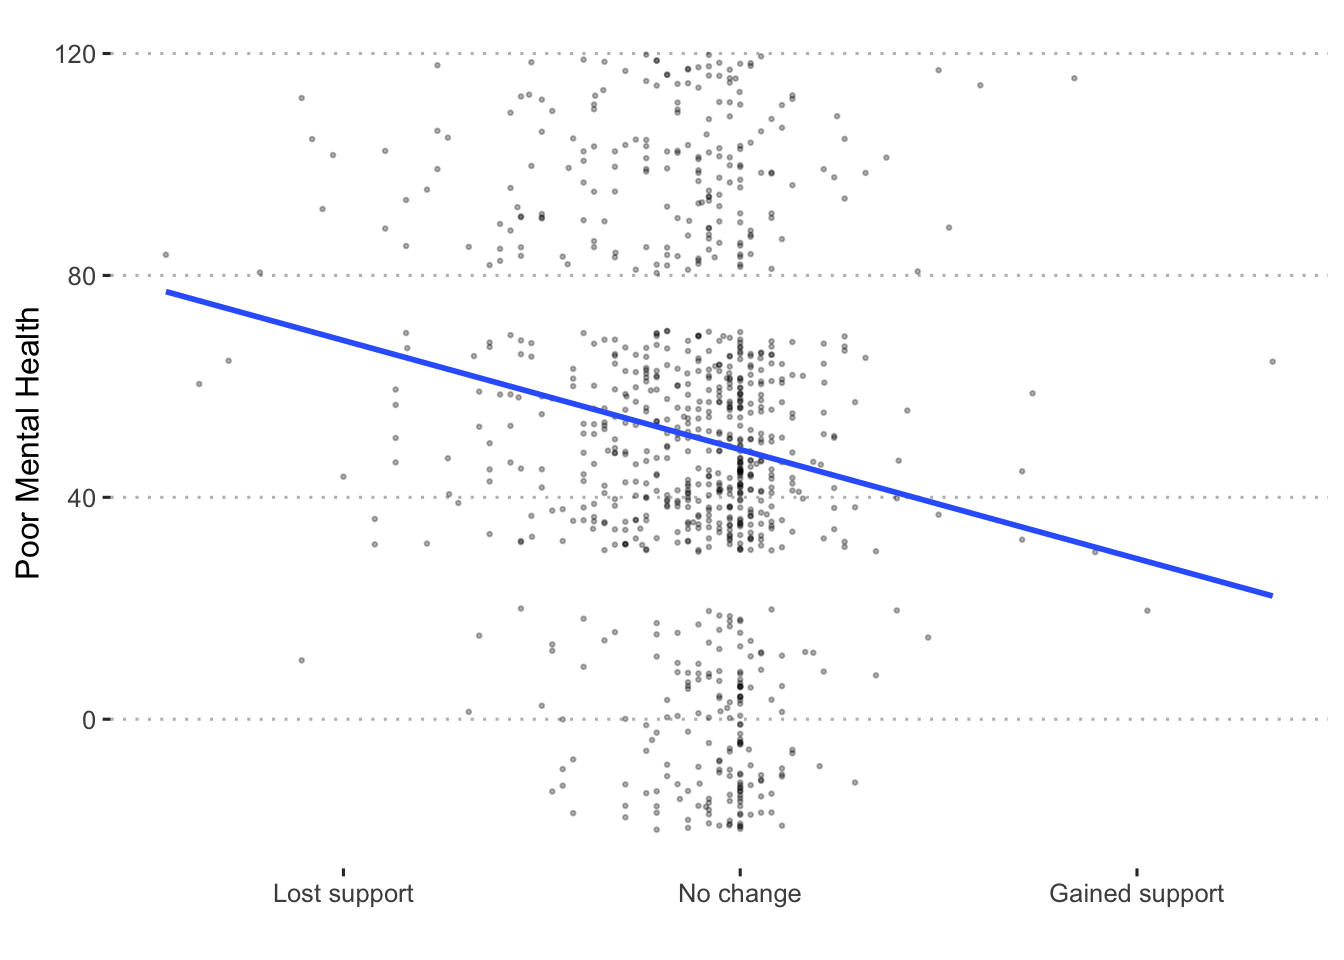 $summary
Income
$plot 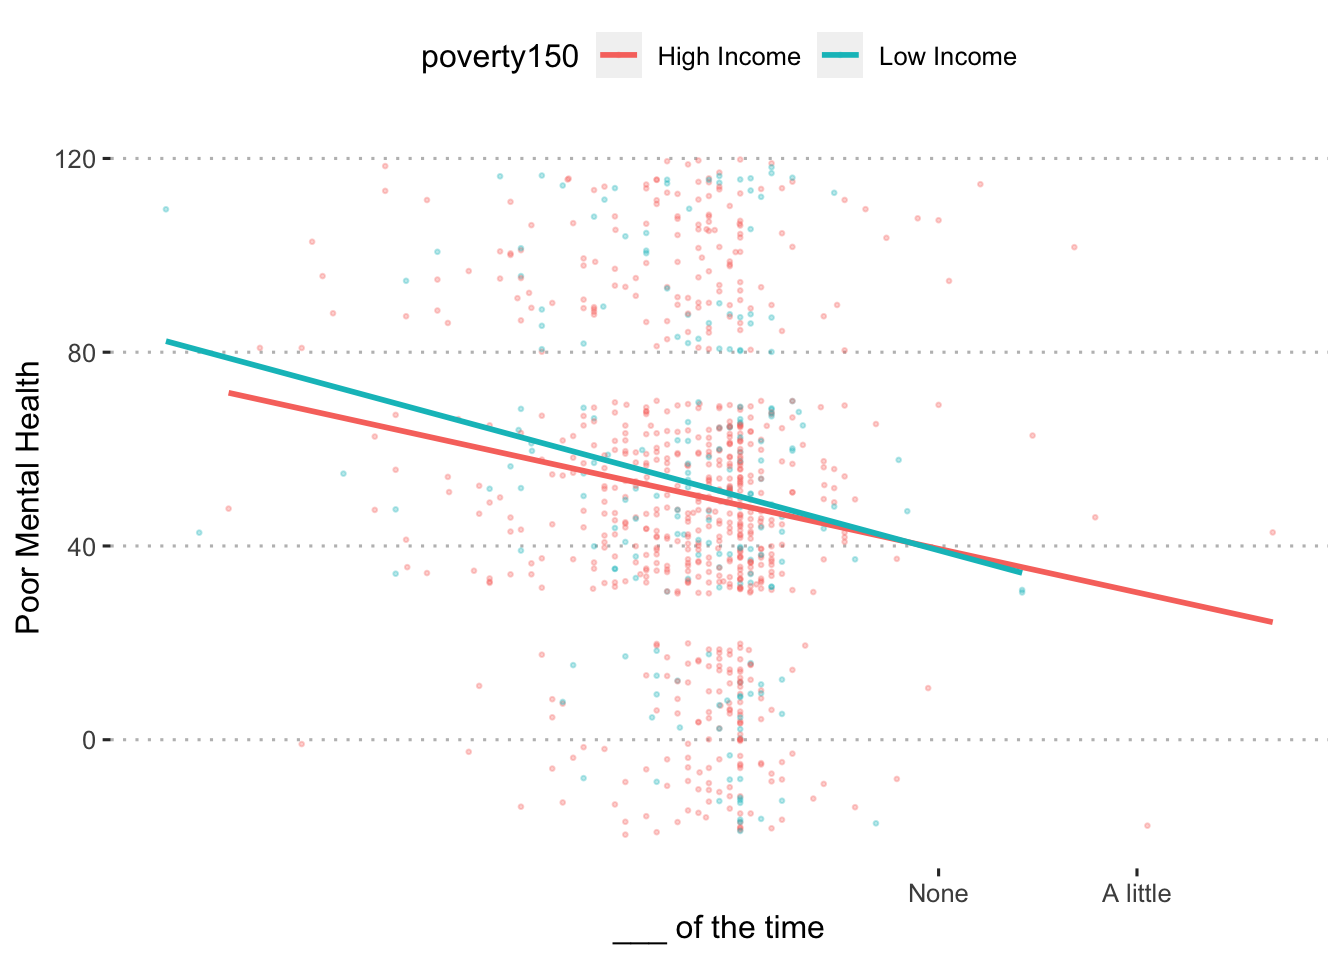 $summary
Race
$plot 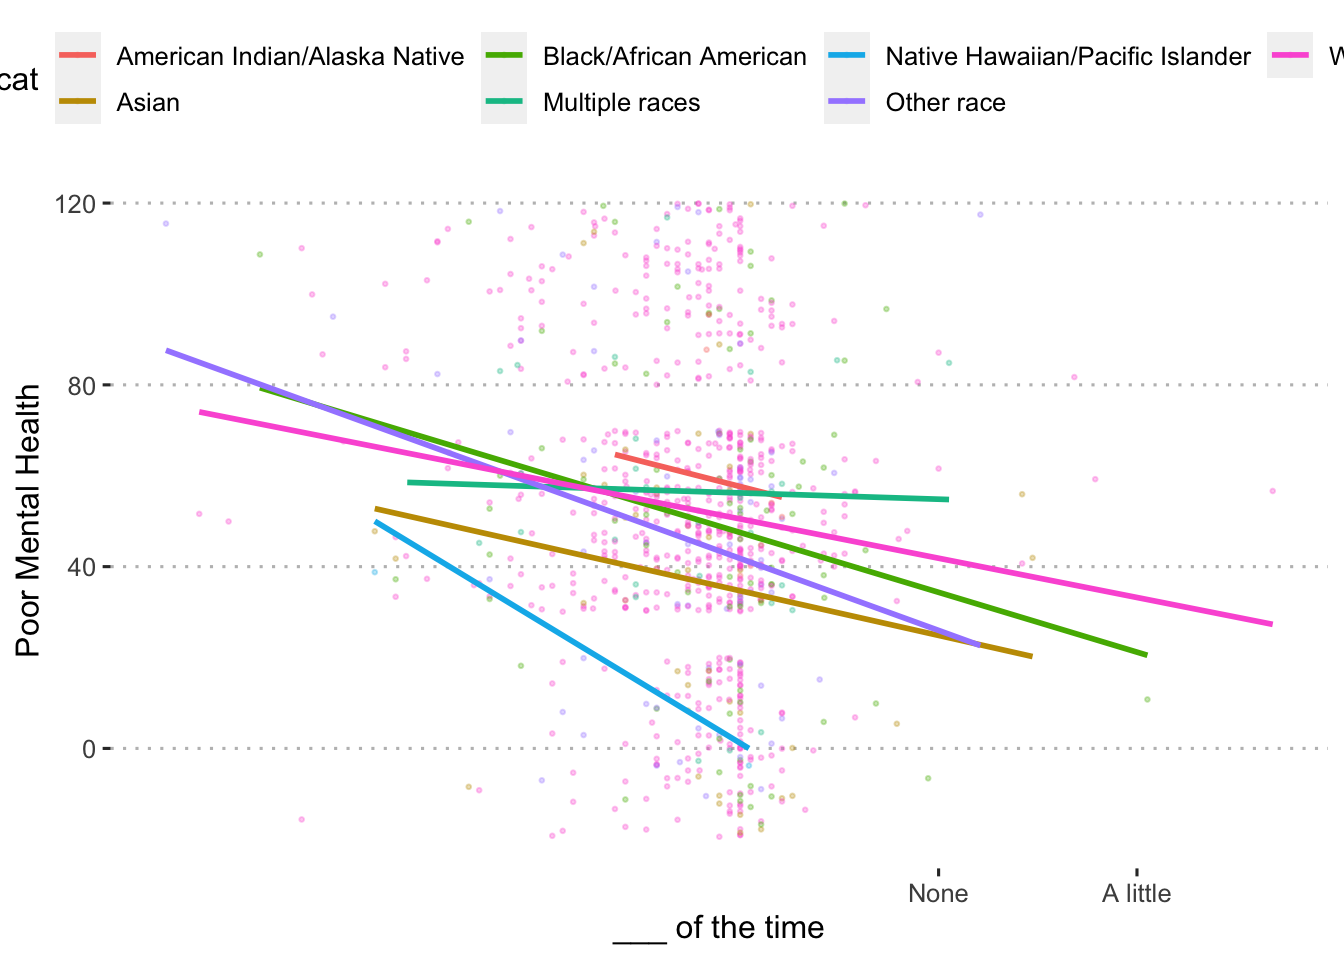 $summary
Ethnicity
$plot 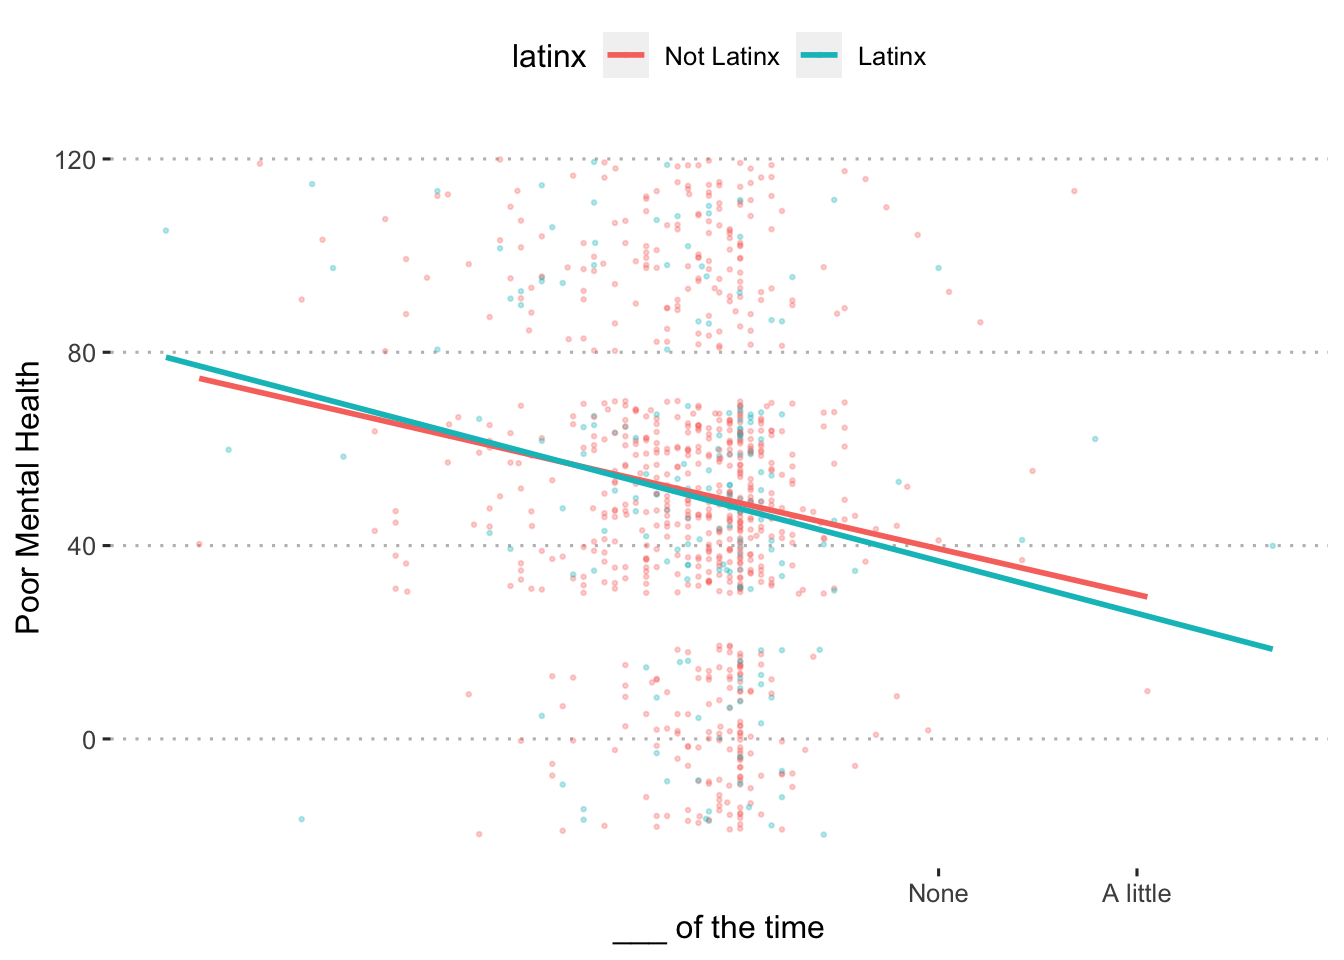 $summary
Child Internalizing
Overall
$plot  $summary
Income
$plot 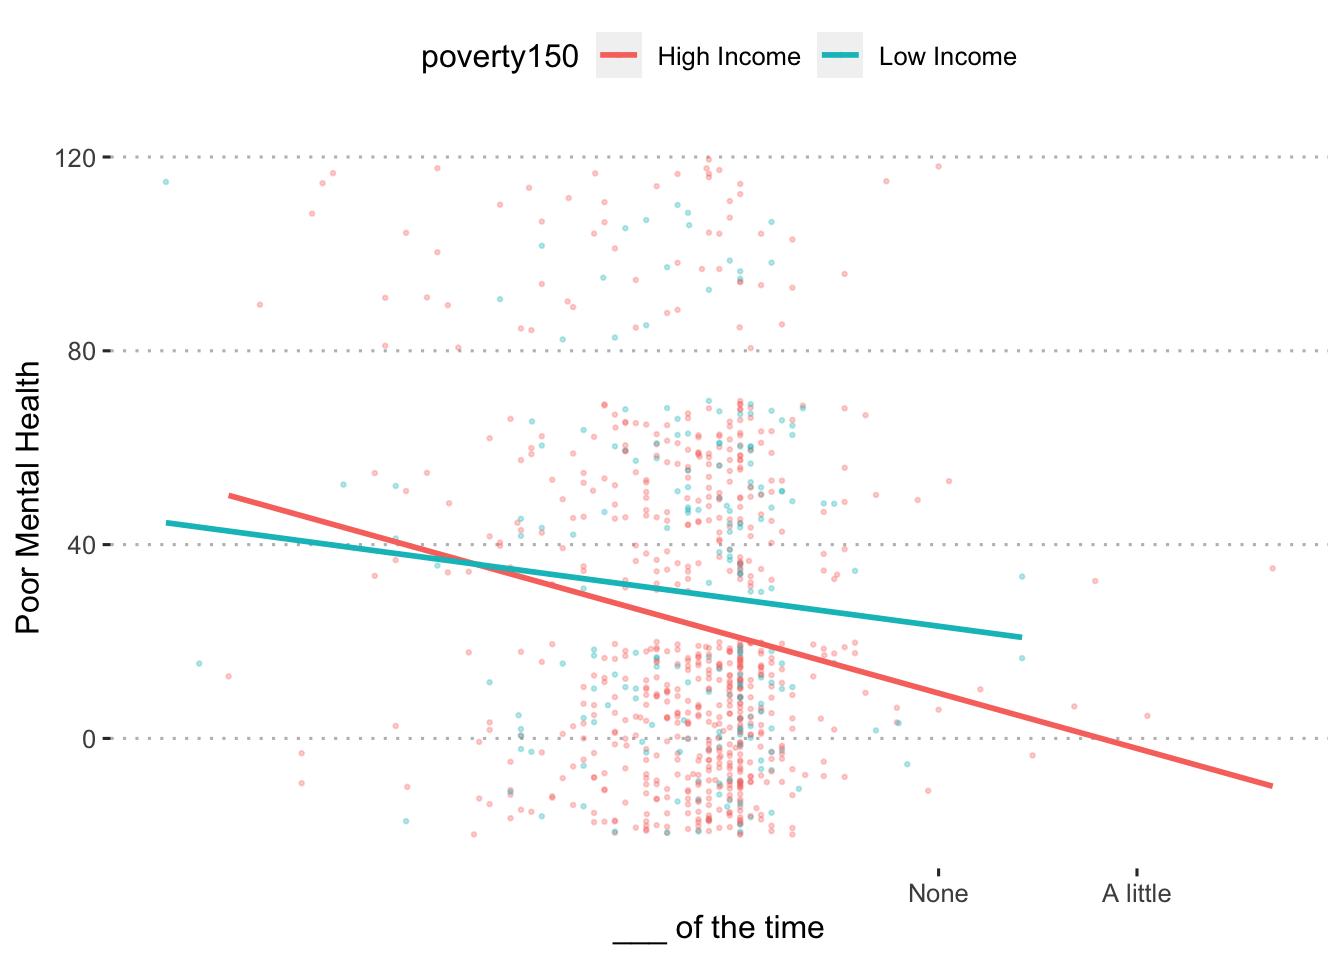 $summary
Race
$plot 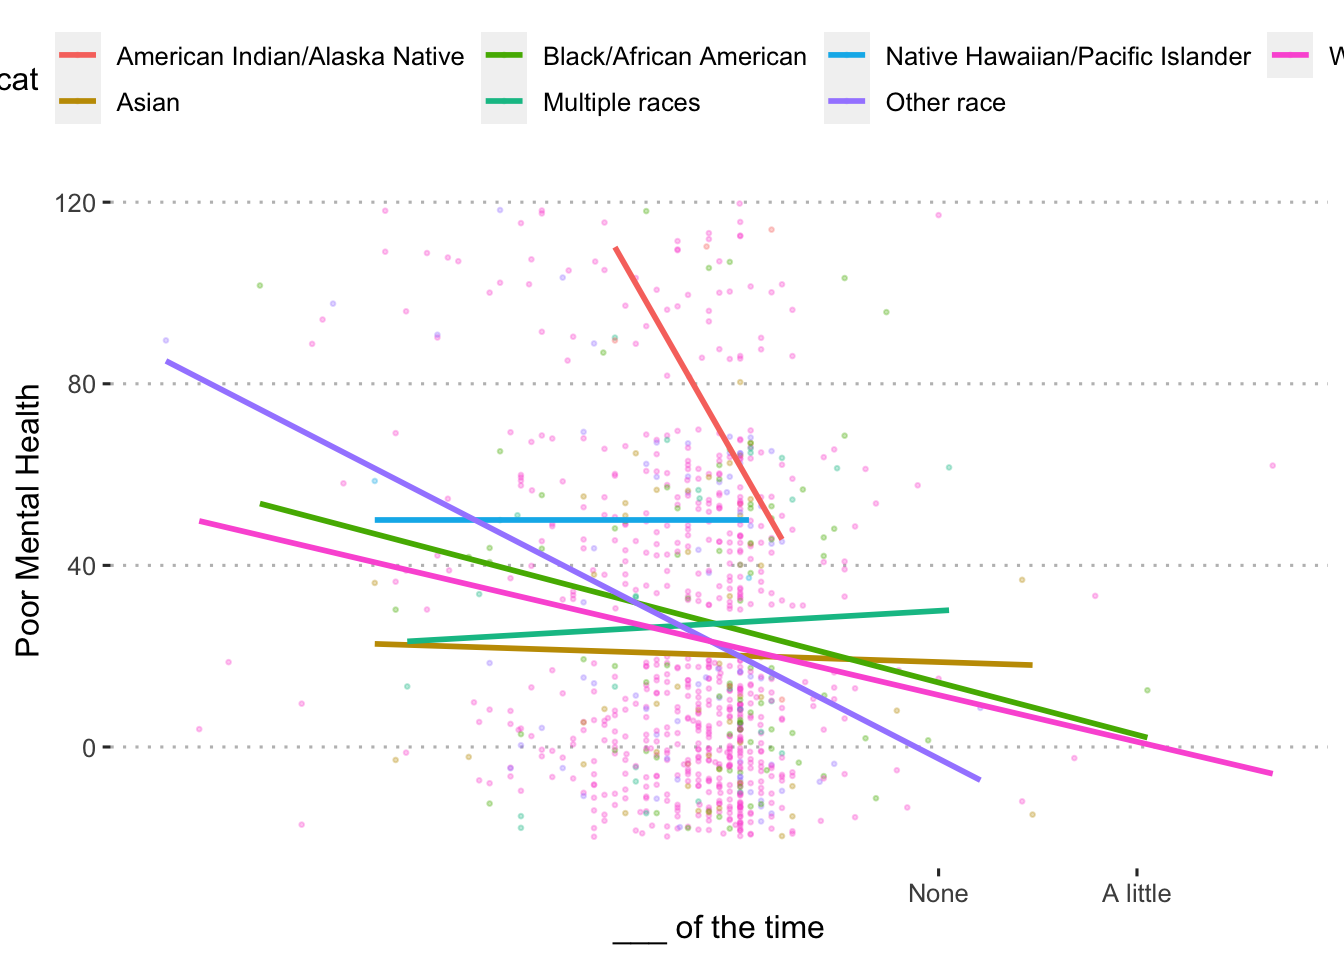 $summary
Ethnicity
$plot 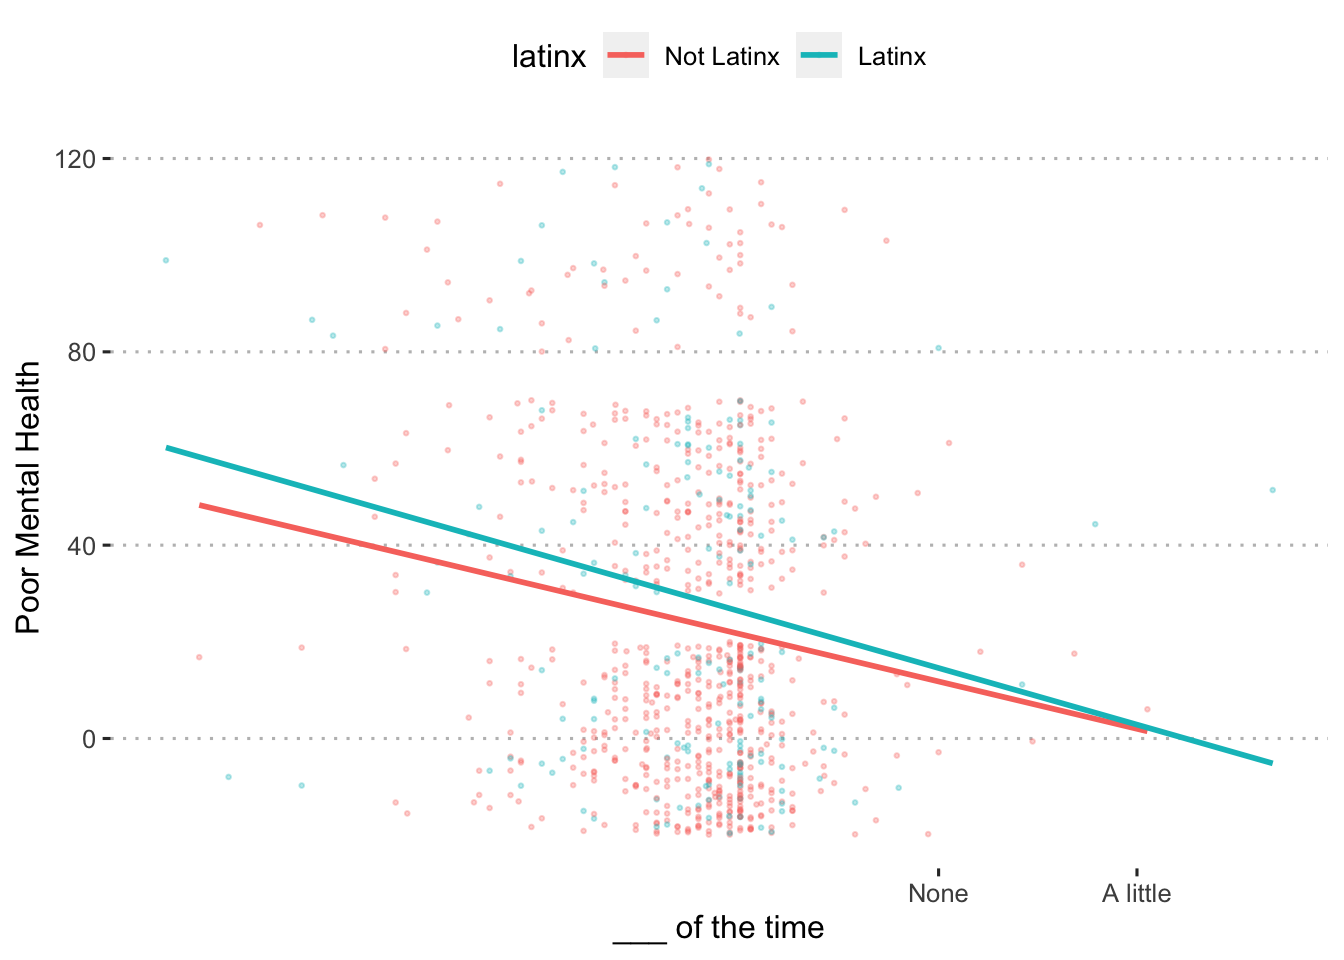 $summary
Sources of support
Note that for single caregivers, responses to “partner/spouse” support are removed.
Current
Overall
Income
| Source | Est | Lower CI | Upper CI | t | p |
|---|---|---|---|---|---|
| Partner/Spouse | 0.06 | 0.00 | 0.13 | 2.04 | .301 |
| Child | -0.07 | -0.15 | 0.01 | -1.64 | .611 |
| Parent | 0.10 | 0.02 | 0.18 | 2.50 | .130 |
| Other relatives | 0.08 | 0.01 | 0.15 | 2.15 | .261 |
| Friend | 0.04 | -0.04 | 0.12 | 0.89 | > .999 |
| Neighbor | 0.04 | -0.01 | 0.10 | 1.48 | .694 |
| Co-worker | 0.11 | 0.06 | 0.16 | 4.36 | < .001 |
| Religious group | -0.01 | -0.05 | 0.03 | -0.56 | > .999 |
| Spiritual figure | 0.00 | -0.07 | 0.08 | 0.10 | > .999 |
| Parent support group | 0.06 | 0.01 | 0.12 | 2.26 | .222 |
| Health professional | 0.00 | -0.06 | 0.06 | 0.05 | > .999 |
Race
| source | Black-Asian | Multi-Asian | Multi-Black | Other-Asian | Other-Black | Other-Multi | White-Asian | White-Black | White-Multi | White-Other |
|---|---|---|---|---|---|---|---|---|---|---|
| Partner/Spouse | > .999 | > .999 | > .999 | > .999 | > .999 | > .999 | > .999 | > .999 | > .999 | > .999 |
| Child | > .999 | > .999 | > .999 | > .999 | > .999 | > .999 | > .999 | > .999 | > .999 | .084 |
| Parent | > .999 | > .999 | > .999 | > .999 | > .999 | > .999 | > .999 | > .999 | > .999 | > .999 |
| Other relatives | > .999 | > .999 | > .999 | > .999 | > .999 | > .999 | > .999 | > .999 | > .999 | > .999 |
| Friend | > .999 | > .999 | > .999 | > .999 | > .999 | > .999 | > .999 | > .999 | > .999 | > .999 |
| Neighbor | > .999 | > .999 | > .999 | > .999 | > .999 | > .999 | > .999 | > .999 | > .999 | > .999 |
| Co-worker | > .999 | > .999 | > .999 | > .999 | > .999 | > .999 | > .999 | > .999 | > .999 | > .999 |
| Religious group | > .999 | > .999 | > .999 | > .999 | > .999 | > .999 | > .999 | > .999 | > .999 | > .999 |
| Spiritual figure | > .999 | > .999 | > .999 | > .999 | > .999 | > .999 | > .999 | > .999 | > .999 | > .999 |
| Parent support group | > .999 | > .999 | > .999 | > .999 | > .999 | > .999 | > .999 | > .999 | > .999 | > .999 |
| Health professional | > .999 | > .999 | > .999 | > .999 | > .999 | > .999 | > .999 | > .999 | > .999 | > .999 |
Ethnicity
| Source | Est | Lower CI | Upper CI | t | p |
|---|---|---|---|---|---|
| Partner/Spouse | -0.02 | -0.08 | 0.03 | -0.93 | > .999 |
| Child | -0.18 | -0.26 | -0.10 | -4.51 | < .001 |
| Parent | -0.01 | -0.10 | 0.07 | -0.32 | > .999 |
| Other relatives | 0.05 | -0.03 | 0.13 | 1.28 | > .999 |
| Friend | 0.16 | 0.08 | 0.24 | 3.93 | .001 |
| Neighbor | 0.05 | -0.01 | 0.10 | 1.62 | .852 |
| Co-worker | 0.04 | -0.02 | 0.10 | 1.17 | > .999 |
| Religious group | 0.00 | -0.05 | 0.04 | -0.16 | > .999 |
| Spiritual figure | 0.01 | -0.06 | 0.09 | 0.36 | > .999 |
| Parent support group | 0.06 | 0.01 | 0.12 | 2.24 | .234 |
| Health professional | 0.03 | -0.03 | 0.09 | 0.99 | > .999 |
Prior
Overall
Income
| Source | Est | Lower CI | Upper CI | t | p |
|---|---|---|---|---|---|
| Partner/Spouse | 0.07 | 0.00 | 0.13 | 2.10 | .336 |
| Child | -0.03 | -0.11 | 0.05 | -0.75 | > .999 |
| Parent | 0.08 | 0.00 | 0.16 | 2.01 | .363 |
| Other relatives | 0.00 | -0.08 | 0.08 | -0.05 | > .999 |
| Friend | 0.13 | 0.06 | 0.20 | 3.65 | .003 |
| Neighbor | 0.06 | 0.00 | 0.13 | 1.88 | .429 |
| Co-worker | 0.20 | 0.13 | 0.28 | 5.34 | < .001 |
| Religious group | -0.02 | -0.09 | 0.05 | -0.45 | > .999 |
| Spiritual figure | -0.06 | -0.14 | 0.01 | -1.63 | .629 |
| Parent support group | 0.01 | -0.06 | 0.09 | 0.38 | > .999 |
| Health professional | -0.02 | -0.09 | 0.05 | -0.53 | > .999 |
Race
| source | Black-Asian | Multi-Asian | Multi-Black | Other-Asian | Other-Black | Other-Multi | White-Asian | White-Black | White-Multi | White-Other |
|---|---|---|---|---|---|---|---|---|---|---|
| Partner/Spouse | > .999 | > .999 | > .999 | > .999 | > .999 | > .999 | > .999 | > .999 | > .999 | > .999 |
| Child | > .999 | > .999 | > .999 | > .999 | > .999 | > .999 | > .999 | > .999 | > .999 | > .999 |
| Parent | > .999 | > .999 | > .999 | > .999 | > .999 | > .999 | > .999 | > .999 | > .999 | > .999 |
| Other relatives | > .999 | > .999 | > .999 | > .999 | > .999 | > .999 | > .999 | > .999 | > .999 | > .999 |
| Friend | > .999 | > .999 | > .999 | > .999 | > .999 | > .999 | > .999 | > .999 | > .999 | > .999 |
| Neighbor | > .999 | > .999 | > .999 | > .999 | > .999 | > .999 | > .999 | > .999 | > .999 | > .999 |
| Co-worker | > .999 | > .999 | > .999 | > .999 | > .999 | > .999 | > .999 | > .999 | > .999 | > .999 |
| Religious group | > .999 | > .999 | > .999 | > .999 | > .999 | > .999 | > .999 | > .999 | > .999 | > .999 |
| Spiritual figure | > .999 | > .999 | > .999 | > .999 | > .999 | > .999 | > .999 | > .999 | > .999 | > .999 |
| Parent support group | > .999 | > .999 | > .999 | > .999 | > .999 | > .999 | > .999 | > .999 | > .999 | > .999 |
| Health professional | > .999 | > .999 | > .999 | > .999 | > .999 | > .999 | > .999 | > .999 | > .999 | > .999 |
Ethnicity
| Source | Est | Lower CI | Upper CI | t | p |
|---|---|---|---|---|---|
| Partner/Spouse | 0.08 | 0.02 | 0.15 | 2.43 | .160 |
| Child | -0.10 | -0.19 | -0.02 | -2.36 | .160 |
| Parent | 0.01 | -0.07 | 0.09 | 0.15 | > .999 |
| Other relatives | -0.10 | -0.18 | -0.02 | -2.39 | .160 |
| Friend | 0.13 | 0.05 | 0.20 | 3.33 | .011 |
| Neighbor | -0.06 | -0.13 | 0.02 | -1.49 | .958 |
| Co-worker | 0.02 | -0.06 | 0.11 | 0.50 | > .999 |
| Religious group | -0.04 | -0.11 | 0.04 | -0.93 | > .999 |
| Spiritual figure | -0.05 | -0.14 | 0.03 | -1.31 | > .999 |
| Parent support group | -0.02 | -0.10 | 0.06 | -0.43 | > .999 |
| Health professional | 0.03 | -0.05 | 0.10 | 0.71 | > .999 |
Change
Overall
Income
| source | statistic | p.value |
|---|---|---|
| Partner/Spouse | 8.29 | .323 |
| Child | 4.58 | .821 |
| Parent | 6.41 | .654 |
| Other relatives | 5.42 | .718 |
| Friend | 17.31 | .005 |
| Neighbor | 3.69 | .892 |
| Co-worker | 28.79 | < .001 |
| Religious group | 0.56 | > .999 |
| Spiritual figure | 18.00 | .004 |
| Parent support group | 6.15 | .654 |
| Health professional | 1.39 | > .999 |
Race
| source | statistic | p.value |
|---|---|---|
| Partner/Spouse | 8.29 | .323 |
| Child | 4.58 | .821 |
| Parent | 6.41 | .654 |
| Other relatives | 5.42 | .718 |
| Friend | 17.31 | .005 |
| Neighbor | 3.69 | .892 |
| Co-worker | 28.79 | < .001 |
| Religious group | 0.56 | > .999 |
| Spiritual figure | 18.00 | .004 |
| Parent support group | 6.15 | .654 |
| Health professional | 1.39 | > .999 |
Ethnicity
| source | statistic | p.value |
|---|---|---|
| Partner/Spouse | 20.19 | .001 |
| Child | 32.40 | < .001 |
| Parent | 16.86 | .005 |
| Other relatives | 16.54 | .005 |
| Friend | 24.38 | < .001 |
| Neighbor | 11.12 | .055 |
| Co-worker | 4.17 | .487 |
| Religious group | 1.30 | .729 |
| Spiritual figure | 18.12 | .003 |
| Parent support group | 9.20 | .107 |
| Health professional | 7.72 | .157 |