Representativeness disclaimer
These analyses are based on responses collected from 8867 caregivers between the dates of April 06, 2020 and December 03, 2020. These caregivers represent a range of voices: 8.70% are Black/African American, 16.61% are LatinX, and 29.25% live at or below 1.5 times the federal poverty line. Proportions/percentages are calculated based on the item-level response rates, not out of the total sample size. The data for these analyses are not weighted.
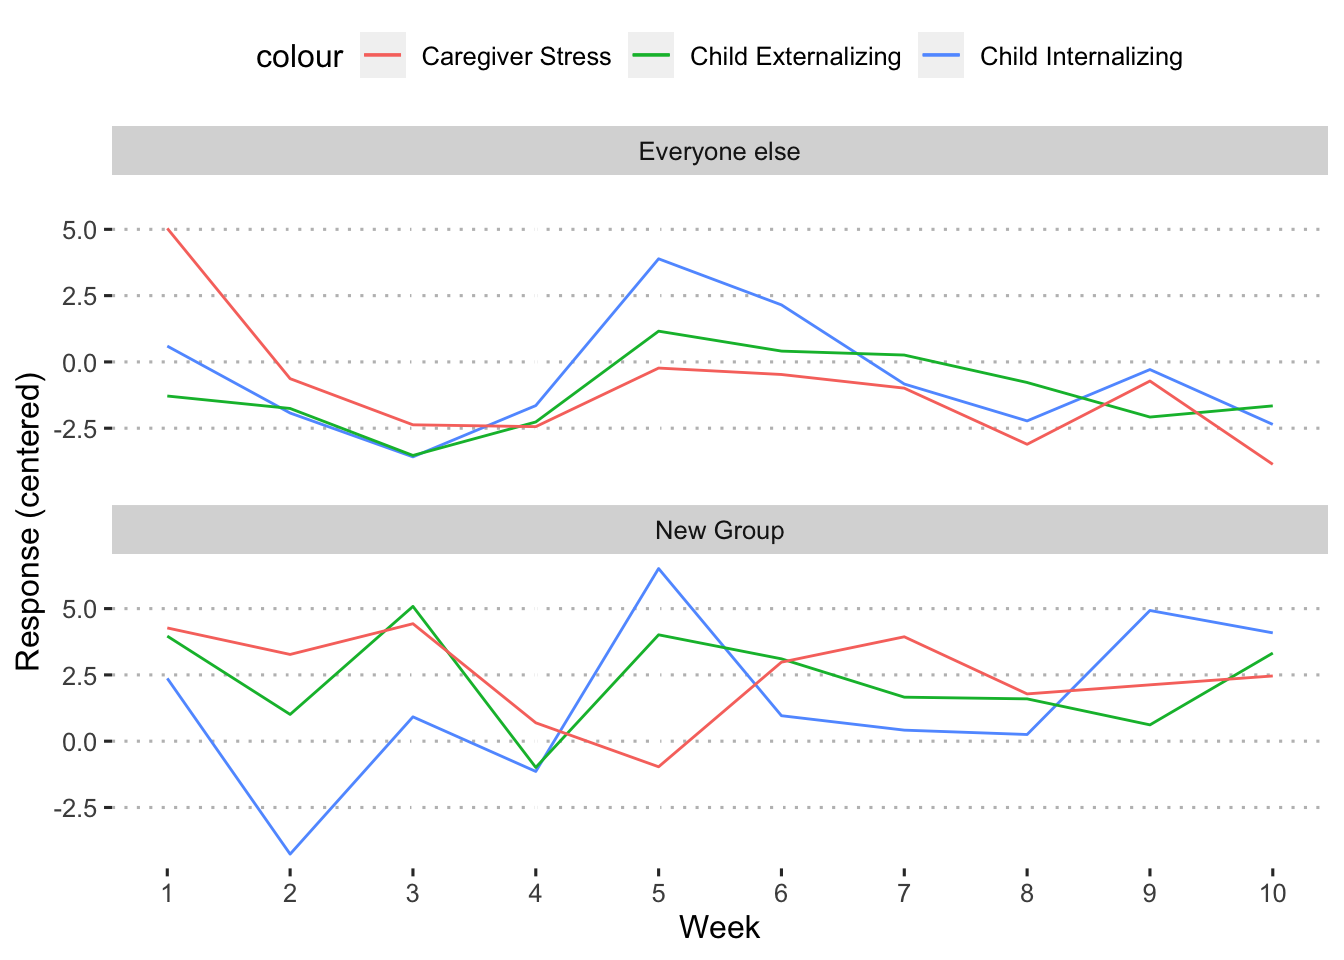
Descriptives
##
##  Descriptive statistics by group
## group: 1
##                      vars   n  mean    sd  min   max range   se
## Week                    1 546  1.00  0.00    1   1.0     0 0.00
## insurance               2 545  0.90  0.30    0   1.0     1 0.01
## child_insurance         3 545  0.88  0.33    0   1.0     1 0.01
## support_decrease        4 528  0.40  0.49    0   1.0     1 0.02
## lost_free_lunch         5 546  0.11  0.31    0   1.0     1 0.01
## employment_decreased    6 479  0.40  0.49    0   1.0     1 0.02
## losejob_sickleave       7 414  0.21  0.41    0   1.0     1 0.02
## income_decreaed         8 545  0.49  0.50    0   1.0     1 0.02
## difficulty_basics       9 546  0.21  0.41    0   1.0     1 0.02
## anxiety                10 546 43.38 33.14    0 100.0   100 1.42
## conflict_child         11 546  -Inf   NaN -Inf   5.0   Inf  NaN
## conflict_parent        12 546  -Inf   NaN -Inf   5.0   Inf  NaN
## conflict_total         13 546  -Inf   NaN -Inf   4.3   Inf  NaN
## depress                14 543 29.93 29.55    0 100.0   100 1.27
## fear                   15 524 25.95 33.22    0 100.0   100 1.45
## fussy                  16 538 53.44 36.00    0 100.0   100 1.55
## lonely                 17 543 43.32 30.68    0 100.0   100 1.32
## stress                 18 546 57.97 33.40    0 100.0   100 1.43
## ---------------------------------------------------------------------------------
## group: 2
##                      vars   n  mean    sd  min   max range   se
## Week                    1 658  2.00  0.00    2   2.0     0 0.00
## insurance               2 657  0.90  0.30    0   1.0     1 0.01
## child_insurance         3 656  0.88  0.32    0   1.0     1 0.01
## support_decrease        4 506  0.46  0.50    0   1.0     1 0.02
## lost_free_lunch         5 658  0.09  0.29    0   1.0     1 0.01
## employment_decreased    6 565  0.38  0.49    0   1.0     1 0.02
## losejob_sickleave       7 498  0.22  0.41    0   1.0     1 0.02
## income_decreaed         8 658  0.46  0.50    0   1.0     1 0.02
## difficulty_basics       9 658  0.17  0.38    0   1.0     1 0.01
## anxiety                10 658 40.65 31.48    0 100.0   100 1.23
## conflict_child         11 658  -Inf   NaN -Inf   5.0   Inf  NaN
## conflict_parent        12 658  -Inf   NaN -Inf   5.0   Inf  NaN
## conflict_total         13 658  -Inf   NaN -Inf   4.5   Inf  NaN
## depress                14 657 30.67 28.78    0 100.0   100 1.12
## fear                   15 637 24.33 33.12    0 100.0   100 1.31
## fussy                  16 648 49.15 35.32    0 100.0   100 1.39
## lonely                 17 657 42.31 29.48    0 100.0   100 1.15
## stress                 18 658 54.29 32.55    0 100.0   100 1.27
## ---------------------------------------------------------------------------------
## group: 3
##                      vars   n  mean    sd  min    max range   se
## Week                    1 599  3.00  0.00    3   3.00     0 0.00
## insurance               2 598  0.91  0.28    0   1.00     1 0.01
## child_insurance         3 597  0.91  0.28    0   1.00     1 0.01
## support_decrease        4 408  0.45  0.50    0   1.00     1 0.02
## lost_free_lunch         5 599  0.08  0.26    0   1.00     1 0.01
## employment_decreased    6 523  0.37  0.48    0   1.00     1 0.02
## losejob_sickleave       7 460  0.16  0.37    0   1.00     1 0.02
## income_decreaed         8 598  0.46  0.50    0   1.00     1 0.02
## difficulty_basics       9 599  0.15  0.36    0   1.00     1 0.01
## anxiety                10 599 38.54 30.05    0 100.00   100 1.23
## conflict_child         11 599  -Inf   NaN -Inf   4.71   Inf  NaN
## conflict_parent        12 599  -Inf   NaN -Inf   4.00   Inf  NaN
## conflict_total         13 599  -Inf   NaN -Inf   4.50   Inf  NaN
## depress                14 599 30.19 29.52    0 100.00   100 1.21
## fear                   15 595 24.79 33.51    0 100.00   100 1.37
## fussy                  16 597 50.25 35.30    0 100.00   100 1.44
## lonely                 17 599 43.24 29.31    0 100.00   100 1.20
## stress                 18 599 53.59 32.55    0 100.00   100 1.33
## ---------------------------------------------------------------------------------
## group: 4
##                      vars   n  mean    sd  min   max range   se
## Week                    1 526  4.00  0.00    4   4.0     0 0.00
## insurance               2 525  0.93  0.25    0   1.0     1 0.01
## child_insurance         3 524  0.92  0.27    0   1.0     1 0.01
## support_decrease        4 292  0.38  0.49    0   1.0     1 0.03
## lost_free_lunch         5 526  0.05  0.22    0   1.0     1 0.01
## employment_decreased    6 449  0.35  0.48    0   1.0     1 0.02
## losejob_sickleave       7 383  0.16  0.37    0   1.0     1 0.02
## income_decreaed         8 525  0.43  0.50    0   1.0     1 0.02
## difficulty_basics       9 526  0.11  0.31    0   1.0     1 0.01
## anxiety                10 526 37.71 30.38    0 100.0   100 1.32
## conflict_child         11 526  -Inf   NaN -Inf   5.0   Inf  NaN
## conflict_parent        12 526  -Inf   NaN -Inf   5.0   Inf  NaN
## conflict_total         13 526  -Inf   NaN -Inf   4.5   Inf  NaN
## depress                14 524 29.29 28.86    0 100.0   100 1.26
## fear                   15 525 23.05 31.84    0 100.0   100 1.39
## fussy                  16 525 50.57 35.22    0 100.0   100 1.54
## lonely                 17 526 42.87 28.35    0 100.0   100 1.24
## stress                 18 526 51.81 32.35    0 100.0   100 1.41
## ---------------------------------------------------------------------------------
## group: 5
##                      vars   n  mean    sd  min   max range   se
## Week                    1 536  5.00  0.00    5   5.0     0 0.00
## insurance               2 536  0.95  0.21    0   1.0     1 0.01
## child_insurance         3 536  0.95  0.22    0   1.0     1 0.01
## support_decrease        4 334  0.54  0.50    0   1.0     1 0.03
## lost_free_lunch         5 536  0.06  0.24    0   1.0     1 0.01
## employment_decreased    6 464  0.36  0.48    0   1.0     1 0.02
## losejob_sickleave       7 384  0.13  0.34    0   1.0     1 0.02
## income_decreaed         8 533  0.43  0.50    0   1.0     1 0.02
## difficulty_basics       9 536  0.09  0.29    0   1.0     1 0.01
## anxiety                10 536 37.50 30.39    0 100.0   100 1.31
## conflict_child         11 536  -Inf   NaN -Inf   5.0   Inf  NaN
## conflict_parent        12 536  -Inf   NaN -Inf   5.0   Inf  NaN
## conflict_total         13 536  -Inf   NaN -Inf   4.5   Inf  NaN
## depress                14 536 26.43 26.51    0 100.0   100 1.15
## fear                   15 535 26.82 33.59    0 100.0   100 1.45
## fussy                  16 535 56.64 34.05    0 100.0   100 1.47
## lonely                 17 536 47.01 27.35    0 100.0   100 1.18
## stress                 18 536 52.85 32.86    0 100.0   100 1.42
## ---------------------------------------------------------------------------------
## group: 6
##                      vars   n  mean    sd  min   max range   se
## Week                    1 649  6.00  0.00    6   6.0     0 0.00
## insurance               2 647  0.94  0.24    0   1.0     1 0.01
## child_insurance         3 648  0.95  0.23    0   1.0     1 0.01
## support_decrease        4 264  0.48  0.50    0   1.0     1 0.03
## lost_free_lunch         5 649  0.04  0.19    0   1.0     1 0.01
## employment_decreased    6 547  0.33  0.47    0   1.0     1 0.02
## losejob_sickleave       7 450  0.16  0.36    0   1.0     1 0.02
## income_decreaed         8 649  0.41  0.49    0   1.0     1 0.02
## difficulty_basics       9 649  0.10  0.30    0   1.0     1 0.01
## anxiety                10 649 37.57 30.20    0 100.0   100 1.19
## conflict_child         11 649  -Inf   NaN -Inf   5.0   Inf  NaN
## conflict_parent        12 649  -Inf   NaN -Inf   5.0   Inf  NaN
## conflict_total         13 649  -Inf   NaN -Inf   4.6   Inf  NaN
## depress                14 649 29.66 29.19    0 100.0   100 1.15
## fear                   15 644 26.09 33.96    0 100.0   100 1.34
## fussy                  16 645 53.88 35.14    0 100.0   100 1.38
## lonely                 17 649 45.65 27.24    0 100.0   100 1.07
## stress                 18 649 53.78 32.23    0 100.0   100 1.27
## ---------------------------------------------------------------------------------
## group: 7
##                      vars   n  mean    sd  min   max range   se
## Week                    1 792  7.00  0.00    7   7.0     0 0.00
## insurance               2 792  0.94  0.25    0   1.0     1 0.01
## child_insurance         3 791  0.96  0.19    0   1.0     1 0.01
## support_decrease        4 280  0.48  0.50    0   1.0     1 0.03
## lost_free_lunch         5 792  0.03  0.17    0   1.0     1 0.01
## employment_decreased    6 667  0.34  0.48    0   1.0     1 0.02
## losejob_sickleave       7 579  0.15  0.36    0   1.0     1 0.01
## income_decreaed         8 792  0.39  0.49    0   1.0     1 0.02
## difficulty_basics       9 792  0.12  0.32    0   1.0     1 0.01
## anxiety                10 792 37.88 30.47    0 100.0   100 1.08
## conflict_child         11 792  -Inf   NaN -Inf   5.0   Inf  NaN
## conflict_parent        12 792  -Inf   NaN -Inf   5.0   Inf  NaN
## conflict_total         13 792  -Inf   NaN -Inf   4.6   Inf  NaN
## depress                14 792 28.49 27.41    0 100.0   100 0.97
## fear                   15 792 25.57 32.58    0 100.0   100 1.16
## fussy                  16 792 51.58 33.55    0 100.0   100 1.19
## lonely                 17 792 44.19 27.16    0 100.0   100 0.96
## stress                 18 792 53.66 31.49    0 100.0   100 1.12
## ---------------------------------------------------------------------------------
## group: 8
##                      vars   n  mean    sd  min   max range   se
## Week                    1 893  8.00  0.00    8   8.0     0 0.00
## insurance               2 888  0.94  0.24    0   1.0     1 0.01
## child_insurance         3 889  0.95  0.21    0   1.0     1 0.01
## support_decrease        4 261  0.48  0.50    0   1.0     1 0.03
## lost_free_lunch         5 893  0.03  0.17    0   1.0     1 0.01
## employment_decreased    6 749  0.37  0.48    0   1.0     1 0.02
## losejob_sickleave       7 618  0.18  0.39    0   1.0     1 0.02
## income_decreaed         8 893  0.42  0.49    0   1.0     1 0.02
## difficulty_basics       9 893  0.13  0.33    0   1.0     1 0.01
## anxiety                10 893 35.65 29.31    0 100.0   100 0.98
## conflict_child         11 893  -Inf   NaN -Inf   5.0   Inf  NaN
## conflict_parent        12 893  -Inf   NaN -Inf   5.0   Inf  NaN
## conflict_total         13 893  -Inf   NaN -Inf   4.6   Inf  NaN
## depress                14 893 27.06 26.82    0 100.0   100 0.90
## fear                   15 892 24.89 31.83    0 100.0   100 1.07
## fussy                  16 892 50.62 33.70    0 100.0   100 1.13
## lonely                 17 893 44.37 27.09    0 100.0   100 0.91
## stress                 18 893 51.71 31.49    0 100.0   100 1.05
## ---------------------------------------------------------------------------------
## group: 9
##                      vars    n  mean    sd  min   max range   se
## Week                    1 1035  9.00  0.00    9   9.0   0.0 0.00
## insurance               2 1035  0.94  0.25    0   1.0   1.0 0.01
## child_insurance         3 1034  0.96  0.20    0   1.0   1.0 0.01
## support_decrease        4  310  0.39  0.49    0   1.0   1.0 0.03
## lost_free_lunch         5 1035  0.04  0.19    0   1.0   1.0 0.01
## employment_decreased    6  881  0.37  0.48    0   1.0   1.0 0.02
## losejob_sickleave       7  725  0.17  0.38    0   1.0   1.0 0.01
## income_decreaed         8 1032  0.42  0.49    0   1.0   1.0 0.02
## difficulty_basics       9 1035  0.12  0.33    0   1.0   1.0 0.01
## anxiety                10 1035 40.72 31.37    0 100.0 100.0 0.98
## conflict_child         11 1035  1.68  1.08    0   5.0   5.0 0.03
## conflict_parent        12 1035  -Inf   NaN -Inf   5.0   Inf  NaN
## conflict_total         13 1035  1.51  0.95    0   4.6   4.6 0.03
## depress                14 1035 27.57 27.53    0 100.0 100.0 0.86
## fear                   15 1034 23.69 32.03    0 100.0 100.0 1.00
## fussy                  16 1034 53.43 33.22    0 100.0 100.0 1.03
## lonely                 17 1035 45.51 26.37    0 100.0 100.0 0.82
## stress                 18 1035 53.45 32.61    0 100.0 100.0 1.01
## ---------------------------------------------------------------------------------
## group: 10
##                      vars   n  mean    sd  min max range   se
## Week                    1 976 10.00  0.00   10  10     0 0.00
## insurance               2 976  0.94  0.24    0   1     1 0.01
## child_insurance         3 976  0.95  0.23    0   1     1 0.01
## support_decrease        4 241  0.39  0.49    0   1     1 0.03
## lost_free_lunch         5 976  0.03  0.16    0   1     1 0.01
## employment_decreased    6 850  0.38  0.48    0   1     1 0.02
## losejob_sickleave       7 697  0.22  0.41    0   1     1 0.02
## income_decreaed         8 970  0.14  0.35    0   1     1 0.01
## difficulty_basics       9 976  0.14  0.34    0   1     1 0.01
## anxiety                10 976 36.68 30.13    0 100   100 0.96
## conflict_child         11 976  -Inf   NaN -Inf   5   Inf  NaN
## conflict_parent        12 976  -Inf   NaN -Inf   5   Inf  NaN
## conflict_total         13 976  -Inf   NaN -Inf   5   Inf  NaN
## depress                14 976 27.00 27.62    0 100   100 0.88
## fear                   15 976 24.80 31.86    0 100   100 1.02
## fussy                  16 976 51.69 32.81    0 100   100 1.05
## lonely                 17 975 44.82 27.64    0 100   100 0.89
## stress                 18 976 51.36 32.64    0 100   100 1.04
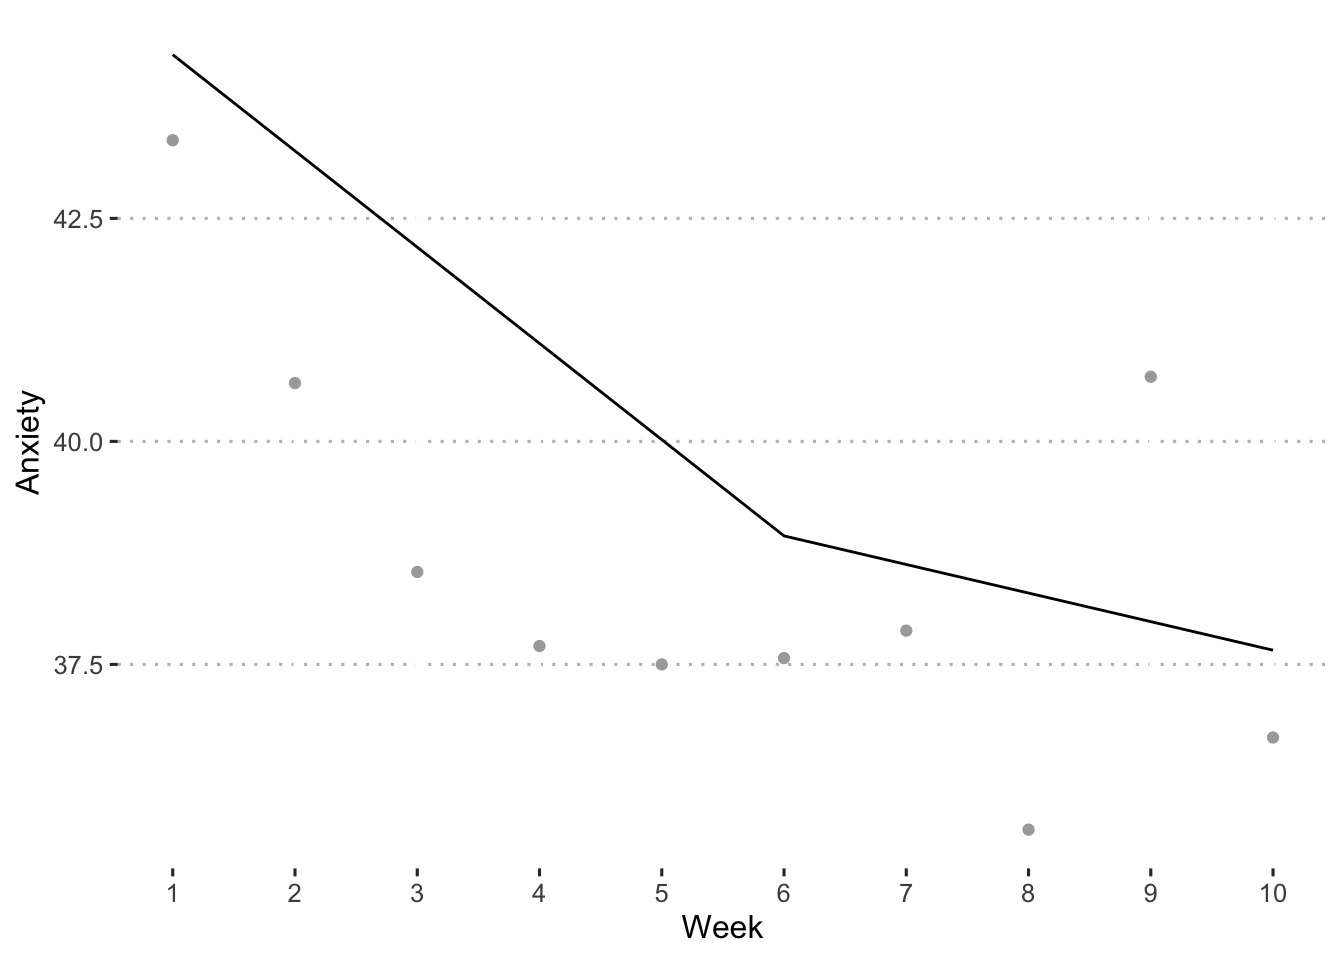
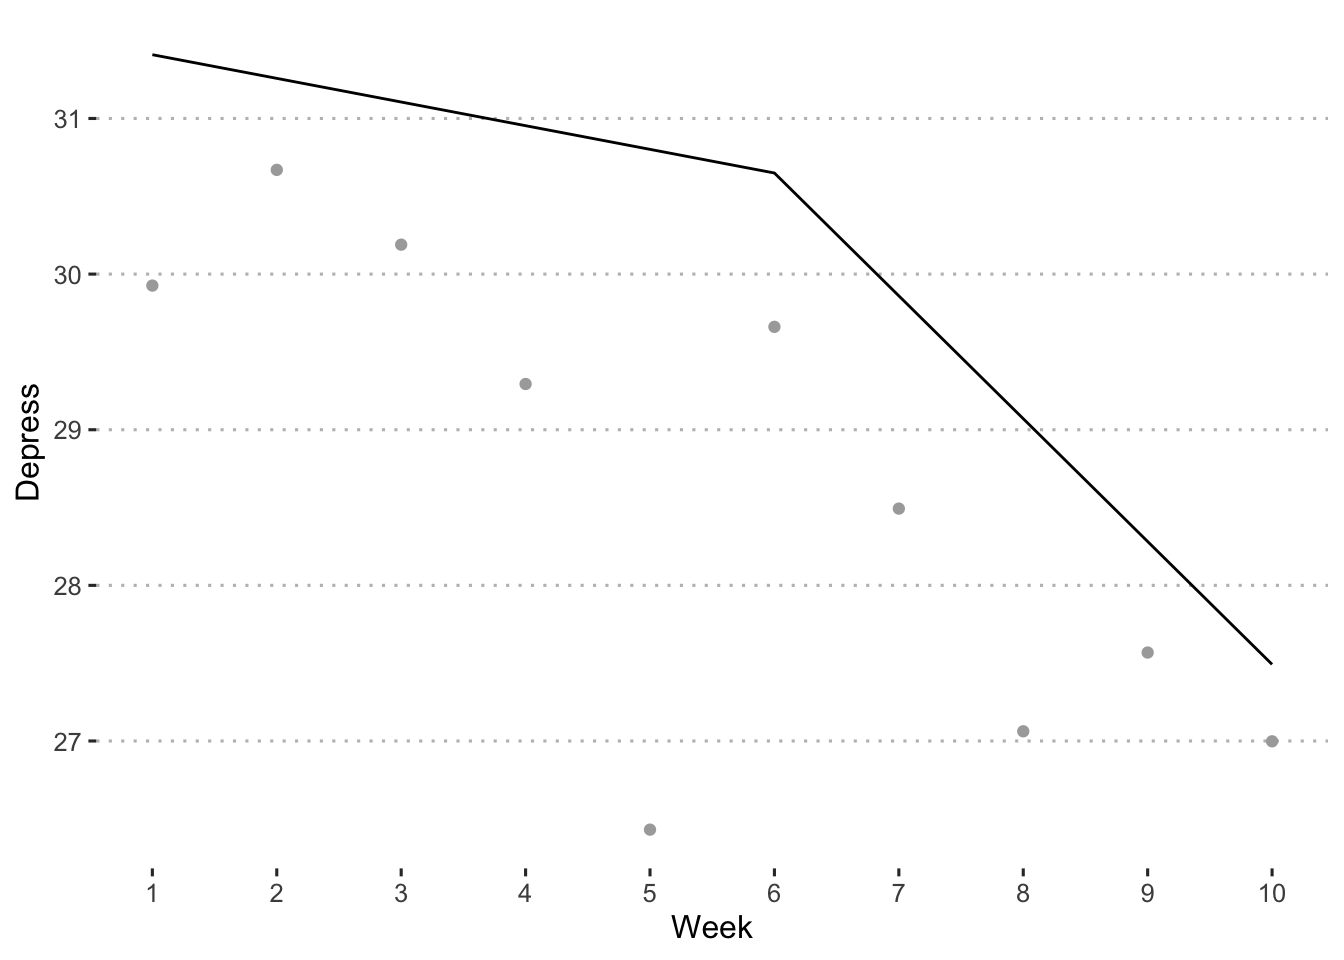
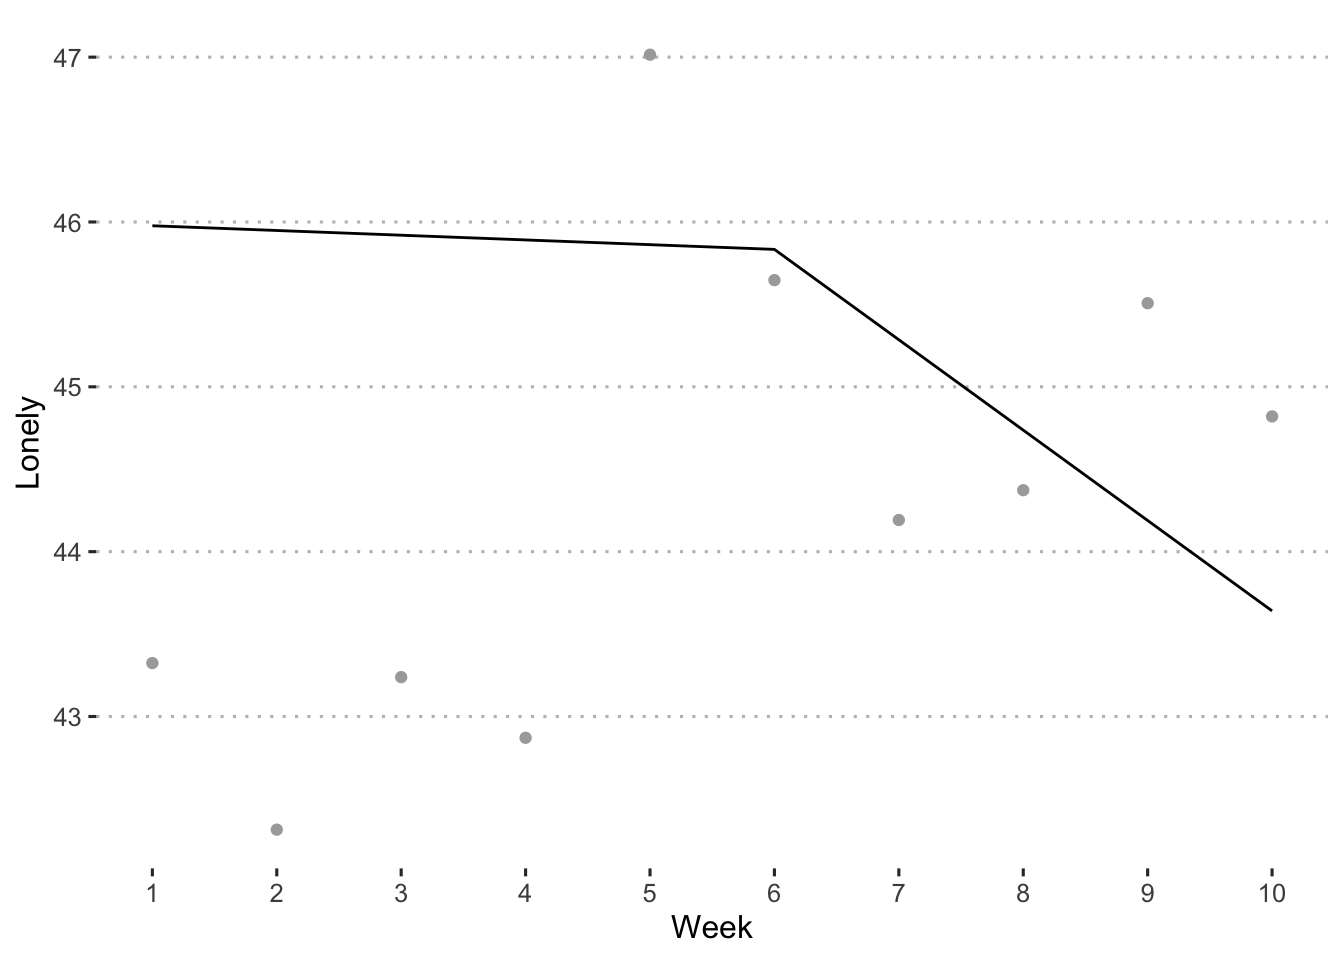
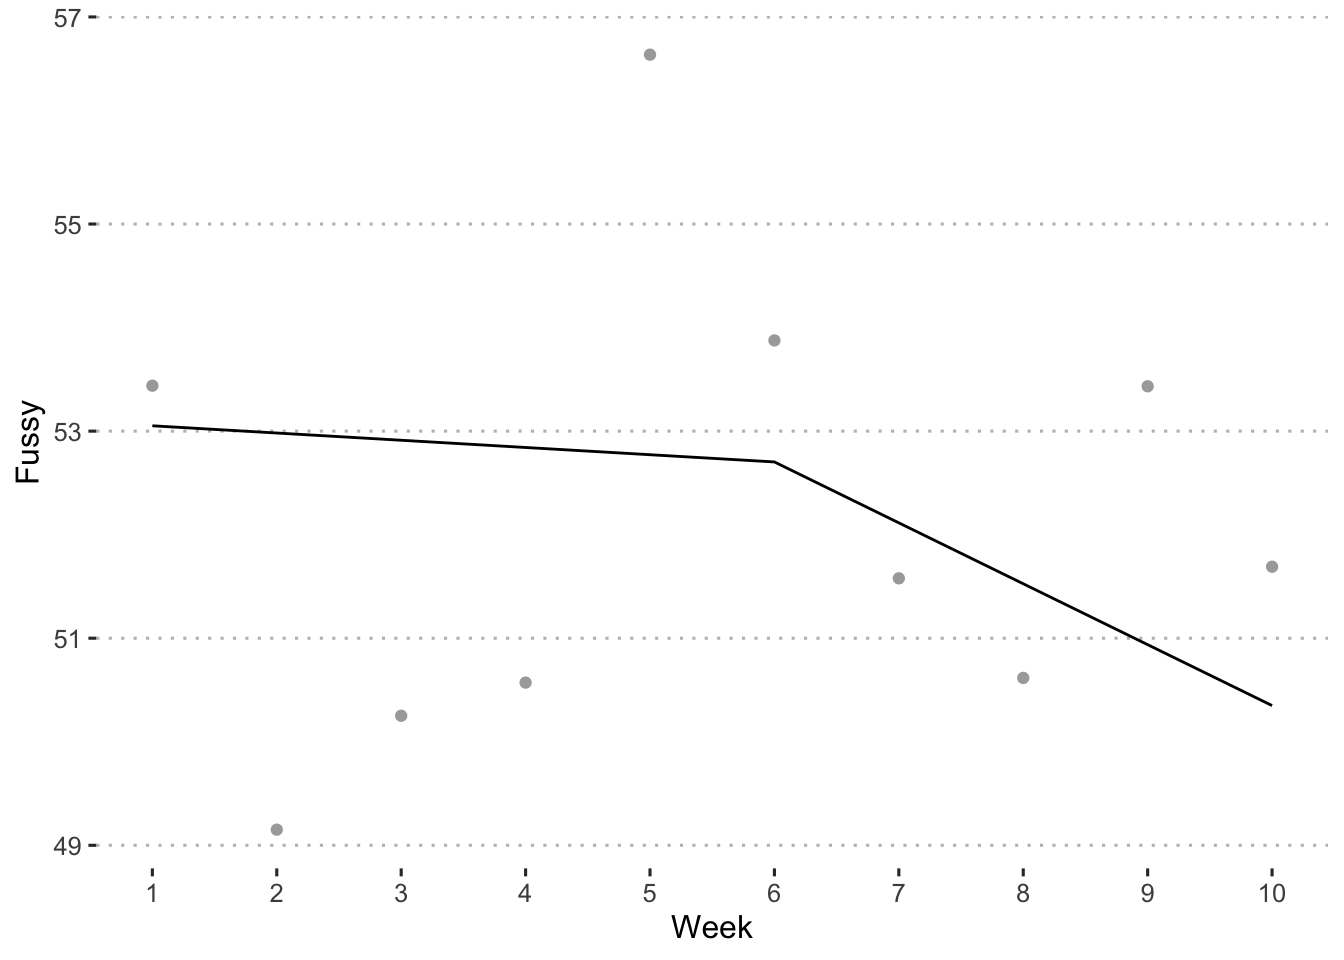
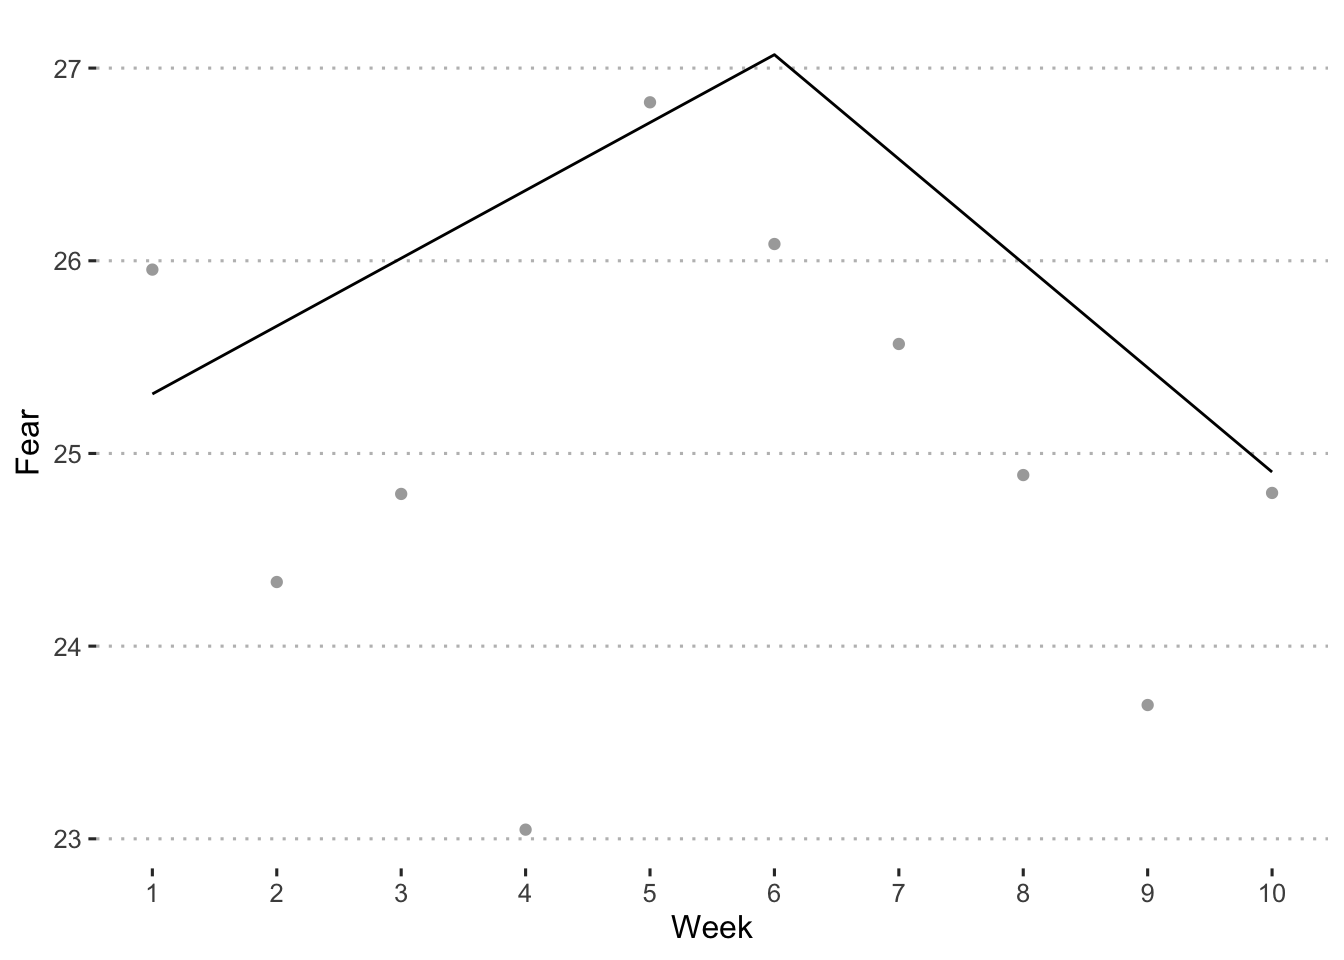
Spline models
Spline models are fit with nodes at Week 6; Week 7 is the week ending on May 25th, 2020.
Anxiety
Overall
|
effect
|
term
|
estimate
|
std.error
|
statistic
|
pvalue
|
|
fixed
|
(Intercept)
|
38.94
|
0.72
|
54.25
|
0.00
|
|
fixed
|
SL1
|
-1.08
|
0.21
|
-5.13
|
0.00
|
|
fixed
|
SL2
|
-0.32
|
0.21
|
-1.52
|
0.13
|
Black/African American
|
effect
|
term
|
estimate
|
std.error
|
statistic
|
pvalue
|
|
fixed
|
black1
|
-3.22
|
1.53
|
-2.10
|
0.04
|
|
fixed
|
SL1:black1
|
-0.04
|
0.43
|
-0.10
|
0.92
|
|
fixed
|
black1:SL2
|
0.53
|
0.49
|
1.08
|
0.28
|
Can we explain this difference?
|
mediator
|
Change in SL1
|
Change in SL2
|
Mediator effect on SL1
|
Mediator effect on SL2
|
New significance of SL1
|
New significance of SL2
|
Proportion change in SL1
|
Proportion change in SL2
|
|
difficulty_basics
|
-0.01
|
0.12
|
1.03
|
-0.05
|
0.900
|
0.181
|
0.22
|
0.23
|
|
employment_decreased
|
0.10
|
0.12
|
-0.79
|
0.42
|
0.900
|
0.215
|
-2.31
|
0.22
|
|
losejob_sickleave
|
0.14
|
-0.06
|
-0.45
|
-0.84
|
0.849
|
0.393
|
-3.06
|
-0.11
|
|
support_decrease
|
-0.10
|
-0.14
|
-0.13
|
0.65
|
0.828
|
0.691
|
2.37
|
-0.27
|
LatinX
|
effect
|
term
|
estimate
|
std.error
|
statistic
|
pvalue
|
|
fixed
|
latinx1
|
0.50
|
0.95
|
0.52
|
0.60
|
|
fixed
|
SL1:latinx1
|
-0.13
|
0.29
|
-0.46
|
0.64
|
|
fixed
|
latinx1:SL2
|
-0.16
|
0.29
|
-0.56
|
0.58
|
Poverty
|
effect
|
term
|
estimate
|
std.error
|
statistic
|
pvalue
|
|
fixed
|
poverty1501
|
1.21
|
0.89
|
1.37
|
0.17
|
|
fixed
|
SL1:poverty1501
|
-0.05
|
0.25
|
-0.18
|
0.86
|
|
fixed
|
poverty1501:SL2
|
0.28
|
0.27
|
1.05
|
0.29
|
Single Parents
|
effect
|
term
|
estimate
|
std.error
|
statistic
|
pvalue
|
|
fixed
|
single1
|
1.65
|
1.11
|
1.49
|
0.14
|
|
fixed
|
SL1:single1
|
0.63
|
0.31
|
2.05
|
0.04
|
|
fixed
|
single1:SL2
|
0.07
|
0.35
|
0.18
|
0.85
|
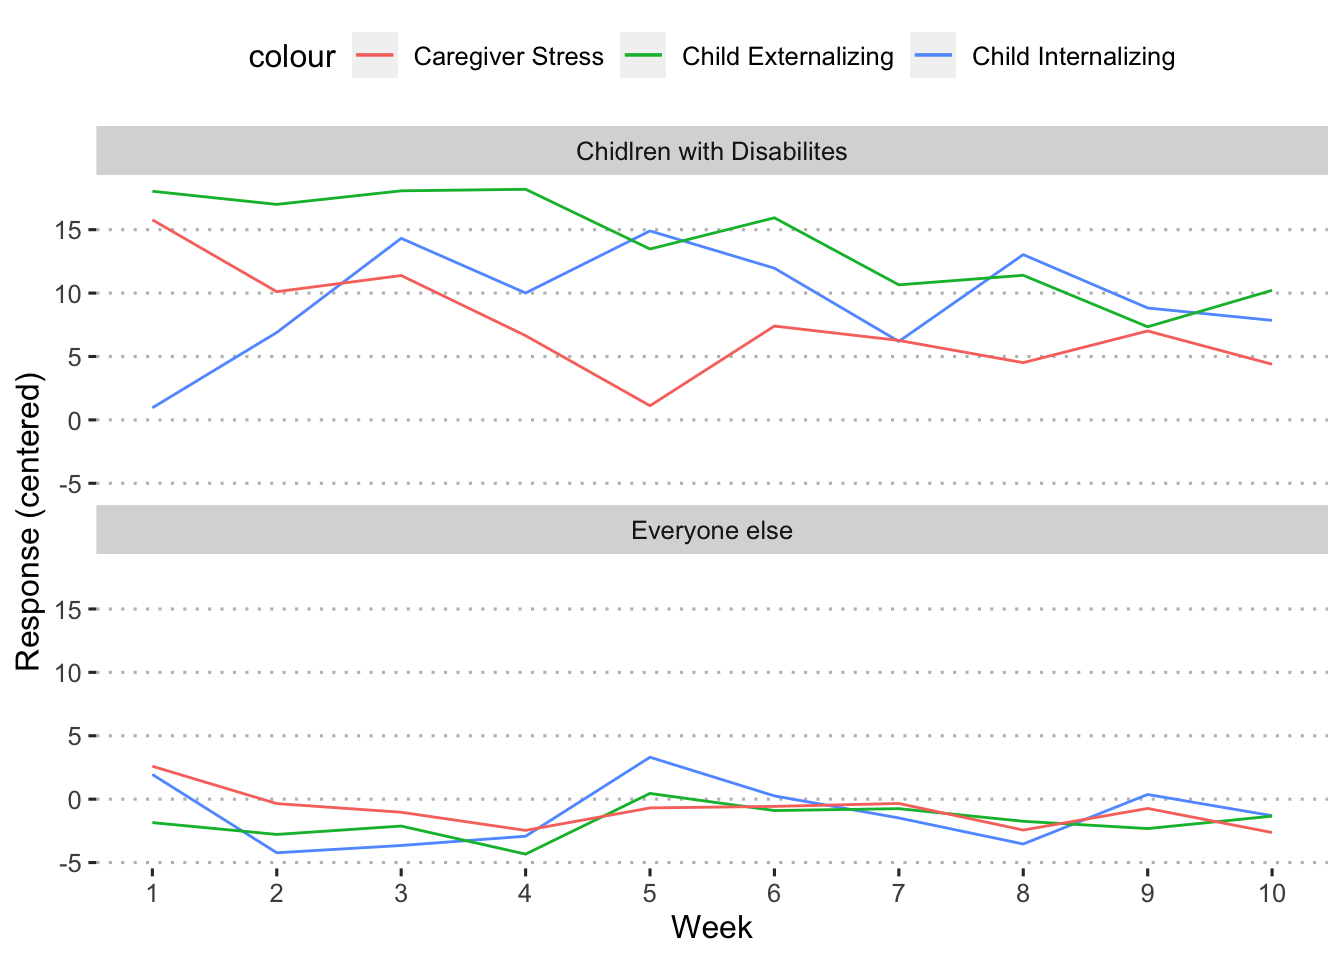
Children with disabilites
|
effect
|
term
|
estimate
|
std.error
|
statistic
|
pvalue
|
|
fixed
|
disability1
|
-7.40
|
2.22
|
-3.34
|
0.00
|
|
fixed
|
SL1:disability1
|
0.43
|
0.63
|
0.68
|
0.50
|
|
fixed
|
disability1:SL2
|
0.07
|
0.65
|
0.11
|
0.91
|
Can we explain this difference?
|
mediator
|
Change in SL1
|
Change in SL2
|
Mediator effect on SL1
|
Mediator effect on SL2
|
New significance of SL1
|
New significance of SL2
|
Proportion change in SL1
|
Proportion change in SL2
|
|
difficulty_basics
|
-0.04
|
-0.08
|
1.26
|
0.00
|
0.537
|
0.993
|
-0.09
|
-1.07
|
|
employment_decreased
|
0.16
|
0.12
|
-0.65
|
0.48
|
0.406
|
0.785
|
0.37
|
1.65
|
|
losejob_sickleave
|
0.43
|
-0.96
|
-0.32
|
-0.79
|
0.262
|
0.273
|
1.00
|
-12.90
|
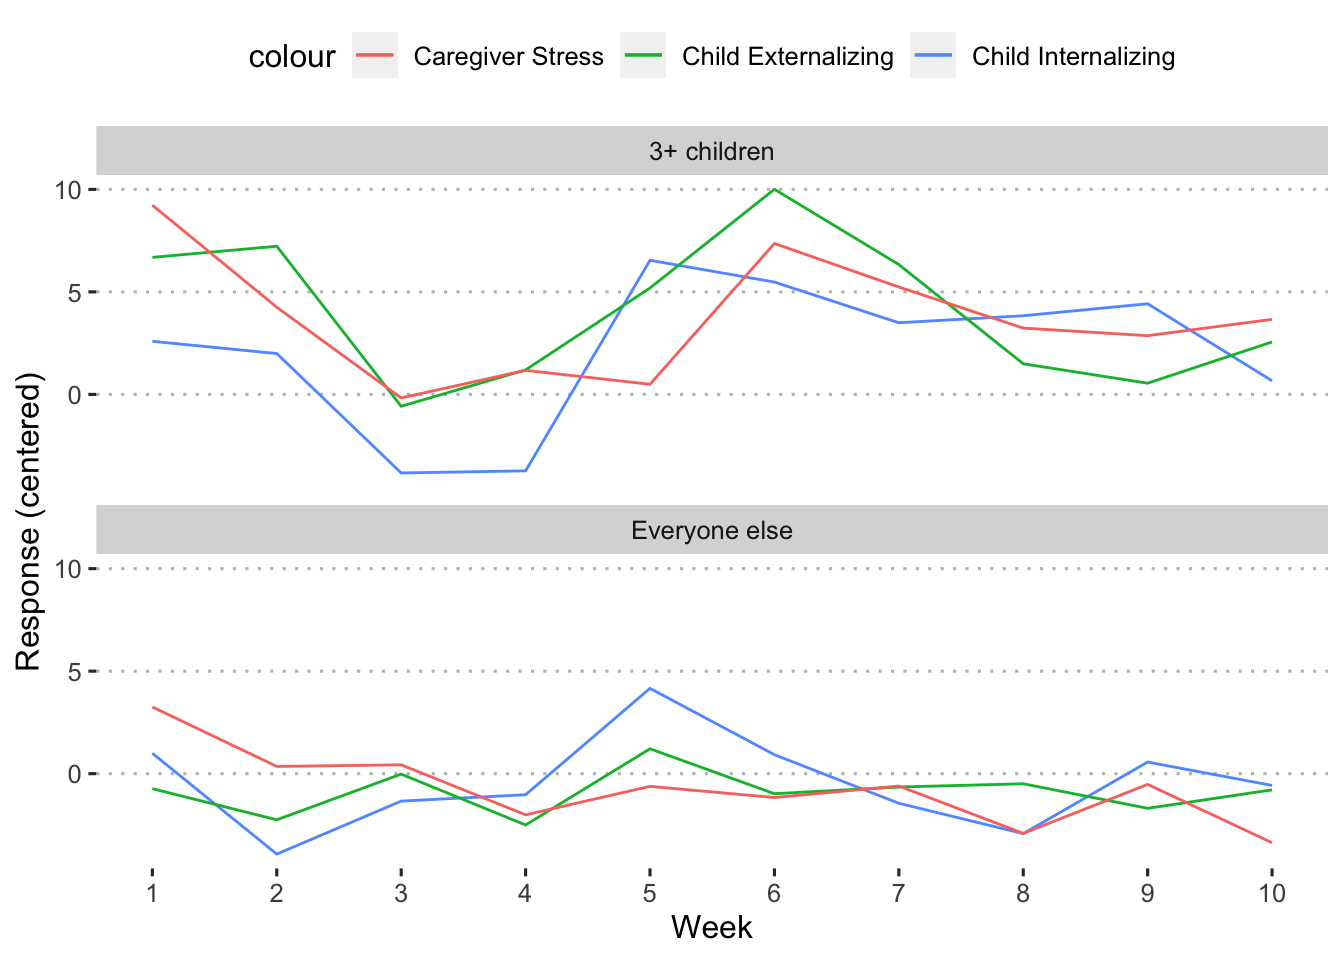
3+ Children
|
effect
|
term
|
estimate
|
std.error
|
statistic
|
pvalue
|
|
fixed
|
child31
|
1.43
|
0.90
|
1.58
|
0.11
|
|
fixed
|
SL1:child31
|
0.52
|
0.26
|
1.98
|
0.05
|
|
fixed
|
child31:SL2
|
-0.01
|
0.27
|
-0.05
|
0.96
|
Depression
Overall
|
effect
|
term
|
estimate
|
std.error
|
statistic
|
pvalue
|
|
fixed
|
(Intercept)
|
30.65
|
0.65
|
47.15
|
0.00
|
|
fixed
|
SL1
|
-0.15
|
0.19
|
-0.81
|
0.42
|
|
fixed
|
SL2
|
-0.79
|
0.19
|
-4.21
|
0.00
|
Black/African American
|
effect
|
term
|
estimate
|
std.error
|
statistic
|
pvalue
|
|
fixed
|
black1
|
-1.87
|
1.38
|
-1.35
|
0.18
|
|
fixed
|
SL1:black1
|
-0.52
|
0.39
|
-1.34
|
0.18
|
|
fixed
|
black1:SL2
|
0.54
|
0.44
|
1.24
|
0.21
|
Can we explain this difference?
|
mediator
|
Change in SL1
|
Change in SL2
|
Mediator effect on SL1
|
Mediator effect on SL2
|
New significance of SL1
|
New significance of SL2
|
Proportion change in SL1
|
Proportion change in SL2
|
|
difficulty_basics
|
0.09
|
0.10
|
-0.13
|
-0.15
|
0.256
|
0.139
|
-0.16
|
0.18
|
|
employment_decreased
|
0.03
|
0.01
|
-0.69
|
0.07
|
0.235
|
0.237
|
-0.06
|
0.01
|
|
losejob_sickleave
|
-0.10
|
0.16
|
-1.54
|
0.01
|
0.149
|
0.157
|
0.19
|
0.29
|
|
support_decrease
|
0.04
|
-0.28
|
-0.13
|
-0.24
|
0.451
|
0.767
|
-0.08
|
-0.51
|
LatinX
|
effect
|
term
|
estimate
|
std.error
|
statistic
|
pvalue
|
|
fixed
|
latinx1
|
0.72
|
0.86
|
0.84
|
0.40
|
|
fixed
|
SL1:latinx1
|
-0.12
|
0.25
|
-0.47
|
0.64
|
|
fixed
|
latinx1:SL2
|
0.29
|
0.26
|
1.15
|
0.25
|
Poverty
|
effect
|
term
|
estimate
|
std.error
|
statistic
|
pvalue
|
|
fixed
|
poverty1501
|
3.87
|
0.80
|
4.83
|
0.00
|
|
fixed
|
SL1:poverty1501
|
-0.23
|
0.23
|
-1.04
|
0.30
|
|
fixed
|
poverty1501:SL2
|
0.17
|
0.24
|
0.73
|
0.46
|
Single Parents
|
effect
|
term
|
estimate
|
std.error
|
statistic
|
pvalue
|
|
fixed
|
single1
|
2.29
|
1.00
|
2.29
|
0.02
|
|
fixed
|
SL1:single1
|
0.31
|
0.27
|
1.13
|
0.26
|
|
fixed
|
single1:SL2
|
0.15
|
0.31
|
0.47
|
0.64
|
Children with disabilites
|
effect
|
term
|
estimate
|
std.error
|
statistic
|
pvalue
|
|
fixed
|
disability1
|
-7.97
|
2.00
|
-3.98
|
0.00
|
|
fixed
|
SL1:disability1
|
1.20
|
0.57
|
2.12
|
0.03
|
|
fixed
|
disability1:SL2
|
-0.44
|
0.58
|
-0.76
|
0.45
|
Can we explain this difference?
|
mediator
|
Change in SL1
|
Change in SL2
|
Mediator effect on SL1
|
Mediator effect on SL2
|
New significance of SL1
|
New significance of SL2
|
Proportion change in SL1
|
Proportion change in SL2
|
|
difficulty_basics
|
-0.23
|
-0.07
|
0.14
|
-0.11
|
0.087
|
0.375
|
-0.19
|
0.17
|
|
employment_decreased
|
0.09
|
0.10
|
-0.63
|
0.10
|
0.042
|
0.602
|
0.08
|
-0.23
|
|
losejob_sickleave
|
0.56
|
-0.70
|
-1.41
|
0.07
|
0.010
|
0.116
|
0.47
|
1.59
|
3+ Children
|
effect
|
term
|
estimate
|
std.error
|
statistic
|
pvalue
|
|
fixed
|
child31
|
1.94
|
0.81
|
2.38
|
0.02
|
|
fixed
|
SL1:child31
|
0.23
|
0.23
|
0.99
|
0.32
|
|
fixed
|
child31:SL2
|
0.12
|
0.24
|
0.51
|
0.61
|
Stress
Overall
|
effect
|
term
|
estimate
|
std.error
|
statistic
|
pvalue
|
|
fixed
|
(Intercept)
|
54.52
|
0.76
|
71.29
|
0
|
|
fixed
|
SL1
|
-0.83
|
0.23
|
-3.58
|
0
|
|
fixed
|
SL2
|
-0.81
|
0.24
|
-3.46
|
0
|
Black/African American
|
effect
|
term
|
estimate
|
std.error
|
statistic
|
pvalue
|
|
fixed
|
black1
|
-2.41
|
1.65
|
-1.46
|
0.14
|
|
fixed
|
SL1:black1
|
-0.09
|
0.47
|
-0.20
|
0.84
|
|
fixed
|
black1:SL2
|
0.22
|
0.54
|
0.41
|
0.68
|
Differences in stress at Week 1
|
Cohen’s D
|
Everyone Else
|
Group
|
t-statistic
|
p-value
|
df
|
Conf.Low
|
Conf.High
|
|
0.09
|
55.17
|
58.23
|
-0.64
|
0.526
|
70.14
|
-12.62
|
6.5
|
Differences in stress at Week 10
|
Cohen’s D
|
Everyone Else
|
Group
|
t-statistic
|
p-value
|
df
|
Conf.Low
|
Conf.High
|
|
0.15
|
46.88
|
51.67
|
-1.08
|
0.282
|
71.15
|
-13.63
|
4.03
|
Can we explain this difference?
|
mediator
|
Change in SL1
|
Change in SL2
|
Mediator effect on SL1
|
Mediator effect on SL2
|
New significance of SL1
|
New significance of SL2
|
Proportion change in SL1
|
Proportion change in SL2
|
|
difficulty_basics
|
0.02
|
0.10
|
0.11
|
0.99
|
0.881
|
0.544
|
-0.25
|
0.47
|
|
employment_decreased
|
0.44
|
-0.06
|
-1.29
|
1.22
|
0.486
|
0.774
|
-4.75
|
-0.25
|
|
losejob_sickleave
|
0.23
|
0.12
|
-1.29
|
1.14
|
0.794
|
0.583
|
-2.46
|
0.52
|
|
support_decrease
|
-0.08
|
0.24
|
0.19
|
-0.01
|
0.799
|
0.642
|
0.89
|
1.07
|
LatinX
|
effect
|
term
|
estimate
|
std.error
|
statistic
|
pvalue
|
|
fixed
|
latinx1
|
1.65
|
1.02
|
1.62
|
0.11
|
|
fixed
|
SL1:latinx1
|
0.12
|
0.31
|
0.39
|
0.70
|
|
fixed
|
latinx1:SL2
|
-0.03
|
0.32
|
-0.08
|
0.93
|
Differences in stress at Week 1
|
Cohen’s D
|
Everyone Else
|
Group
|
t-statistic
|
p-value
|
df
|
Conf.Low
|
Conf.High
|
|
-0.13
|
61.65
|
57.18
|
1.14
|
0.257
|
122.99
|
-3.3
|
12.23
|
Differences in stress at Week 10
|
Cohen’s D
|
Everyone Else
|
Group
|
t-statistic
|
p-value
|
df
|
Conf.Low
|
Conf.High
|
|
-0.08
|
53.36
|
50.82
|
0.92
|
0.357
|
268.7
|
-2.88
|
7.95
|
Poverty
|
effect
|
term
|
estimate
|
std.error
|
statistic
|
pvalue
|
|
fixed
|
poverty1501
|
1.61
|
0.95
|
1.71
|
0.09
|
|
fixed
|
SL1:poverty1501
|
-0.41
|
0.28
|
-1.49
|
0.14
|
|
fixed
|
poverty1501:SL2
|
0.14
|
0.30
|
0.47
|
0.64
|
Differences in stress at Week 1
|
Cohen’s D
|
Everyone Else
|
Group
|
t-statistic
|
p-value
|
df
|
Conf.Low
|
Conf.High
|
|
-0.11
|
59.68
|
56.07
|
1.06
|
0.292
|
305.16
|
-3.12
|
10.32
|
Differences in stress at Week 10
|
Cohen’s D
|
Everyone Else
|
Group
|
t-statistic
|
p-value
|
df
|
Conf.Low
|
Conf.High
|
|
-0.2
|
56.73
|
50.16
|
2.39
|
0.017
|
329.94
|
1.16
|
11.97
|
Single Parents
|
effect
|
term
|
estimate
|
std.error
|
statistic
|
pvalue
|
|
fixed
|
single1
|
0.69
|
1.19
|
0.58
|
0.56
|
|
fixed
|
SL1:single1
|
-0.07
|
0.33
|
-0.22
|
0.82
|
|
fixed
|
single1:SL2
|
0.44
|
0.39
|
1.11
|
0.27
|
Differences in stress at Week 1
|
Cohen’s D
|
Everyone Else
|
Group
|
t-statistic
|
p-value
|
df
|
Conf.Low
|
Conf.High
|
|
0.07
|
56.19
|
58.39
|
-0.6
|
0.55
|
155.22
|
-9.45
|
5.05
|
Differences in stress at Week 10
|
Cohen’s D
|
Everyone Else
|
Group
|
t-statistic
|
p-value
|
df
|
Conf.Low
|
Conf.High
|
|
-0.2
|
57.08
|
50.66
|
1.92
|
0.057
|
132.09
|
-0.2
|
13.03
|
Children with disabilites
|
effect
|
term
|
estimate
|
std.error
|
statistic
|
pvalue
|
|
fixed
|
disability1
|
-7.02
|
2.36
|
-2.98
|
0.00
|
|
fixed
|
SL1:disability1
|
1.12
|
0.69
|
1.61
|
0.11
|
|
fixed
|
disability1:SL2
|
-0.37
|
0.73
|
-0.51
|
0.61
|
Differences in stress at Week 1
|
Cohen’s D
|
Everyone Else
|
Group
|
t-statistic
|
p-value
|
df
|
Conf.Low
|
Conf.High
|
|
-0.4
|
69.05
|
55.87
|
3.41
|
0.001
|
117.52
|
5.54
|
20.83
|
Differences in stress at Week 10
|
Cohen’s D
|
Everyone Else
|
Group
|
t-statistic
|
p-value
|
df
|
Conf.Low
|
Conf.High
|
|
-0.22
|
57.66
|
50.64
|
2.08
|
0.039
|
138.04
|
0.36
|
13.68
|
3+ Children
|
effect
|
term
|
estimate
|
std.error
|
statistic
|
pvalue
|
|
fixed
|
child31
|
2.87
|
0.96
|
2.98
|
0.00
|
|
fixed
|
SL1:child31
|
0.27
|
0.29
|
0.94
|
0.35
|
|
fixed
|
child31:SL2
|
-0.17
|
0.30
|
-0.58
|
0.56
|
Differences in stress at Week 1
|
Cohen’s D
|
Everyone Else
|
Group
|
t-statistic
|
p-value
|
df
|
Conf.Low
|
Conf.High
|
|
-0.18
|
62.5
|
56.52
|
1.8
|
0.073
|
221.7
|
-0.57
|
12.53
|
Differences in stress at Week 10
|
Cohen’s D
|
Everyone Else
|
Group
|
t-statistic
|
p-value
|
df
|
Conf.Low
|
Conf.High
|
|
-0.22
|
56.93
|
49.9
|
2.63
|
0.009
|
299.28
|
1.76
|
12.29
|
Loneliness
Overall
|
effect
|
term
|
estimate
|
std.error
|
statistic
|
pvalue
|
|
fixed
|
(Intercept)
|
45.83
|
0.63
|
72.35
|
0.00
|
|
fixed
|
SL1
|
-0.03
|
0.18
|
-0.16
|
0.87
|
|
fixed
|
SL2
|
-0.55
|
0.18
|
-3.11
|
0.00
|
Black/African American
|
effect
|
term
|
estimate
|
std.error
|
statistic
|
pvalue
|
|
fixed
|
black1
|
-4.28
|
1.34
|
-3.20
|
0.00
|
|
fixed
|
SL1:black1
|
-0.71
|
0.37
|
-1.91
|
0.06
|
|
fixed
|
black1:SL2
|
0.48
|
0.41
|
1.17
|
0.24
|
LatinX
|
effect
|
term
|
estimate
|
std.error
|
statistic
|
pvalue
|
|
fixed
|
latinx1
|
0.98
|
0.84
|
1.16
|
0.25
|
|
fixed
|
SL1:latinx1
|
0.40
|
0.24
|
1.63
|
0.10
|
|
fixed
|
latinx1:SL2
|
-0.08
|
0.24
|
-0.34
|
0.73
|
Poverty
|
effect
|
term
|
estimate
|
std.error
|
statistic
|
pvalue
|
|
fixed
|
poverty1501
|
3.06
|
0.78
|
3.92
|
0.00
|
|
fixed
|
SL1:poverty1501
|
-0.01
|
0.21
|
-0.03
|
0.98
|
|
fixed
|
poverty1501:SL2
|
-0.11
|
0.22
|
-0.50
|
0.62
|
Single Parents
|
effect
|
term
|
estimate
|
std.error
|
statistic
|
pvalue
|
|
fixed
|
single1
|
4.32
|
0.97
|
4.47
|
0.00
|
|
fixed
|
SL1:single1
|
0.04
|
0.26
|
0.15
|
0.88
|
|
fixed
|
single1:SL2
|
0.20
|
0.30
|
0.68
|
0.49
|
Children with disabilites
|
effect
|
term
|
estimate
|
std.error
|
statistic
|
pvalue
|
|
fixed
|
disability1
|
-3.51
|
1.96
|
-1.79
|
0.07
|
|
fixed
|
SL1:disability1
|
2.25
|
0.54
|
4.18
|
0.00
|
|
fixed
|
disability1:SL2
|
-0.17
|
0.54
|
-0.31
|
0.76
|
Can we explain this difference?
|
mediator
|
Change in SL1
|
Change in SL2
|
Mediator effect on SL1
|
Mediator effect on SL2
|
New significance of SL1
|
New significance of SL2
|
Proportion change in SL1
|
Proportion change in SL2
|
|
difficulty_basics
|
-0.03
|
-0.02
|
0.39
|
0.25
|
0
|
0.729
|
-0.01
|
0.12
|
|
employment_decreased
|
0.25
|
0.11
|
-0.27
|
0.26
|
0
|
0.919
|
0.11
|
-0.63
|
|
losejob_sickleave
|
1.06
|
-0.37
|
1.62
|
-0.39
|
0
|
0.439
|
0.47
|
2.20
|
3+ Children
|
effect
|
term
|
estimate
|
std.error
|
statistic
|
pvalue
|
|
fixed
|
child31
|
1.18
|
0.79
|
1.48
|
0.14
|
|
fixed
|
SL1:child31
|
0.14
|
0.22
|
0.65
|
0.52
|
|
fixed
|
child31:SL2
|
-0.35
|
0.23
|
-1.55
|
0.12
|
Child Externalizing
Overall
|
effect
|
term
|
estimate
|
std.error
|
statistic
|
pvalue
|
|
fixed
|
(Intercept)
|
52.70
|
0.82
|
64.22
|
0.00
|
|
fixed
|
SL1
|
-0.07
|
0.25
|
-0.28
|
0.78
|
|
fixed
|
SL2
|
-0.59
|
0.26
|
-2.29
|
0.02
|
Black/African American
|
effect
|
term
|
estimate
|
std.error
|
statistic
|
pvalue
|
|
fixed
|
black1
|
-7.18
|
1.77
|
-4.07
|
0.00
|
|
fixed
|
SL1:black1
|
-0.40
|
0.51
|
-0.78
|
0.43
|
|
fixed
|
black1:SL2
|
2.02
|
0.59
|
3.45
|
0.00
|
Differences in fussy at Week 1
|
Cohen’s D
|
Everyone Else
|
Group
|
t-statistic
|
p-value
|
df
|
Conf.Low
|
Conf.High
|
|
0.19
|
47.37
|
54.18
|
-1.31
|
0.193
|
68.97
|
-17.14
|
3.53
|
Differences in fussy at Week 10
|
Cohen’s D
|
Everyone Else
|
Group
|
t-statistic
|
p-value
|
df
|
Conf.Low
|
Conf.High
|
|
0.06
|
50
|
51.81
|
-0.41
|
0.685
|
71.18
|
-10.68
|
7.06
|
## Linear mixed model fit by REML ['lmerMod']
## Formula: fussy ~ black * SL1 + black * SL2 + stress * SL1 + stress * SL2 +      (1 | CaregiverID)
##    Data: emotion_g_sL
##
## REML criterion at convergence: 68609.6
##
## Scaled residuals:
##     Min      1Q  Median      3Q     Max
## -3.2269 -0.5192 -0.0302  0.5521  3.3808
##
## Random effects:
##  Groups      Name        Variance Std.Dev.
##  CaregiverID (Intercept) 554.0    23.54
##  Residual                504.9    22.47
## Number of obs: 7172, groups:  CaregiverID, 3460
##
## Fixed effects:
##              Estimate Std. Error t value
## (Intercept) 32.538723   2.020020  16.108
## black1      -6.403461   1.698739  -3.770
## SL1          0.483626   0.630650   0.767
## SL2          1.212813   0.691651   1.754
## stress       0.268135   0.021565  12.434
## black1:SL1  -0.370464   0.491049  -0.754
## black1:SL2   1.913824   0.572846   3.341
## SL1:stress  -0.012217   0.007484  -1.632
## SL2:stress   0.002955   0.007921   0.373
##
## Correlation of Fixed Effects:
##            (Intr) black1 SL1    SL2    stress b1:SL1 b1:SL2 SL1:st
## black1      0.723
## SL1         0.754  0.533
## SL2        -0.745 -0.547 -0.611
## stress     -0.542  0.040 -0.431  0.423
## black1:SL1  0.577  0.789  0.653 -0.468  0.031
## black1:SL2 -0.557 -0.756 -0.440  0.717 -0.036 -0.649
## SL1:stress -0.397  0.028 -0.627  0.329  0.722  0.034 -0.025
## SL2:stress  0.381 -0.035  0.330 -0.561 -0.735 -0.029  0.044 -0.564
LatinX
|
effect
|
term
|
estimate
|
std.error
|
statistic
|
pvalue
|
|
fixed
|
latinx1
|
1.36
|
1.10
|
1.24
|
0.22
|
|
fixed
|
SL1:latinx1
|
-0.28
|
0.34
|
-0.82
|
0.41
|
|
fixed
|
latinx1:SL2
|
-0.19
|
0.35
|
-0.54
|
0.59
|
Differences in fussy at Week 1
|
Cohen’s D
|
Everyone Else
|
Group
|
t-statistic
|
p-value
|
df
|
Conf.Low
|
Conf.High
|
|
-0.19
|
58.52
|
51.81
|
1.58
|
0.117
|
122.62
|
-1.71
|
15.12
|
Differences in fussy at Week 10
|
Cohen’s D
|
Everyone Else
|
Group
|
t-statistic
|
p-value
|
df
|
Conf.Low
|
Conf.High
|
|
0.05
|
50.27
|
52.03
|
-0.62
|
0.533
|
263.89
|
-7.3
|
3.79
|
Poverty
|
effect
|
term
|
estimate
|
std.error
|
statistic
|
pvalue
|
|
fixed
|
poverty1501
|
0.72
|
1.02
|
0.70
|
0.48
|
|
fixed
|
SL1:poverty1501
|
-0.30
|
0.30
|
-0.99
|
0.32
|
|
fixed
|
poverty1501:SL2
|
0.90
|
0.32
|
2.79
|
0.01
|
Differences in fussy at Week 1
|
Cohen’s D
|
Everyone Else
|
Group
|
t-statistic
|
p-value
|
df
|
Conf.Low
|
Conf.High
|
|
-0.06
|
53.95
|
51.94
|
0.56
|
0.574
|
316.08
|
-5.03
|
9.05
|
Differences in fussy at Week 10
|
Cohen’s D
|
Everyone Else
|
Group
|
t-statistic
|
p-value
|
df
|
Conf.Low
|
Conf.High
|
|
-0.17
|
56.49
|
50.82
|
2.1
|
0.037
|
347.54
|
0.35
|
10.99
|
## Linear mixed model fit by REML ['lmerMod']
## Formula: fussy ~ poverty150 * SL1 + poverty150 * SL2 + stress * SL1 +      stress * SL2 + (1 | CaregiverID)
##    Data: emotion_g_sL
##
## REML criterion at convergence: 57938
##
## Scaled residuals:
##     Min      1Q  Median      3Q     Max
## -3.2056 -0.5214 -0.0267  0.5434  3.4030
##
## Random effects:
##  Groups      Name        Variance Std.Dev.
##  CaregiverID (Intercept) 554.6    23.55
##  Residual                502.1    22.41
## Number of obs: 6063, groups:  CaregiverID, 2835
##
## Fixed effects:
##                  Estimate Std. Error t value
## (Intercept)     38.841366   1.605259  24.196
## poverty1501      0.208404   0.975614   0.214
## SL1              1.173005   0.534887   2.193
## SL2             -0.144219   0.556436  -0.259
## stress           0.261595   0.023382  11.188
## poverty1501:SL1 -0.186271   0.293187  -0.635
## poverty1501:SL2  0.850252   0.319031   2.665
## SL1:stress      -0.016390   0.008108  -2.022
## SL2:stress       0.002884   0.008571   0.336
##
## Correlation of Fixed Effects:
##             (Intr) pv1501 SL1    SL2    stress p1501:SL1 p1501:SL2 SL1:st
## poverty1501  0.317
## SL1          0.702  0.198
## SL2         -0.706 -0.215 -0.561
## stress      -0.794 -0.026 -0.584  0.614
## pvr1501:SL1  0.220  0.701  0.265 -0.182 -0.015
## pvr1501:SL2 -0.229 -0.663 -0.171  0.330  0.021 -0.571
## SL1:stress  -0.577 -0.013 -0.836  0.471  0.719 -0.037     0.014
## SL2:stress   0.564  0.017  0.452 -0.819 -0.730  0.018    -0.038    -0.558
Single Parents
|
effect
|
term
|
estimate
|
std.error
|
statistic
|
pvalue
|
|
fixed
|
single1
|
-0.17
|
1.28
|
-0.13
|
0.89
|
|
fixed
|
SL1:single1
|
-0.33
|
0.37
|
-0.89
|
0.37
|
|
fixed
|
single1:SL2
|
0.88
|
0.43
|
2.05
|
0.04
|
Differences in fussy at Week 1
|
Cohen’s D
|
Everyone Else
|
Group
|
t-statistic
|
p-value
|
df
|
Conf.Low
|
Conf.High
|
|
-0.1
|
56.44
|
52.75
|
0.87
|
0.386
|
139.84
|
-4.7
|
12.08
|
Differences in fussy at Week 10
|
Cohen’s D
|
Everyone Else
|
Group
|
t-statistic
|
p-value
|
df
|
Conf.Low
|
Conf.High
|
|
-0.18
|
57.08
|
51.03
|
1.83
|
0.069
|
133.56
|
-0.48
|
12.56
|
## Linear mixed model fit by REML ['lmerMod']
## Formula: fussy ~ single * SL1 + single * SL2 + stress * SL1 + stress *      SL2 + (1 | CaregiverID)
##    Data: emotion_g_sL
##
## REML criterion at convergence: 68709.6
##
## Scaled residuals:
##     Min      1Q  Median      3Q     Max
## -3.2188 -0.5169 -0.0222  0.5519  3.3752
##
## Random effects:
##  Groups      Name        Variance Std.Dev.
##  CaregiverID (Intercept) 556.0    23.58
##  Residual                507.2    22.52
## Number of obs: 7179, groups:  CaregiverID, 3466
##
## Fixed effects:
##               Estimate Std. Error t value
## (Intercept) 37.7246210  1.7074846  22.094
## single1     -0.2489677  1.2294076  -0.203
## SL1          0.6653602  0.5518163   1.206
## SL2          0.1438393  0.6004324   0.240
## stress       0.2728193  0.0216044  12.628
## single1:SL1 -0.2554624  0.3564302  -0.717
## single1:SL2  0.7120927  0.4208282   1.692
## SL1:stress  -0.0111590  0.0074971  -1.488
## SL2:stress   0.0007946  0.0079406   0.100
##
## Correlation of Fixed Effects:
##             (Intr) singl1 SL1    SL2    stress s1:SL1 s1:SL2 SL1:st
## single1      0.574
## SL1          0.726  0.395
## SL2         -0.712 -0.406 -0.578
## stress      -0.694 -0.030 -0.533  0.535
## single1:SL1  0.441  0.753  0.498 -0.353 -0.028
## single1:SL2 -0.414 -0.690 -0.326  0.594  0.027 -0.607
## SL1:stress  -0.509 -0.023 -0.763  0.414  0.722 -0.040  0.022
## SL2:stress   0.501  0.029  0.413 -0.714 -0.735  0.023 -0.049 -0.564
Children with disabilites
|
effect
|
term
|
estimate
|
std.error
|
statistic
|
pvalue
|
|
fixed
|
disability1
|
-12.97
|
2.53
|
-5.14
|
0.00
|
|
fixed
|
SL1:disability1
|
-0.76
|
0.75
|
-1.00
|
0.32
|
|
fixed
|
disability1:SL2
|
0.28
|
0.79
|
0.36
|
0.72
|
Differences in fussy at Week 1
|
Cohen’s D
|
Everyone Else
|
Group
|
t-statistic
|
p-value
|
df
|
Conf.Low
|
Conf.High
|
|
0.03
|
53.01
|
54.01
|
-0.25
|
0.806
|
120.72
|
-9.02
|
7.03
|
Differences in fussy at Week 10
|
Cohen’s D
|
Everyone Else
|
Group
|
t-statistic
|
p-value
|
df
|
Conf.Low
|
Conf.High
|
|
-0.28
|
59.91
|
50.75
|
2.81
|
0.006
|
140.95
|
2.72
|
15.59
|
3+ Children
|
effect
|
term
|
estimate
|
std.error
|
statistic
|
pvalue
|
|
fixed
|
child31
|
2.06
|
1.03
|
2.00
|
0.05
|
|
fixed
|
SL1:child31
|
0.35
|
0.31
|
1.12
|
0.26
|
|
fixed
|
child31:SL2
|
0.07
|
0.33
|
0.20
|
0.84
|
Differences in fussy at Week 1
|
Cohen’s D
|
Everyone Else
|
Group
|
t-statistic
|
p-value
|
df
|
Conf.Low
|
Conf.High
|
|
-0.04
|
54.65
|
53.06
|
0.43
|
0.665
|
210.64
|
-5.67
|
8.86
|
Differences in fussy at Week 10
|
Cohen’s D
|
Everyone Else
|
Group
|
t-statistic
|
p-value
|
df
|
Conf.Low
|
Conf.High
|
|
-0.04
|
52.72
|
51.49
|
0.47
|
0.637
|
310.96
|
-3.91
|
6.38
|
Child Internalizing
Overall
|
effect
|
term
|
estimate
|
std.error
|
statistic
|
pvalue
|
|
fixed
|
(Intercept)
|
27.07
|
0.77
|
35.05
|
0.00
|
|
fixed
|
SL1
|
0.35
|
0.23
|
1.51
|
0.13
|
|
fixed
|
SL2
|
-0.54
|
0.24
|
-2.30
|
0.02
|
Black/African American
|
effect
|
term
|
estimate
|
std.error
|
statistic
|
pvalue
|
|
fixed
|
black1
|
-1.29
|
1.66
|
-0.78
|
0.44
|
|
fixed
|
SL1:black1
|
-0.55
|
0.47
|
-1.15
|
0.25
|
|
fixed
|
black1:SL2
|
-0.08
|
0.54
|
-0.14
|
0.89
|
Differences in fear at Week 1
|
Cohen’s D
|
Everyone Else
|
Group
|
t-statistic
|
p-value
|
df
|
Conf.Low
|
Conf.High
|
|
-0.2
|
31.82
|
25.27
|
1.36
|
0.178
|
66.79
|
-3.06
|
16.16
|
Differences in fear at Week 10
|
Cohen’s D
|
Everyone Else
|
Group
|
t-statistic
|
p-value
|
df
|
Conf.Low
|
Conf.High
|
|
0.1
|
21.88
|
25
|
-0.79
|
0.435
|
72.91
|
-11.06
|
4.81
|
LatinX
|
effect
|
term
|
estimate
|
std.error
|
statistic
|
pvalue
|
|
fixed
|
latinx1
|
3.22
|
1.03
|
3.12
|
0.00
|
|
fixed
|
SL1:latinx1
|
0.04
|
0.32
|
0.13
|
0.89
|
|
fixed
|
latinx1:SL2
|
-0.39
|
0.32
|
-1.22
|
0.22
|
Differences in fear at Week 1
|
Cohen’s D
|
Everyone Else
|
Group
|
t-statistic
|
p-value
|
df
|
Conf.Low
|
Conf.High
|
|
-0.12
|
28.92
|
25
|
0.94
|
0.348
|
111.11
|
-4.31
|
12.15
|
Differences in fear at Week 10
|
Cohen’s D
|
Everyone Else
|
Group
|
t-statistic
|
p-value
|
df
|
Conf.Low
|
Conf.High
|
|
-0.09
|
27.15
|
24.27
|
1.02
|
0.307
|
256.48
|
-2.66
|
8.42
|
Poverty
|
effect
|
term
|
estimate
|
std.error
|
statistic
|
pvalue
|
|
fixed
|
poverty1501
|
0.39
|
0.95
|
0.41
|
0.68
|
|
fixed
|
SL1:poverty1501
|
-0.56
|
0.28
|
-2.02
|
0.04
|
|
fixed
|
poverty1501:SL2
|
0.56
|
0.30
|
1.89
|
0.06
|
Differences in fear at Week 1
|
Cohen’s D
|
Everyone Else
|
Group
|
t-statistic
|
p-value
|
df
|
Conf.Low
|
Conf.High
|
|
-0.14
|
27.36
|
22.79
|
1.42
|
0.157
|
302.61
|
-1.77
|
10.91
|
Differences in fear at Week 10
|
Cohen’s D
|
Everyone Else
|
Group
|
t-statistic
|
p-value
|
df
|
Conf.Low
|
Conf.High
|
|
-0.2
|
29.33
|
22.95
|
2.41
|
0.017
|
329.96
|
1.17
|
11.59
|
Single Parents
|
effect
|
term
|
estimate
|
std.error
|
statistic
|
pvalue
|
|
fixed
|
single1
|
0.57
|
1.20
|
0.47
|
0.63
|
|
fixed
|
SL1:single1
|
-0.71
|
0.34
|
-2.08
|
0.04
|
|
fixed
|
single1:SL2
|
0.58
|
0.39
|
1.48
|
0.14
|
Differences in fear at Week 1
|
Cohen’s D
|
Everyone Else
|
Group
|
t-statistic
|
p-value
|
df
|
Conf.Low
|
Conf.High
|
|
-0.23
|
32
|
24.53
|
1.94
|
0.055
|
141.81
|
-0.16
|
15.1
|
Differences in fear at Week 10
|
Cohen’s D
|
Everyone Else
|
Group
|
t-statistic
|
p-value
|
df
|
Conf.Low
|
Conf.High
|
|
-0.17
|
29.72
|
24.2
|
1.61
|
0.111
|
128.61
|
-1.28
|
12.33
|
Children with disabilites
|
effect
|
term
|
estimate
|
std.error
|
statistic
|
pvalue
|
|
fixed
|
disability1
|
-14.90
|
2.36
|
-6.30
|
0.00
|
|
fixed
|
SL1:disability1
|
1.63
|
0.70
|
2.34
|
0.02
|
|
fixed
|
disability1:SL2
|
0.75
|
0.73
|
1.04
|
0.30
|
Differences in fear at Week 1
|
Cohen’s D
|
Everyone Else
|
Group
|
t-statistic
|
p-value
|
df
|
Conf.Low
|
Conf.High
|
|
-0.61
|
42.95
|
23.07
|
4.8
|
0
|
103.29
|
11.67
|
28.09
|
Differences in fear at Week 10
|
Cohen’s D
|
Everyone Else
|
Group
|
t-statistic
|
p-value
|
df
|
Conf.Low
|
Conf.High
|
|
-0.36
|
35.14
|
23.58
|
3.45
|
0.001
|
136.32
|
4.93
|
18.18
|
## Linear mixed model fit by REML ['lmerMod']
## Formula: fear ~ disability * SL1 + disability * SL2 + stress * SL1 + stress *      SL2 + (1 | CaregiverID)
##    Data: emotion_g_sL
##
## REML criterion at convergence: 67096.1
##
## Scaled residuals:
##     Min      1Q  Median      3Q     Max
## -3.5316 -0.4879 -0.1543  0.4246  4.4226
##
## Random effects:
##  Groups      Name        Variance Std.Dev.
##  CaregiverID (Intercept) 555.7    23.57
##  Residual                417.6    20.44
## Number of obs: 7112, groups:  CaregiverID, 3419
##
## Fixed effects:
##                   Estimate Std. Error t value
## (Intercept)      25.820627   2.458662  10.502
## disability1     -13.230378   2.290246  -5.777
## SL1              -0.815266   0.781586  -1.043
## SL2              -0.969789   0.794403  -1.221
## stress            0.237412   0.020047  11.843
## disability1:SL1   1.390306   0.688350   2.020
## disability1:SL2   0.838901   0.718427   1.168
## SL1:stress        0.003097   0.007044   0.440
## SL2:stress       -0.002379   0.007314  -0.325
##
## Correlation of Fixed Effects:
##             (Intr) dsblt1 SL1    SL2    stress d1:SL1 d1:SL2 SL1:st
## disability1 -0.848
## SL1          0.663 -0.532
## SL2         -0.651  0.522 -0.537
## stress      -0.489  0.065 -0.386  0.398
## dsblty1:SL1 -0.565  0.660 -0.820  0.448  0.061
## dsblty1:SL2  0.534 -0.627  0.431 -0.829 -0.049 -0.534
## SL1:stress  -0.354  0.048 -0.574  0.309  0.712  0.104 -0.041
## SL2:stress   0.347 -0.047  0.303 -0.532 -0.730 -0.052  0.069 -0.557
3+ Children
|
effect
|
term
|
estimate
|
std.error
|
statistic
|
pvalue
|
|
fixed
|
child31
|
2.43
|
0.97
|
2.50
|
0.01
|
|
fixed
|
SL1:child31
|
-0.20
|
0.29
|
-0.68
|
0.50
|
|
fixed
|
child31:SL2
|
-0.18
|
0.30
|
-0.60
|
0.55
|
Differences in fear at Week 1
|
Cohen’s D
|
Everyone Else
|
Group
|
t-statistic
|
p-value
|
df
|
Conf.Low
|
Conf.High
|
|
-0.22
|
31.6
|
24.19
|
2.1
|
0.037
|
194.99
|
0.44
|
14.38
|
Differences in fear at Week 10
|
Cohen’s D
|
Everyone Else
|
Group
|
t-statistic
|
p-value
|
df
|
Conf.Low
|
Conf.High
|
|
-0.11
|
27.48
|
24.13
|
1.28
|
0.201
|
300.22
|
-1.79
|
8.49
|
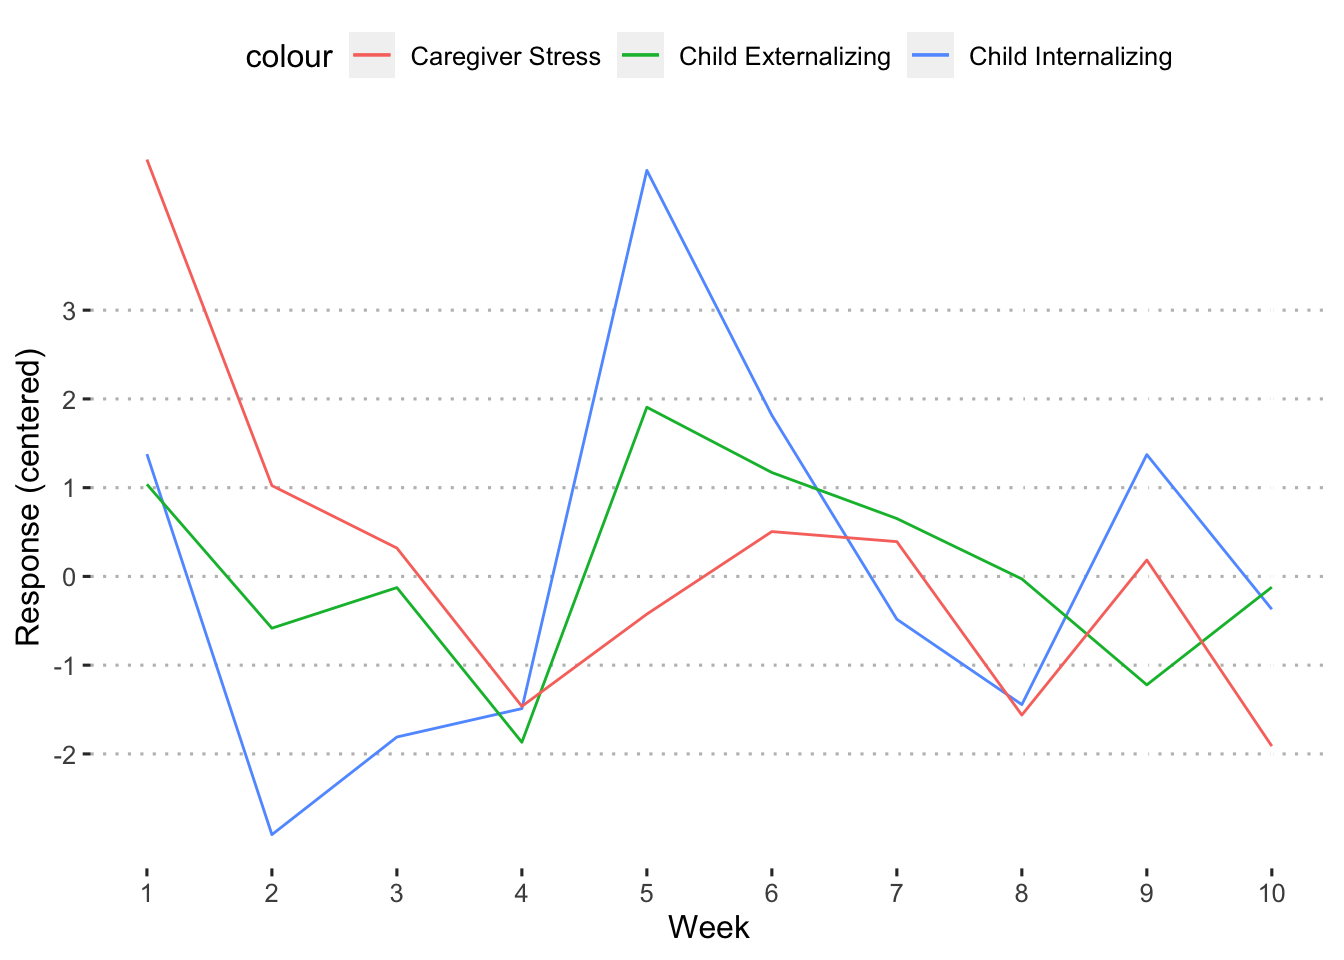
Comparing change
No modeling
Overall
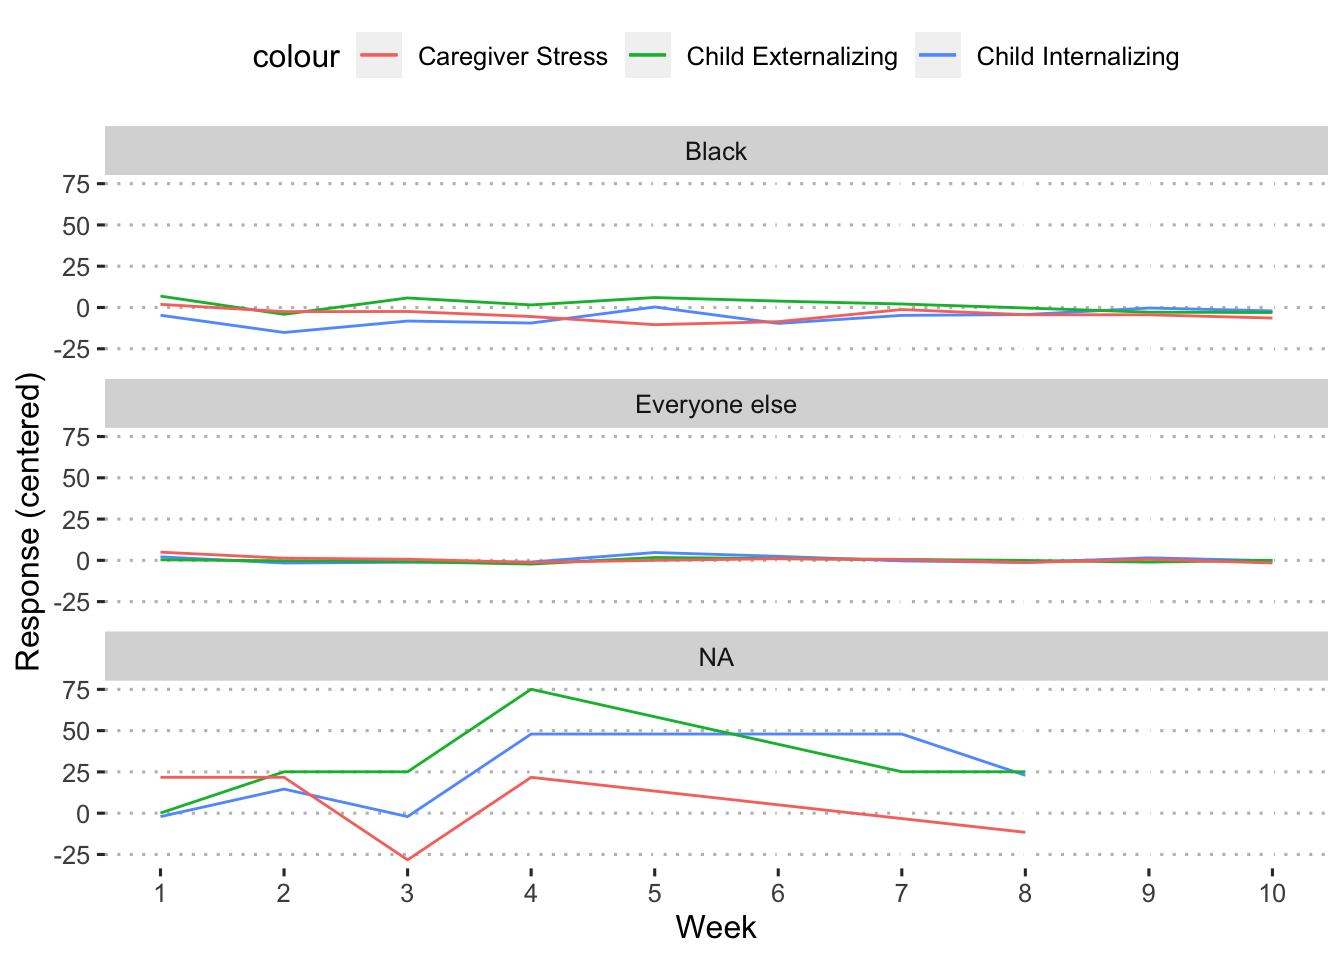
Black/African American
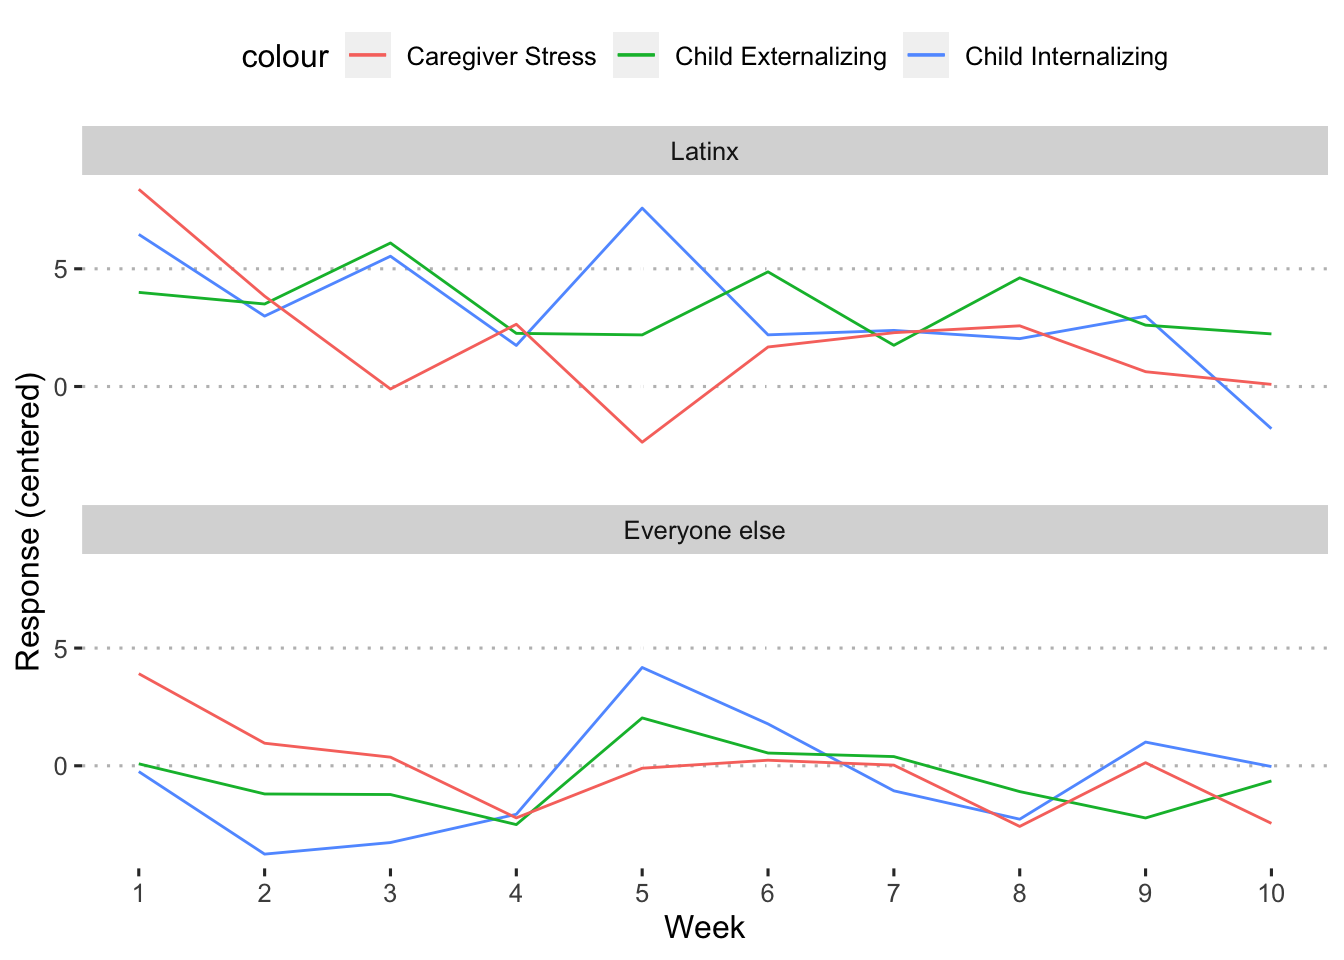
Latinx
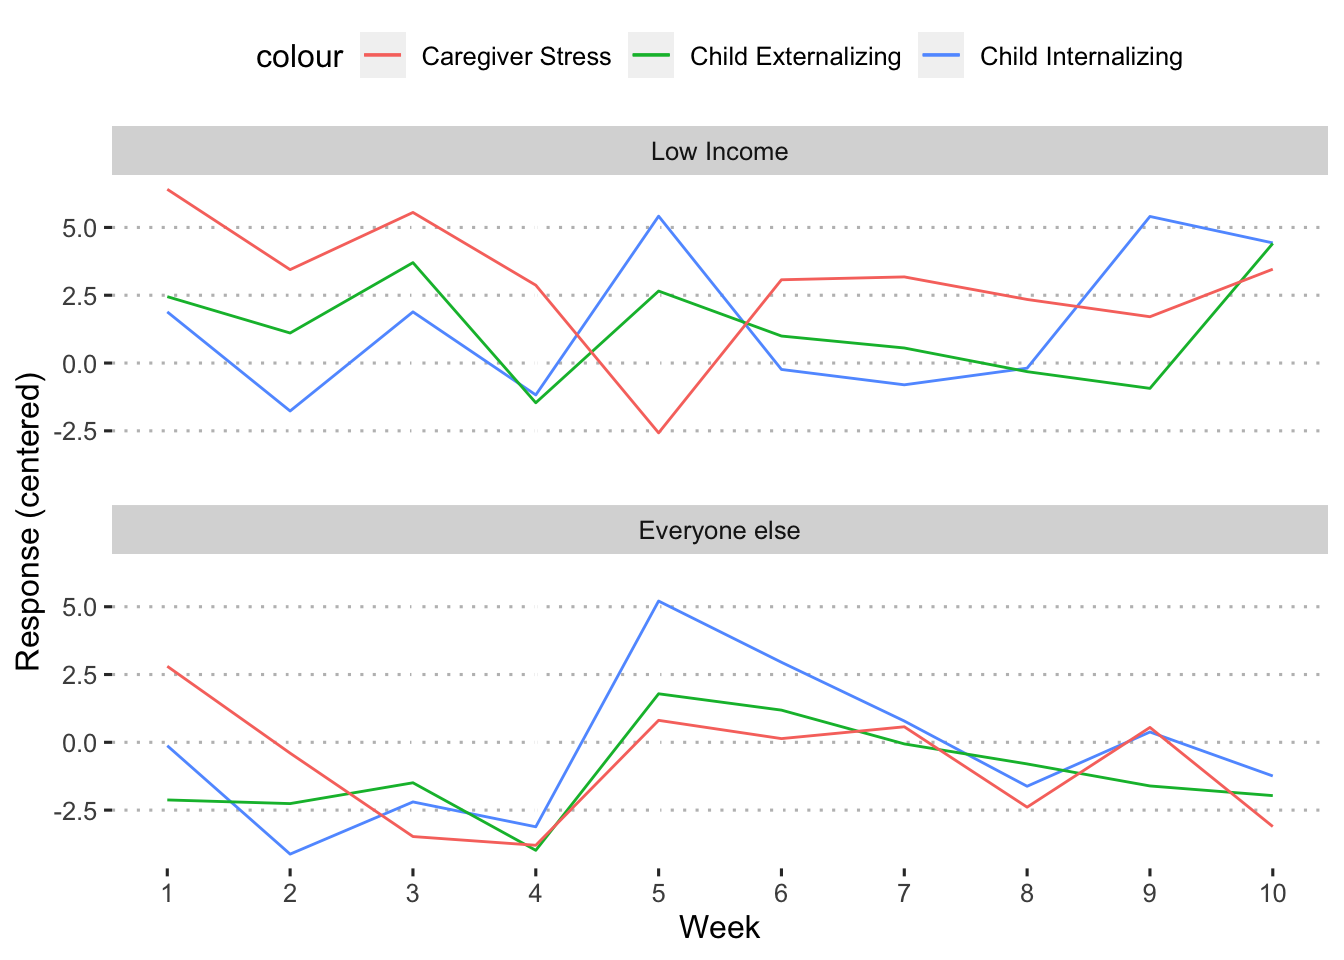
Poverty
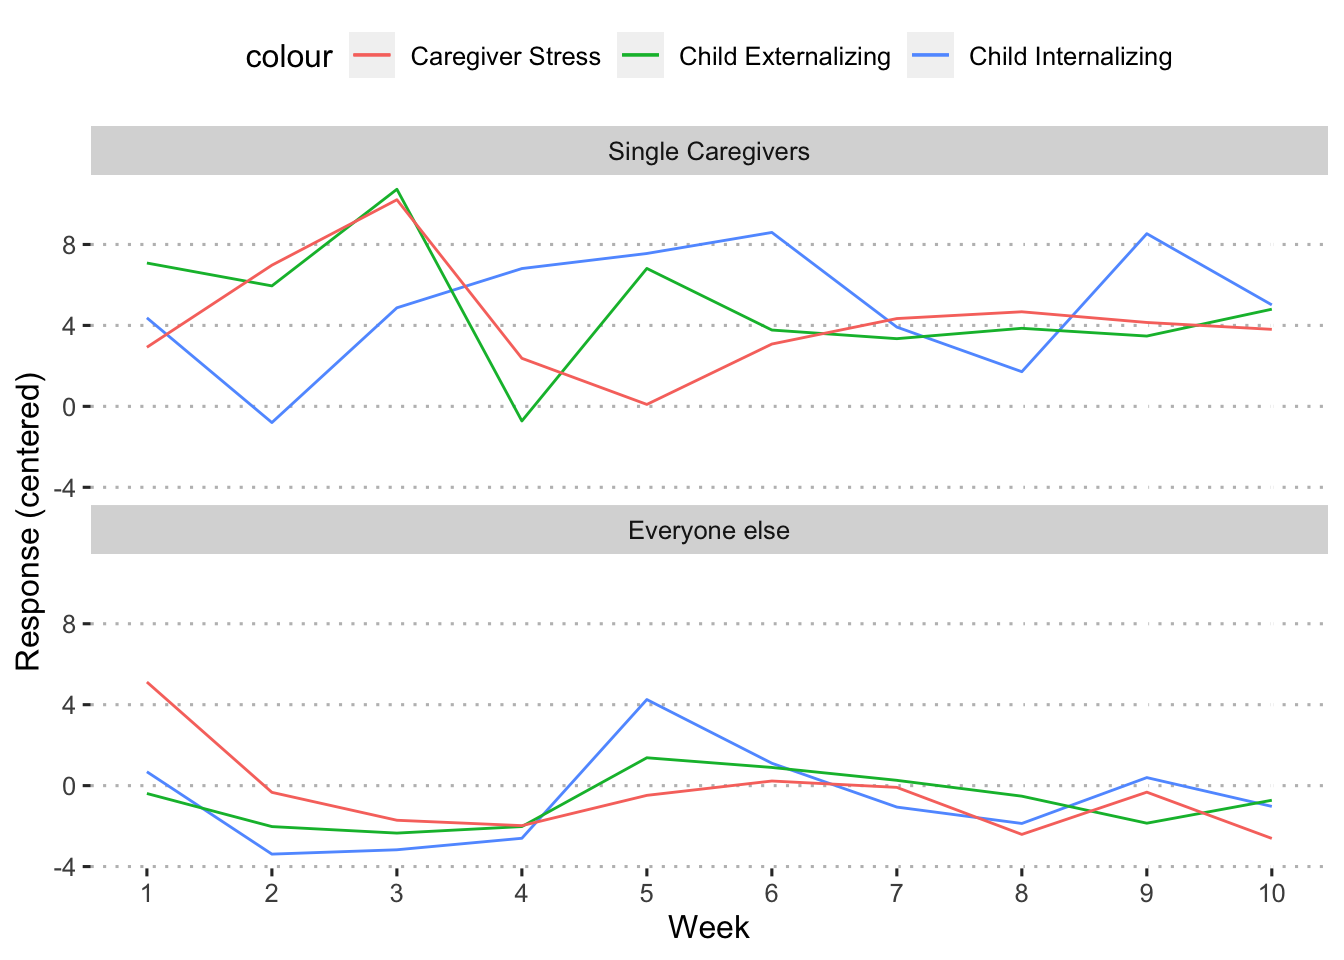
Single Parents
Children with disabilites
3+ Children
Grouping
This group represents the combination of Black, low income, and single caregivers.