Food Insecurity and Material Hardship
Food insecurity
Representativeness disclaimer
These analyses are based on responses collected from 3265 caregivers between the dates of August 11, 2020 and December 03, 2020. These caregivers represent a range of voices: 7.20% are Black/African American, 15.83% are LatinX, and 26.06% live at or below 1.5 times the federal poverty line. Proportions/percentages are calculated based on the item-level response rates, not out of the total sample size. The data for these analyses are not weighted.
All
Race/ethnicity
Black
Income
Race + Income
Medicaid expansion
Material hardship
Which needs are hard to pay for?: - Food - Housing - Utilities (electric, water, trash) - Healthcare - Social - Emotional - Childcare - Other
Caregivers grouped into two categories: trouble paying for 1+ basic need, or no trouble paying for any.
For these analyses, data collected in even numbered weeks starting in August were merged with data in the previous week – this was due to a shift to a recruitment strategy that prioritized recruiting underrepresented communities and marginalized caregivers every other week.
Representativeness disclaimer
These analyses are based on responses collected from 4190 caregivers between the dates of April 14, 2020 and December 01, 2020. These caregivers represent a range of voices: 7.90% are Black/African American, 16.66% are LatinX, and 26.01% live at or below 1.5 times the federal poverty line. Proportions/percentages are calculated based on the item-level response rates, not out of the total sample size. The data for these analyses are not weighted.
All
Black
Income
Race + Income
##
## Call:
## glm(formula = material_hardship ~ Week * race_ethnic * poverty_cat,
##     family = "binomial", data = hardship_scored)
##
## Deviance Residuals:
##     Min       1Q   Median       3Q      Max
## -1.5214  -0.7526  -0.6648   1.0077   1.8867
##
## Coefficients:
##                                               Estimate Std. Error z value Pr(>|z|)
## (Intercept)                                  -0.439900   0.196403  -2.240 0.025105 *
## Week                                         -0.003125   0.008543  -0.366 0.714542
## race_ethnicLatinX                            -0.599777   0.230518  -2.602 0.009272 **
## race_ethnicWhite                             -1.188201   0.204838  -5.801  6.6e-09 ***
## poverty_catLow Income                         1.035784   0.288196   3.594 0.000326 ***
## Week:race_ethnicLatinX                        0.030122   0.010255   2.937 0.003310 **
## Week:race_ethnicWhite                         0.019626   0.008950   2.193 0.028316 *
## Week:poverty_catLow Income                   -0.006013   0.012703  -0.473 0.635978
## race_ethnicLatinX:poverty_catLow Income       0.353380   0.348930   1.013 0.311178
## race_ethnicWhite:poverty_catLow Income        0.796799   0.308839   2.580 0.009881 **
## Week:race_ethnicLatinX:poverty_catLow Income -0.008687   0.015835  -0.549 0.583307
## Week:race_ethnicWhite:poverty_catLow Income  -0.001414   0.013721  -0.103 0.917906
## ---
## Signif. codes:  0 '***' 0.001 '**' 0.01 '*' 0.05 '.' 0.1 ' ' 1
##
## (Dispersion parameter for binomial family taken to be 1)
##
##     Null deviance: 21943  on 17261  degrees of freedom
## Residual deviance: 19830  on 17250  degrees of freedom
##   (1066 observations deleted due to missingness)
## AIC: 19854
##
## Number of Fisher Scoring iterations: 4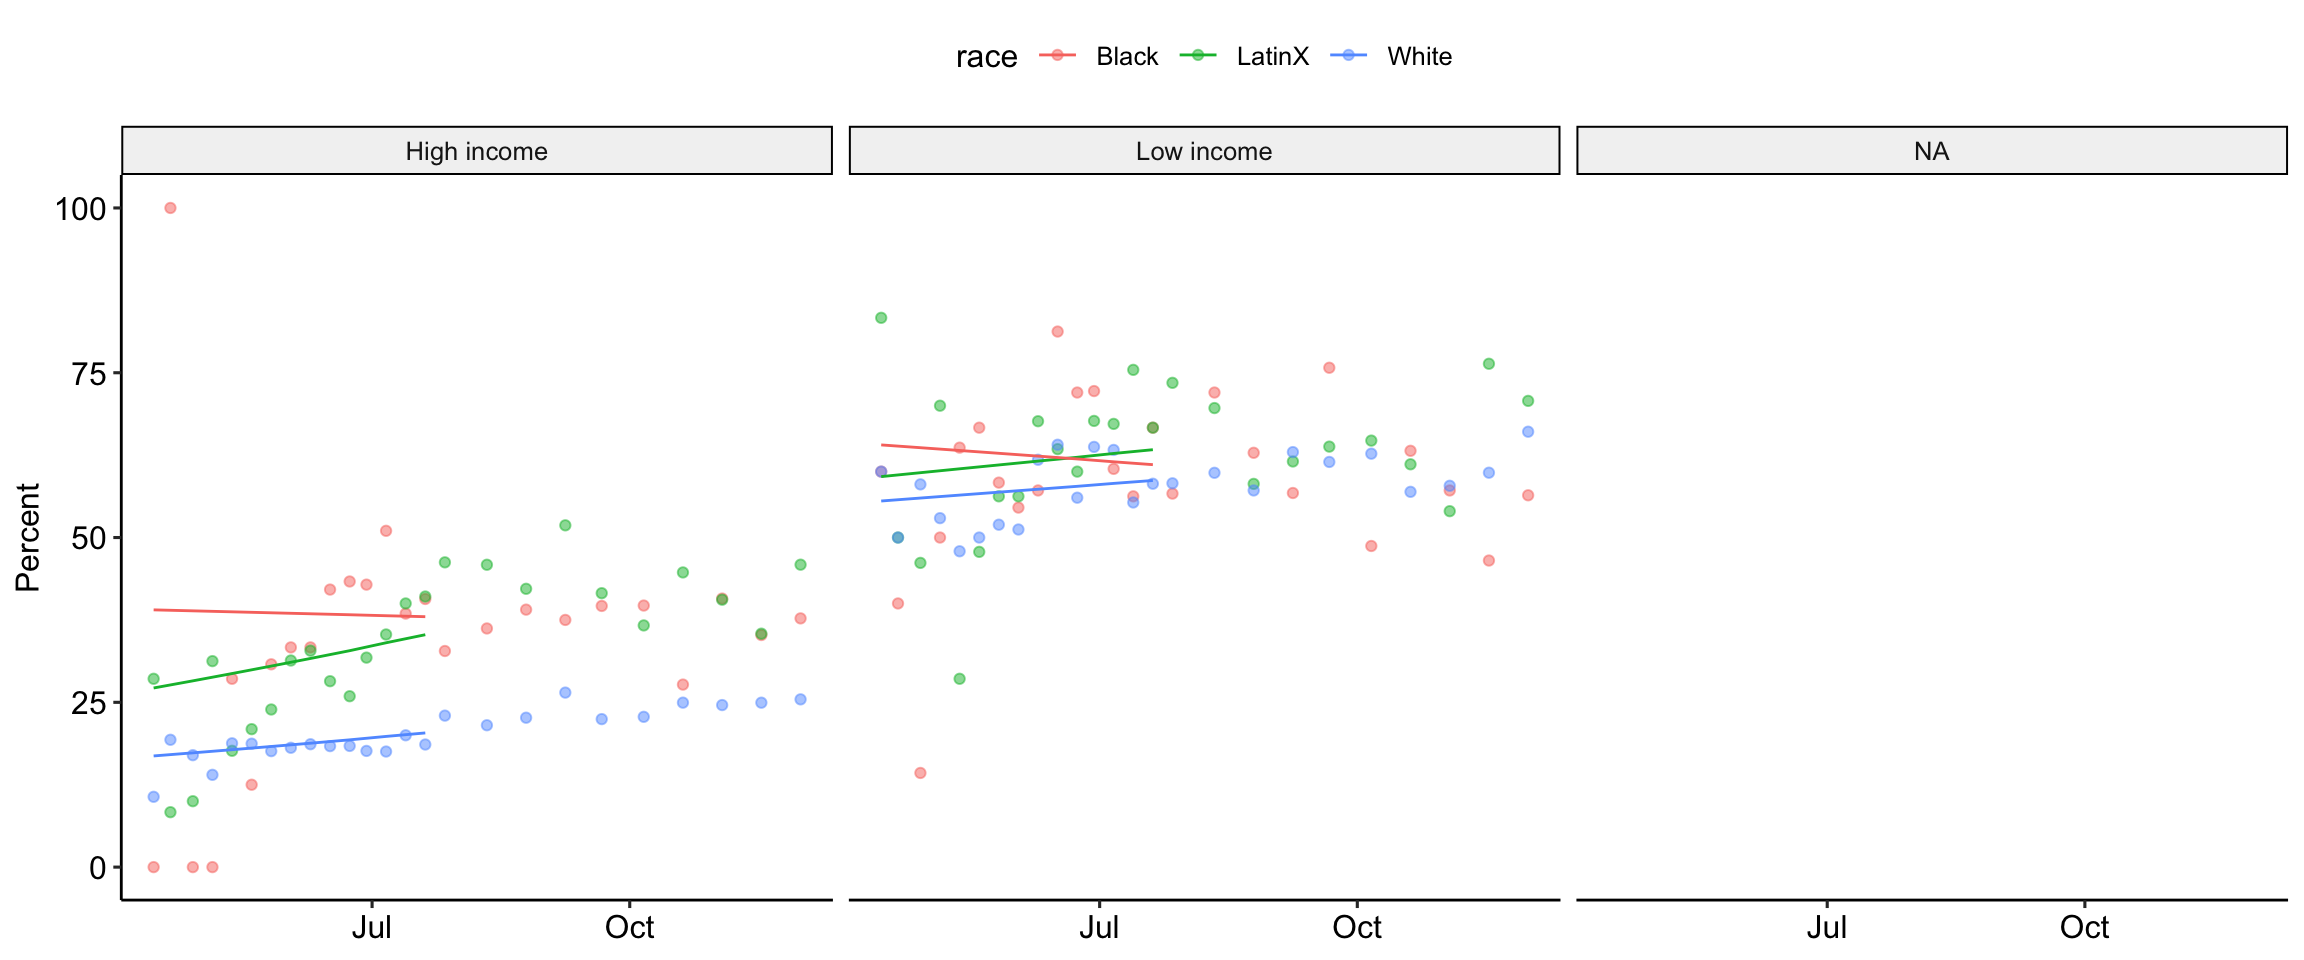
Medicaid expansion
Single
Disability
Family financial status
Which describes your family financially at this time?: - No problems - Minor problems - Major problems _ Extreme problems
For these analyses, data collected in even numbered weeks starting in August were merged with data in the previous week – this was due to a shift to a recruitment strategy that prioritized recruiting underrepresented communities and marginalized caregivers every other week.
Representativeness disclaimer
These analyses are based on responses collected from 4190 caregivers between the dates of April 14, 2020 and December 01, 2020. These caregivers represent a range of voices: 7.90% are Black/African American, 16.66% are LatinX, and 26.01% live at or below 1.5 times the federal poverty line. Proportions/percentages are calculated based on the item-level response rates, not out of the total sample size. The data for these analyses are not weighted.
All
Black
Income
Race + Income
Medicaid expansion
Single
Disability
Looking ahead
How worried are you about having enough money to pay for food to feed your household in the next month?
If you rent the place you currently live, how worried are you about being evicted in the next month?
If you own the home where you currently live, how worried are you about your mortgage being foreclosed on in the next month?
How worried are you about your utilities (water, electric, gas) being turned off in the next month?
Response options: - Not at all worried - Slightly worried - Somewhat worried - Very worried - Extremely worried
For these analyses, data collected in even numbered weeks starting in August were merged with data in the previous week – this was due to a shift to a recruitment strategy that prioritized recruiting underrepresented communities and marginalized caregivers every other week.
Representativeness disclaimer
These analyses are based on responses collected from 3037 caregivers between the dates of August 11, 2020 and November 17, 2020. These caregivers represent a range of voices: 7.24% are Black/African American, 16.27% are LatinX, and 26.05% live at or below 1.5 times the federal poverty line. Proportions/percentages are calculated based on the item-level response rates, not out of the total sample size. The data for these analyses are not weighted.