Food Insecurity
Sihong
0. Sample Disclaimer
- This set of analyses on food insecurity is based on responses collected from 3,284 caregivers between the dates of August 11th 2020 and December 3rd 2020. These caregivers represent a range of voices: 6.82% are non-Latinx Black/African American, 16.11% are Latinx, and 27.61% live at or below 1.5 times the federal poverty line. Proportions/percentages are calculated based on the item-level response rates, not out of the total sample size. The data for these analyses are not weighted.
## [1] "2020-08-11 07:02:30 UTC"## [1] "2020-12-03 20:04:53 UTC"## fi_rct$race_ethnic n percent valid_percent
## Black 207 0.0652379452 0.06525851
## Latinx 506 0.1594705326 0.15952081
## White 2459 0.7749763631 0.77522068
## <NA> 1 0.0003151592 NA## fi_rct$poverty_cat n percent valid_percent
## Above 150%FPL 2275 0.716987078 0.7238307
## Below 150%FPL 868 0.273558147 0.2761693
## <NA> 30 0.009454775 NA1. Prevalence of Food Insecurity
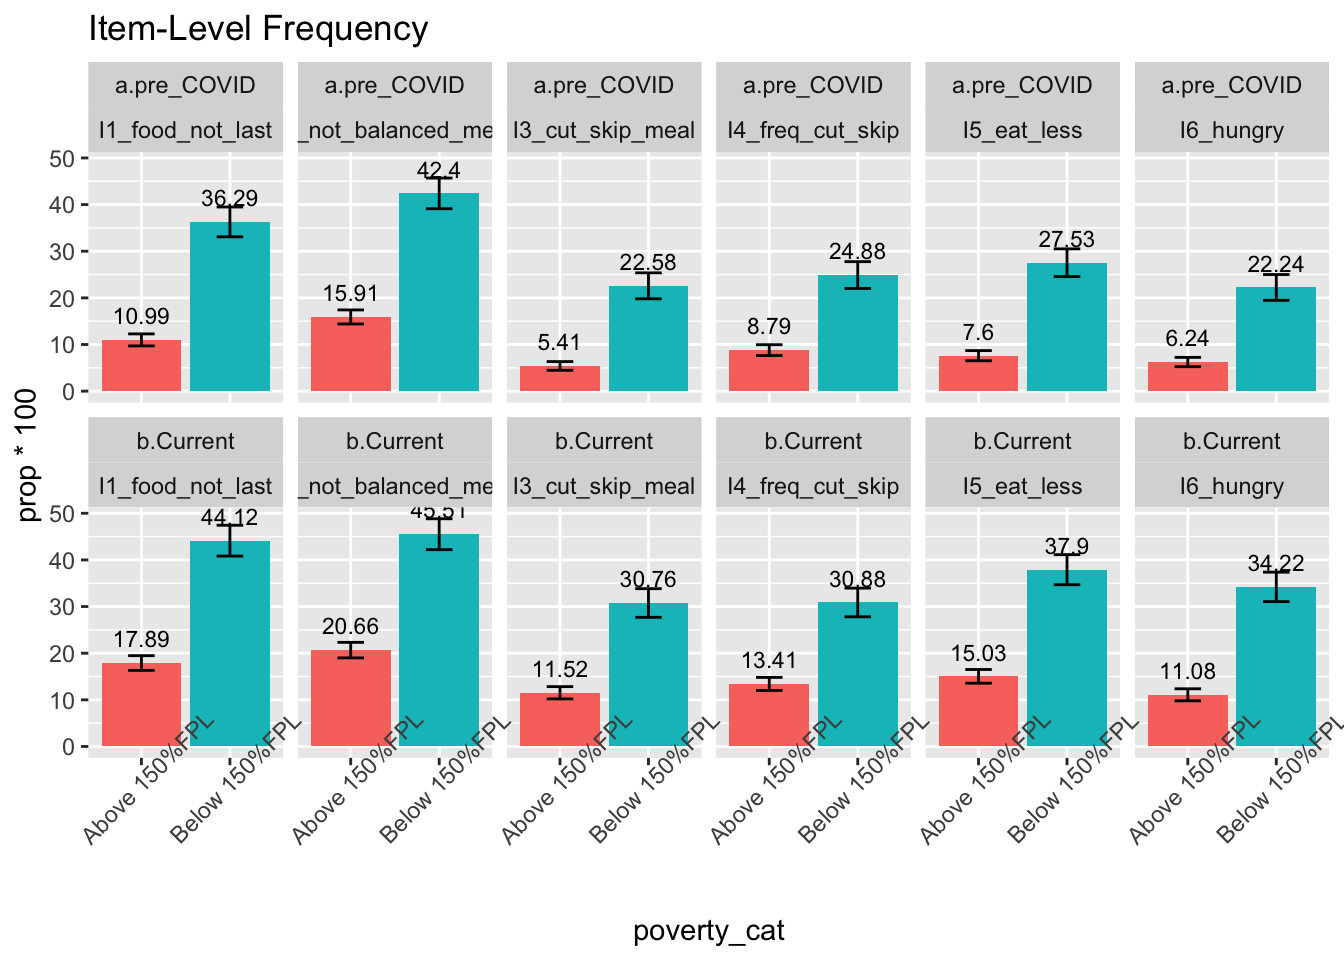
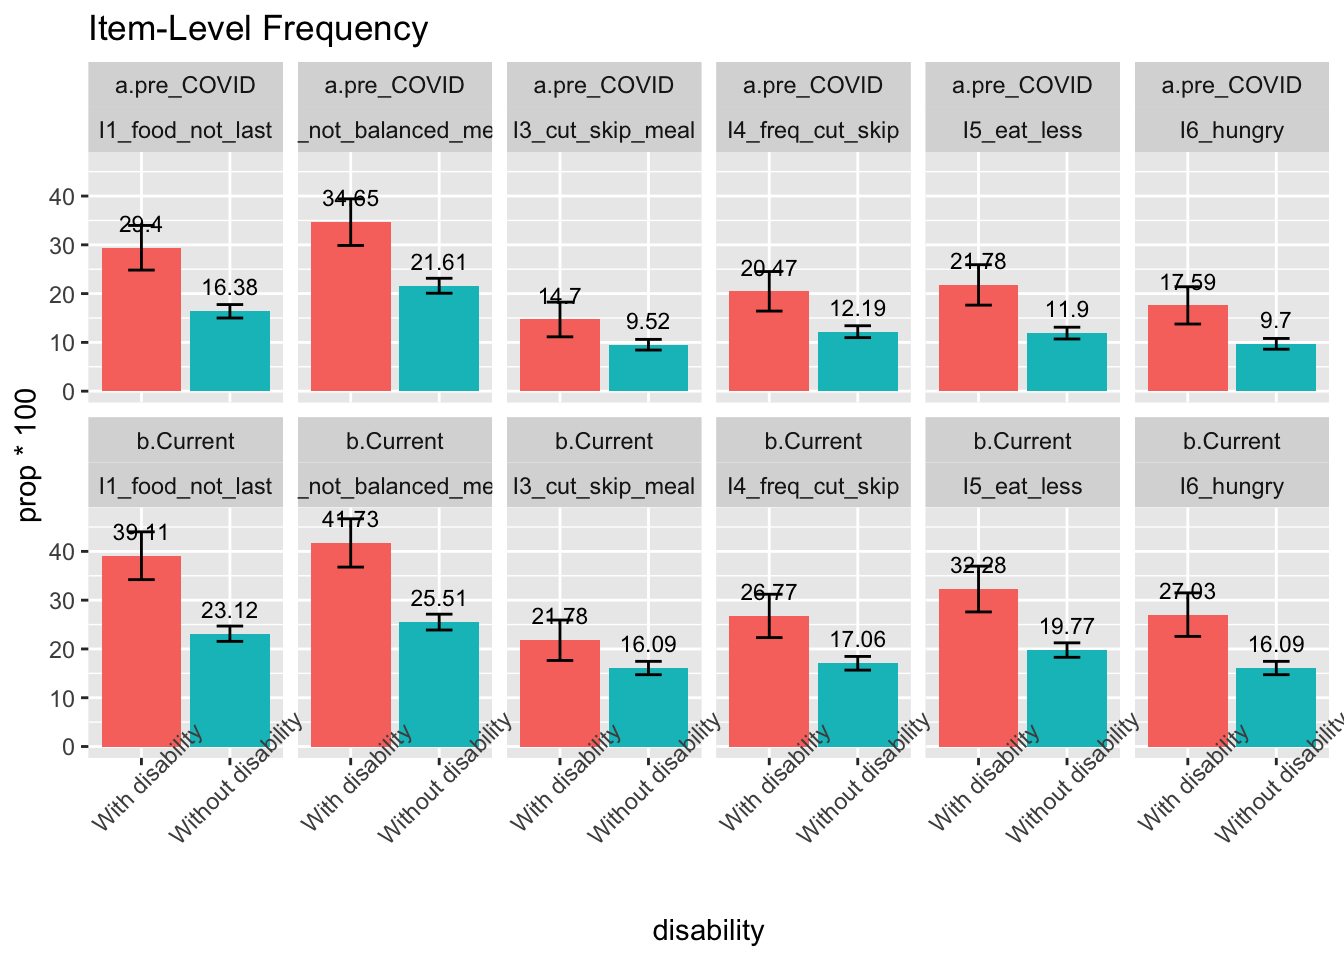
- Survey Questions: For these following statements, please indicate whether the statement was often true, sometimes true, or never true for your household prior to/since the coronavirus (COVID-19) pandemic:
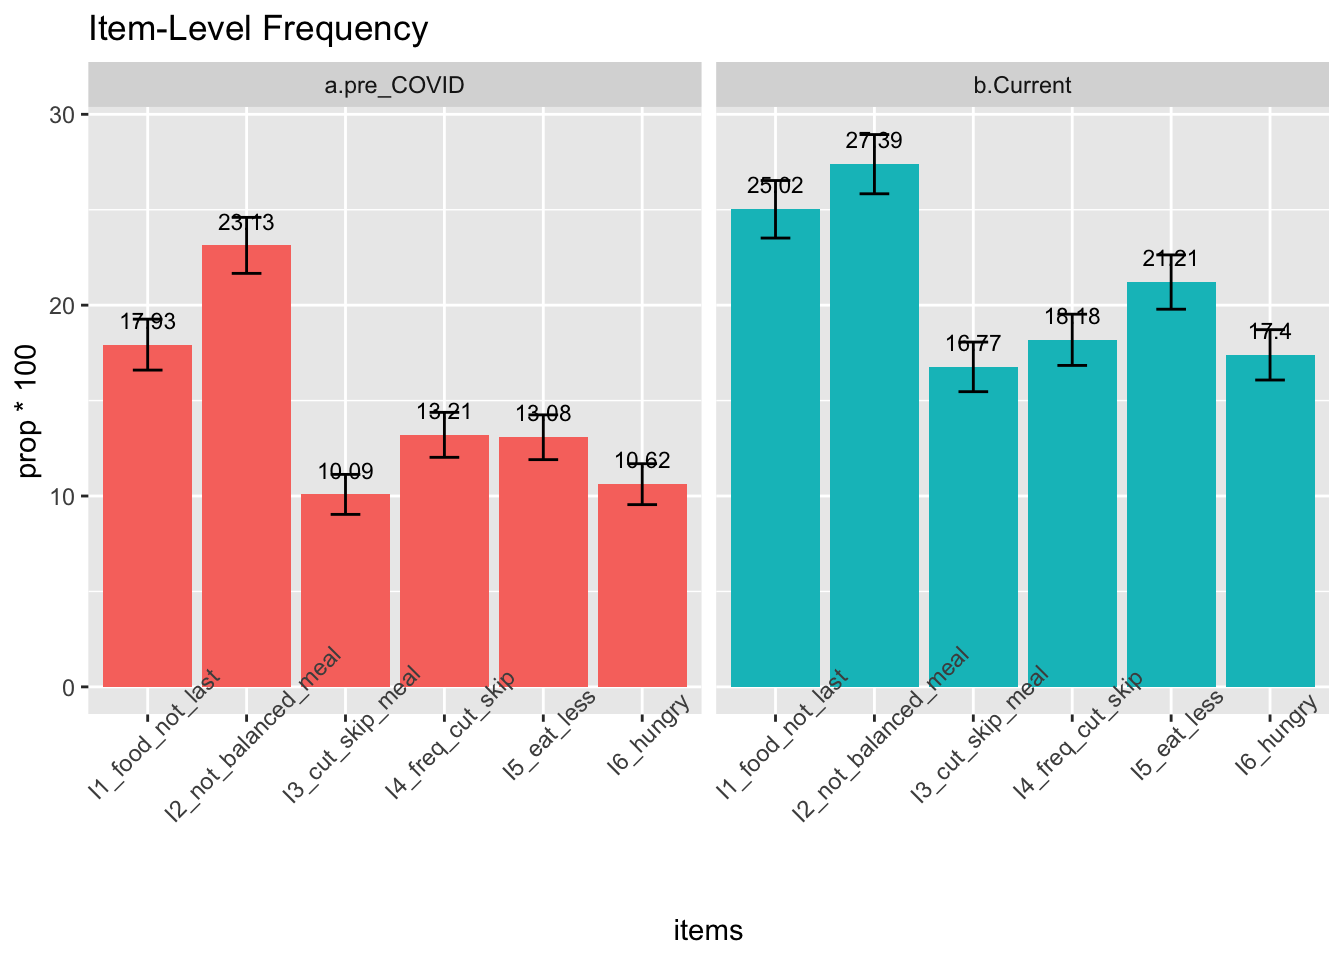
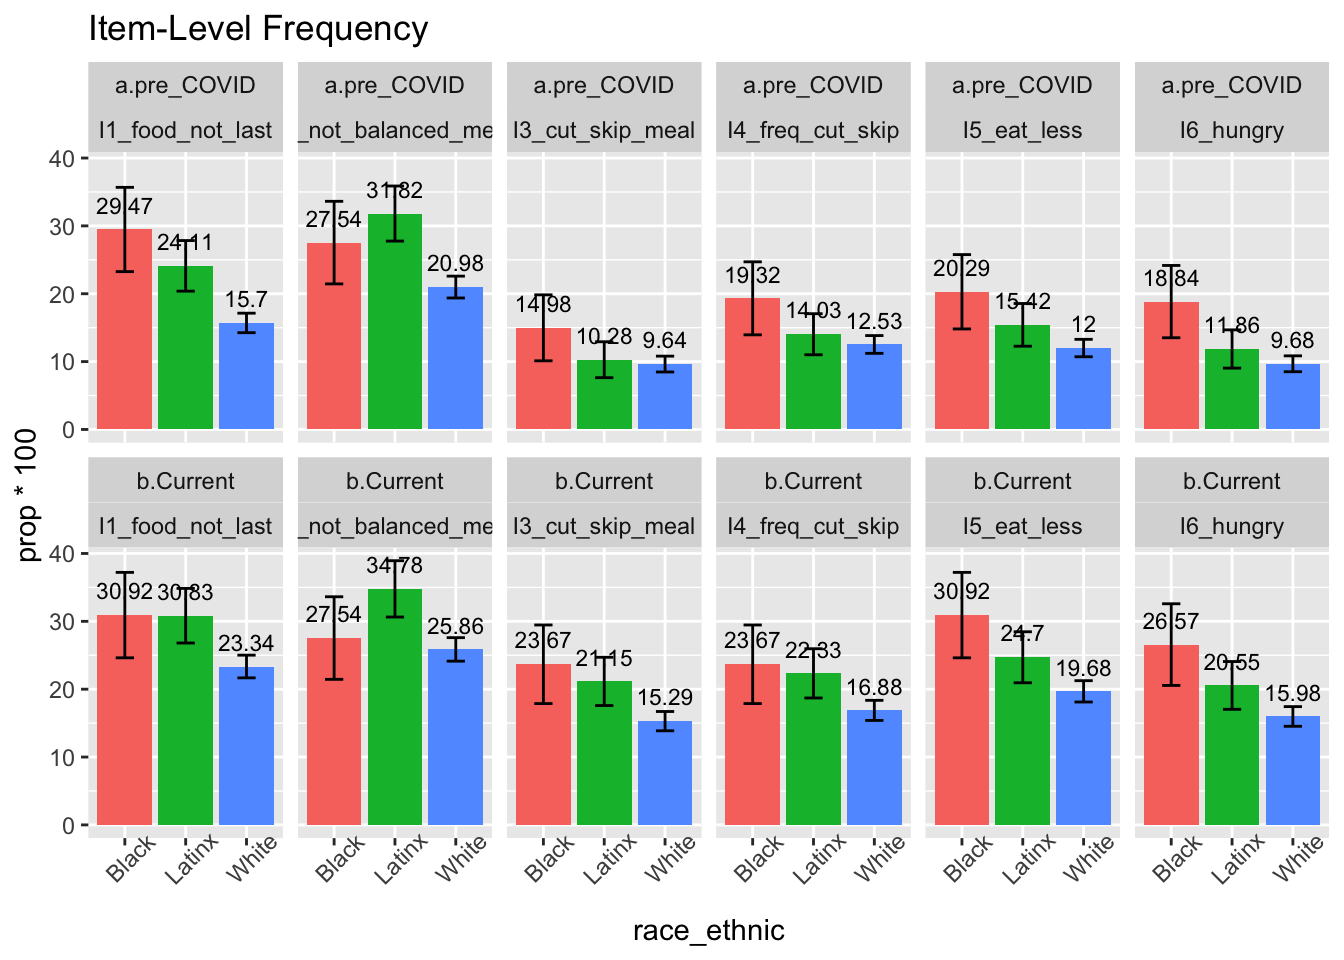
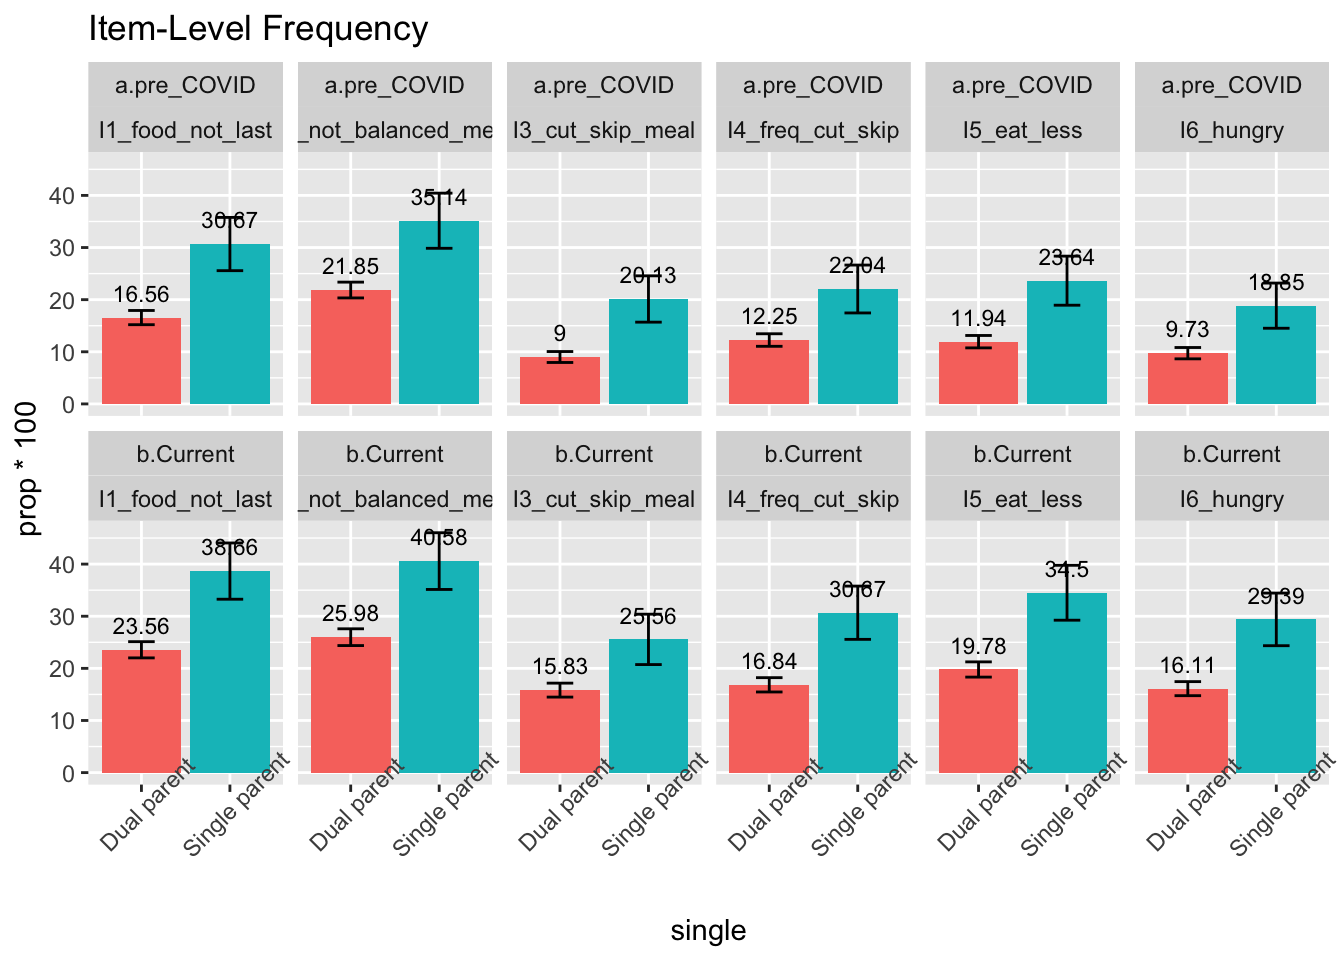
- I1. The food that we bought just didn’t last, and we didn’t have money to get more (often true/sometimes true/never true)
- I2. We couldn’t afford to eat balanced meals (often true/sometimes true/never true)
- I3. Did you or other adult in your household ever cut the size of your meal or skip meals because there wasn’t enough money for food? (yes/no)
- I4. if yes (I3), how often did this happen? (almost every month/some months but not every month/in only 1 or 2 months)
- I5. Did you ever eat less than you felt you should because there wasn’t enough money for food? (yes/no)
- I6. Were you ever hungry but didn’t eat because there wasn’t enough money for food? (yes/no)
- I1. The food that we bought just didn’t last, and we didn’t have money to get more (often true/sometimes true/never true)
- Note.
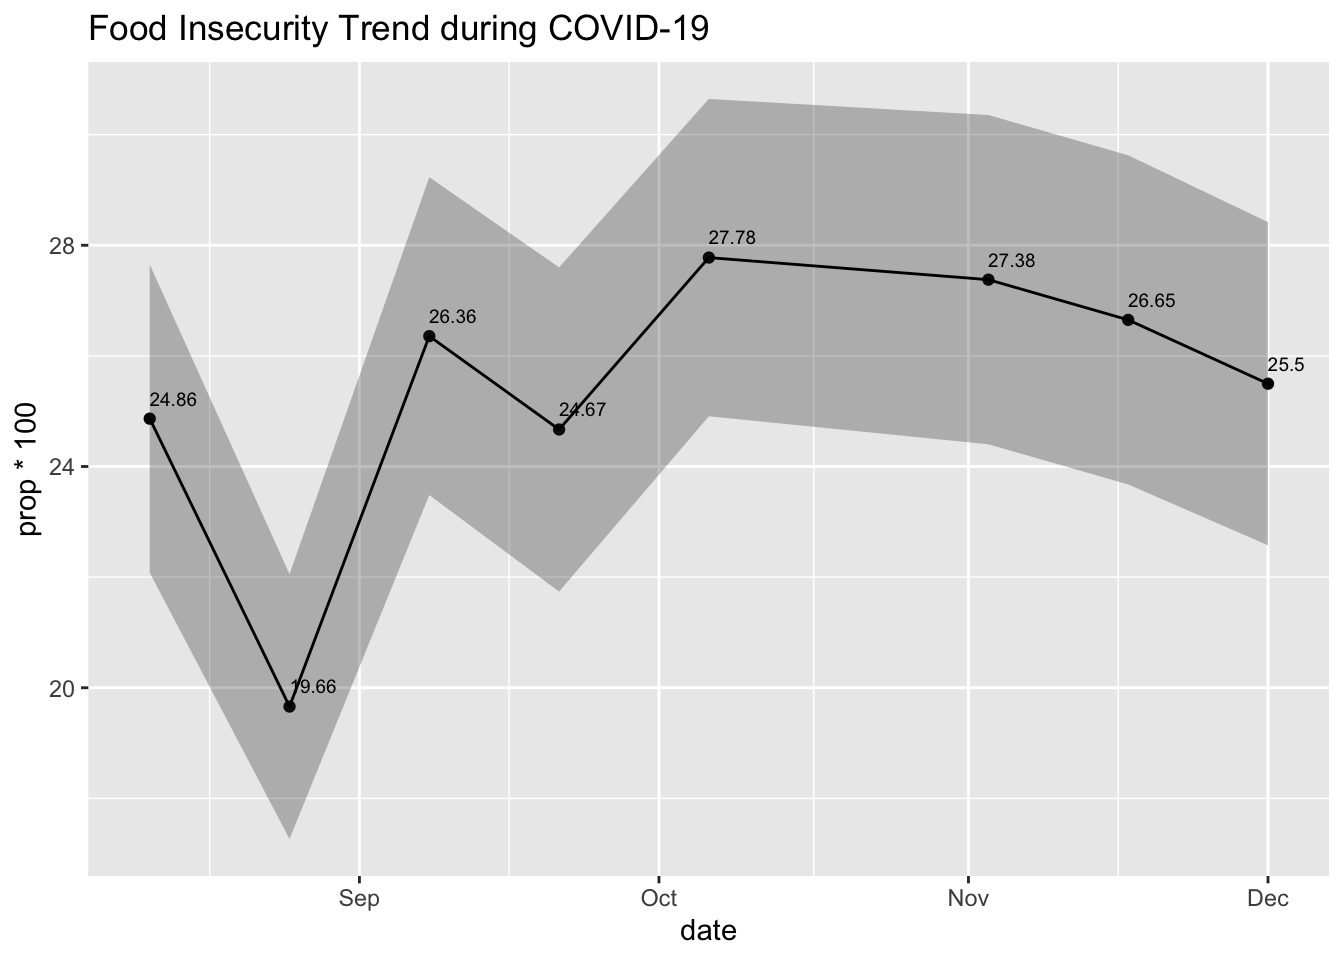
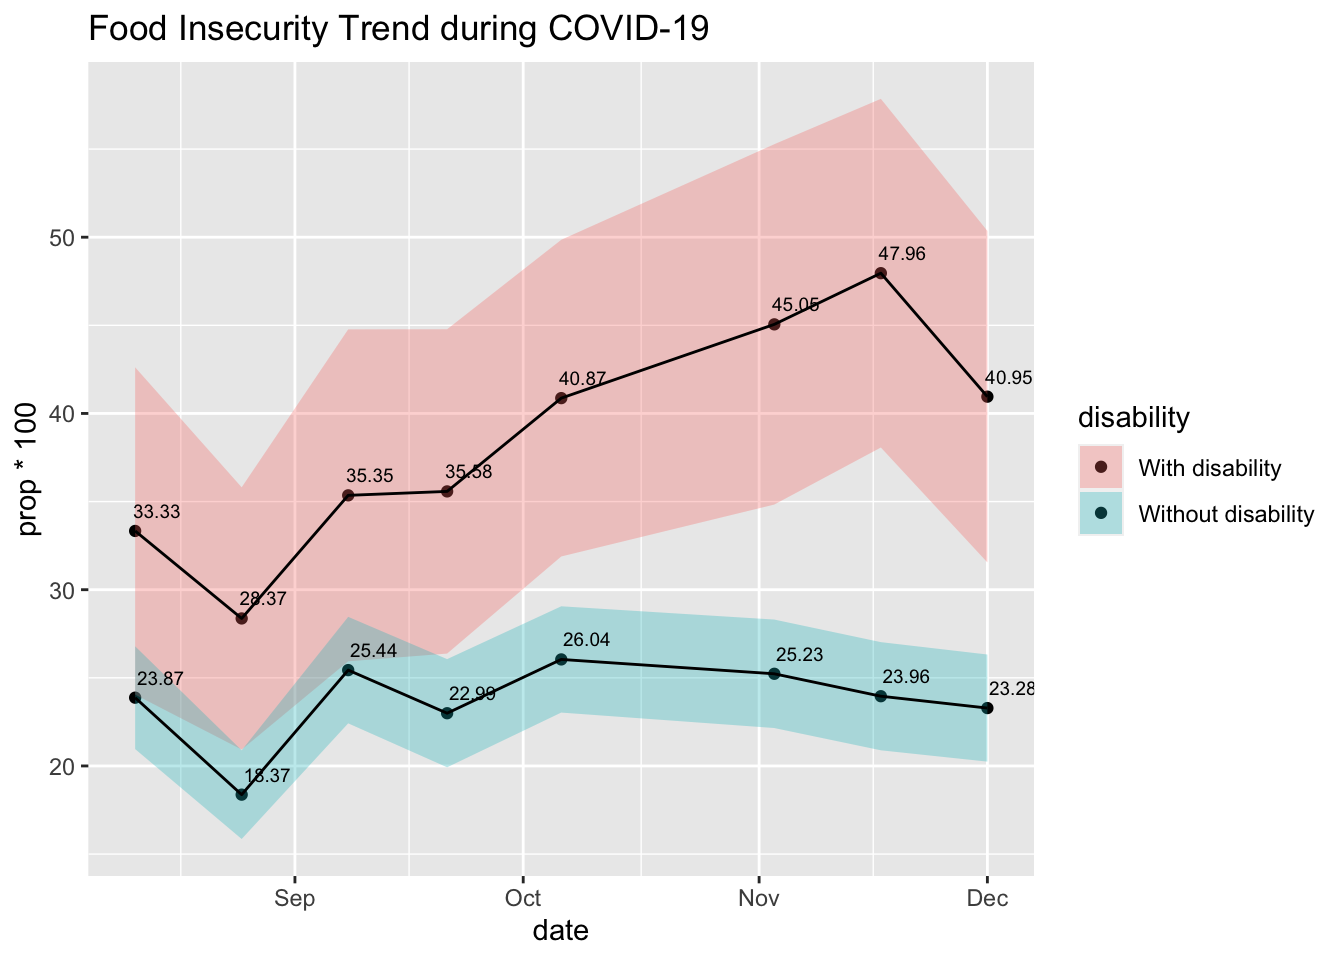
- Food insecurity data were collected on weeks 19, 21, 23, 25, 27, 31, 33, & 35 follow-up surveys.
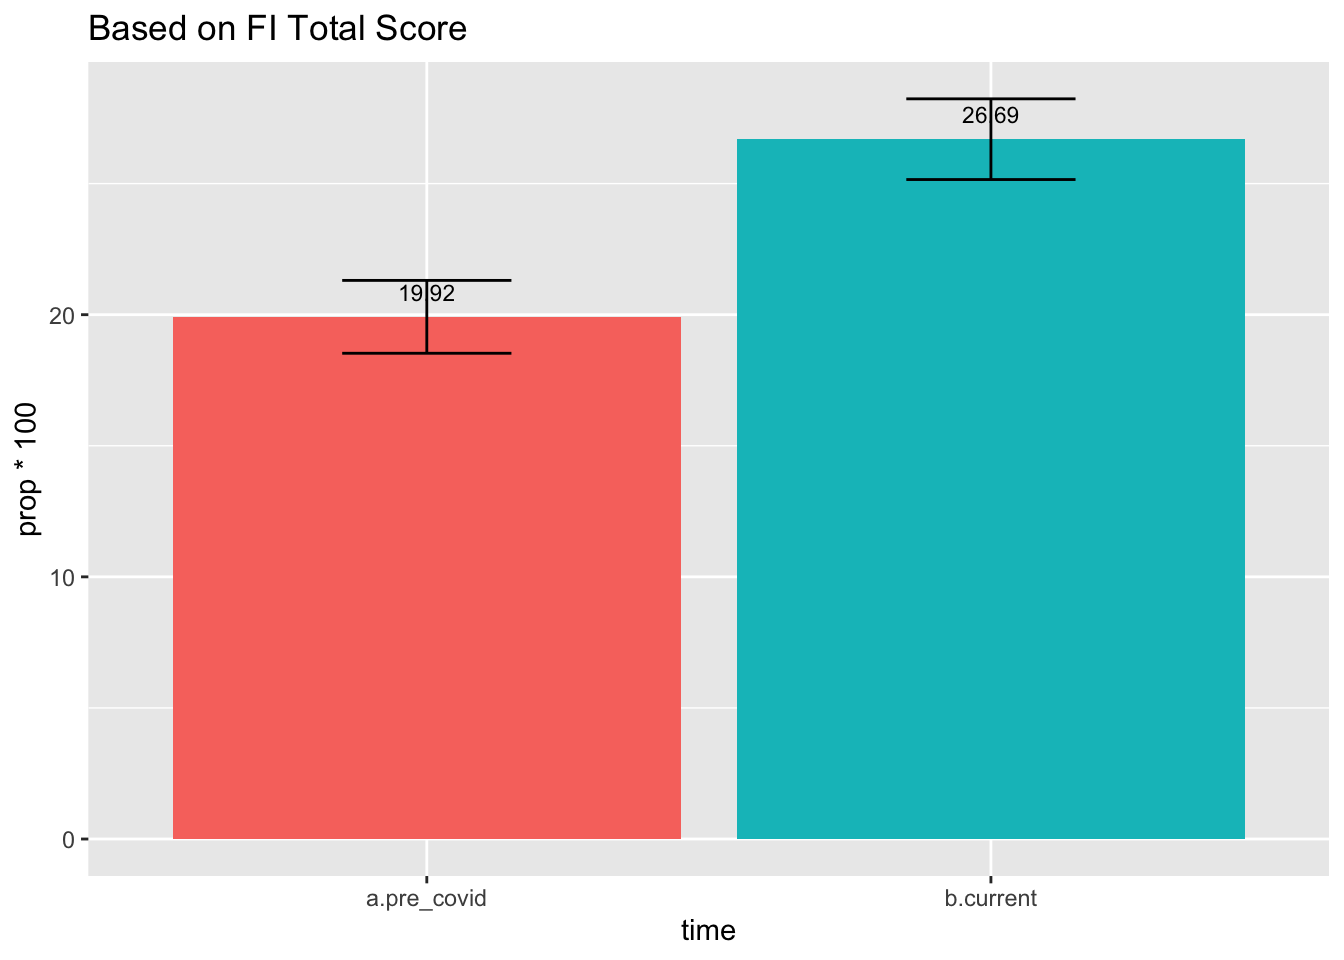
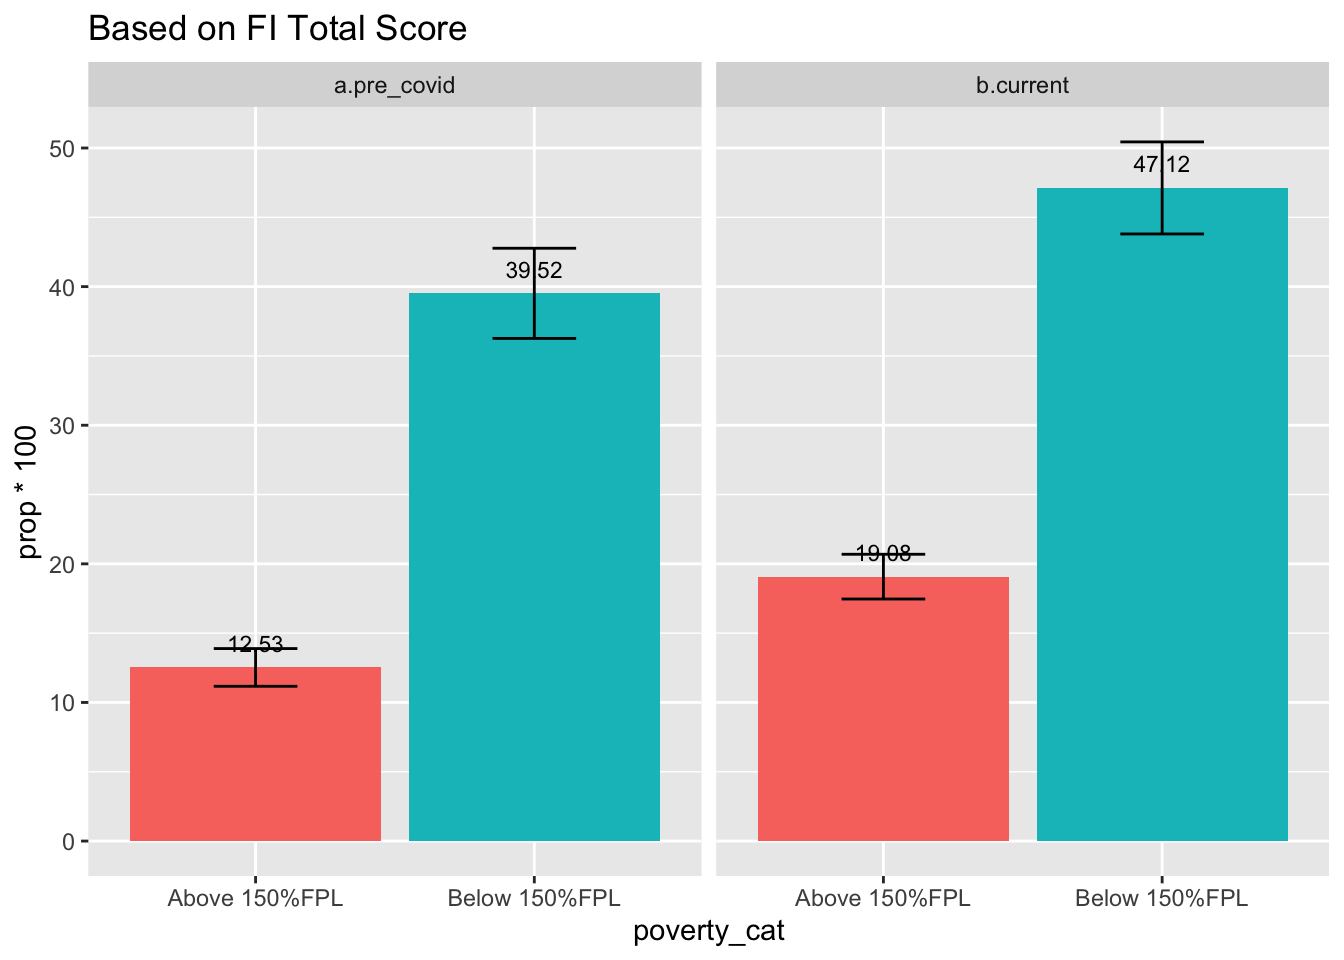
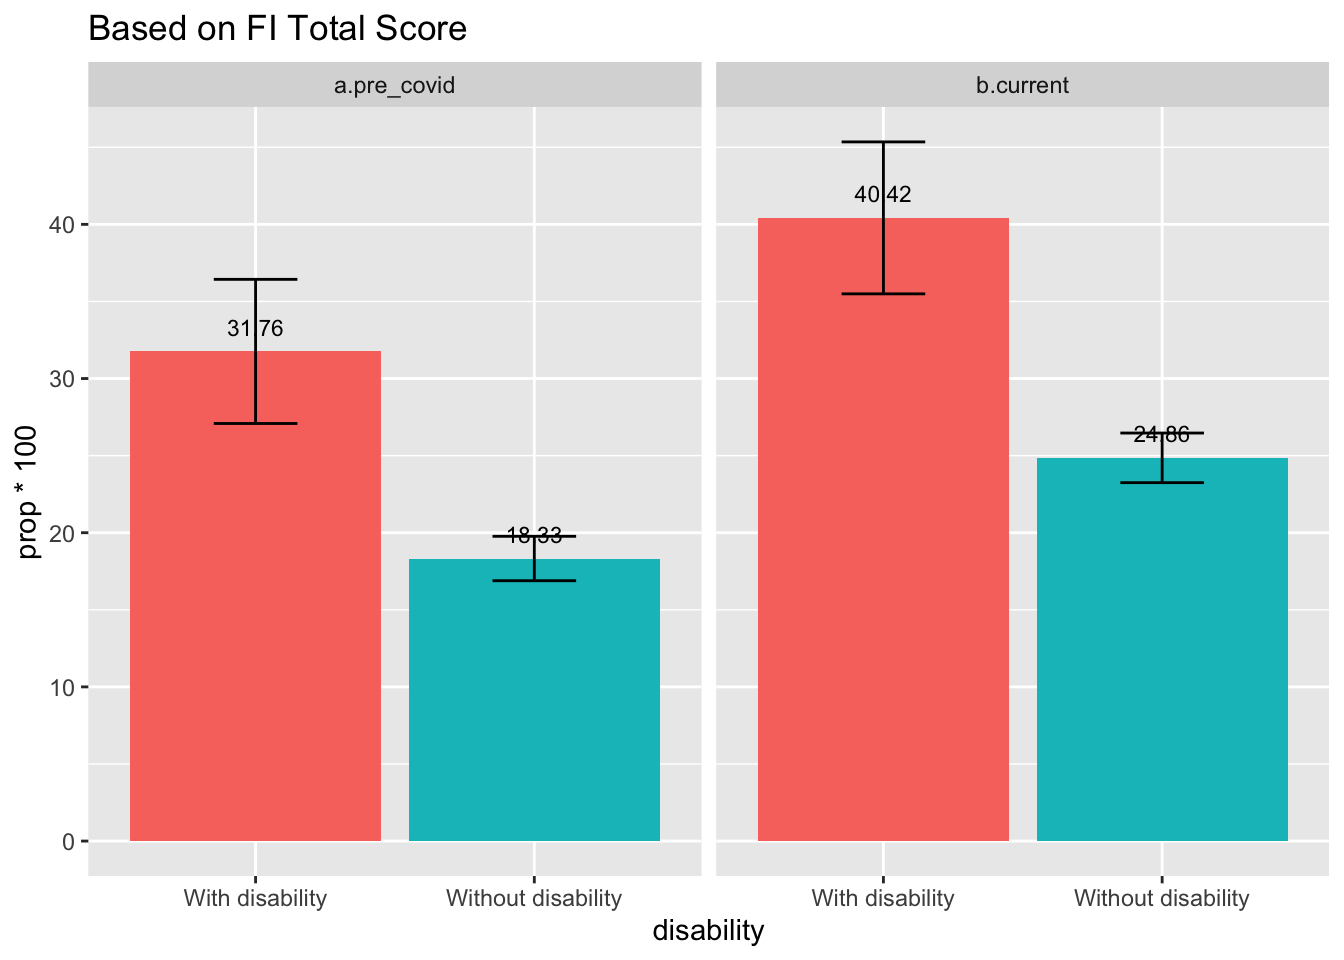
- Total scores of the six items were calculated, and families were considered in the “food insecurity” category if their total score was at or above 2.
- Food insecurity data were collected on weeks 19, 21, 23, 25, 27, 31, 33, & 35 follow-up surveys.
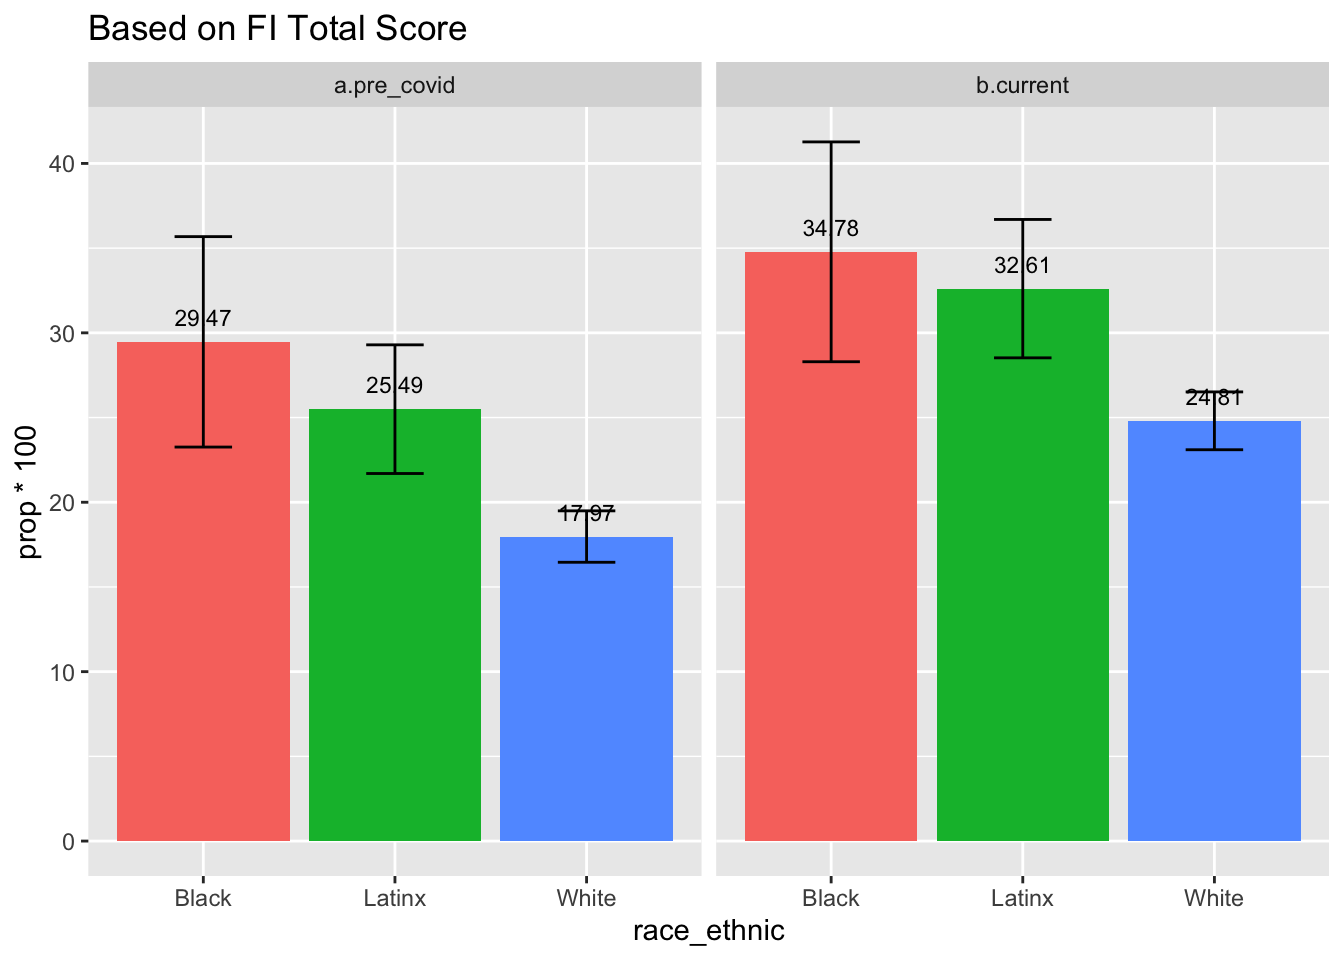
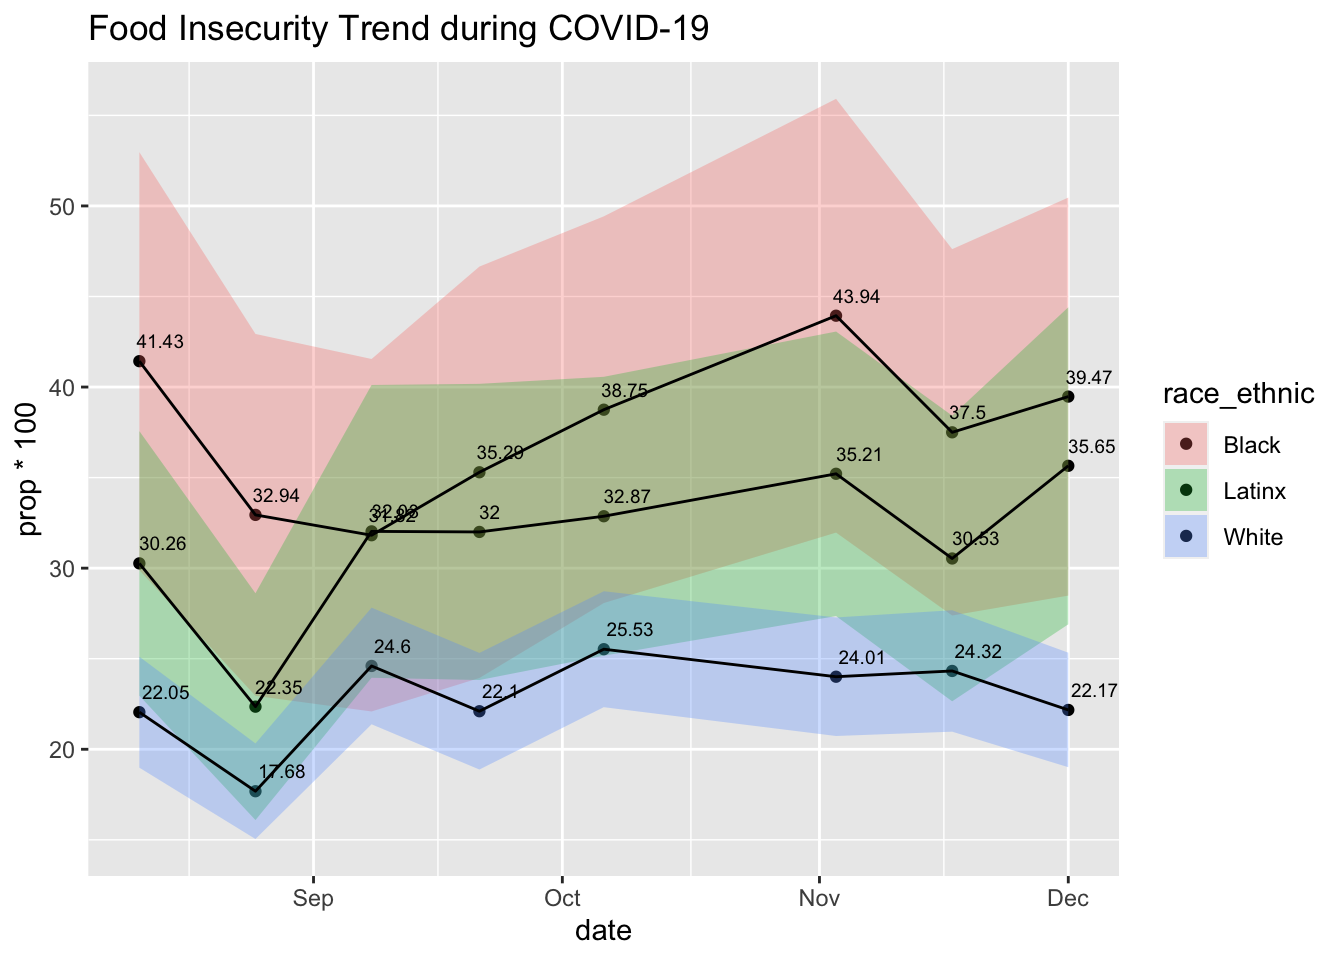
1.1 By race/ethnicity
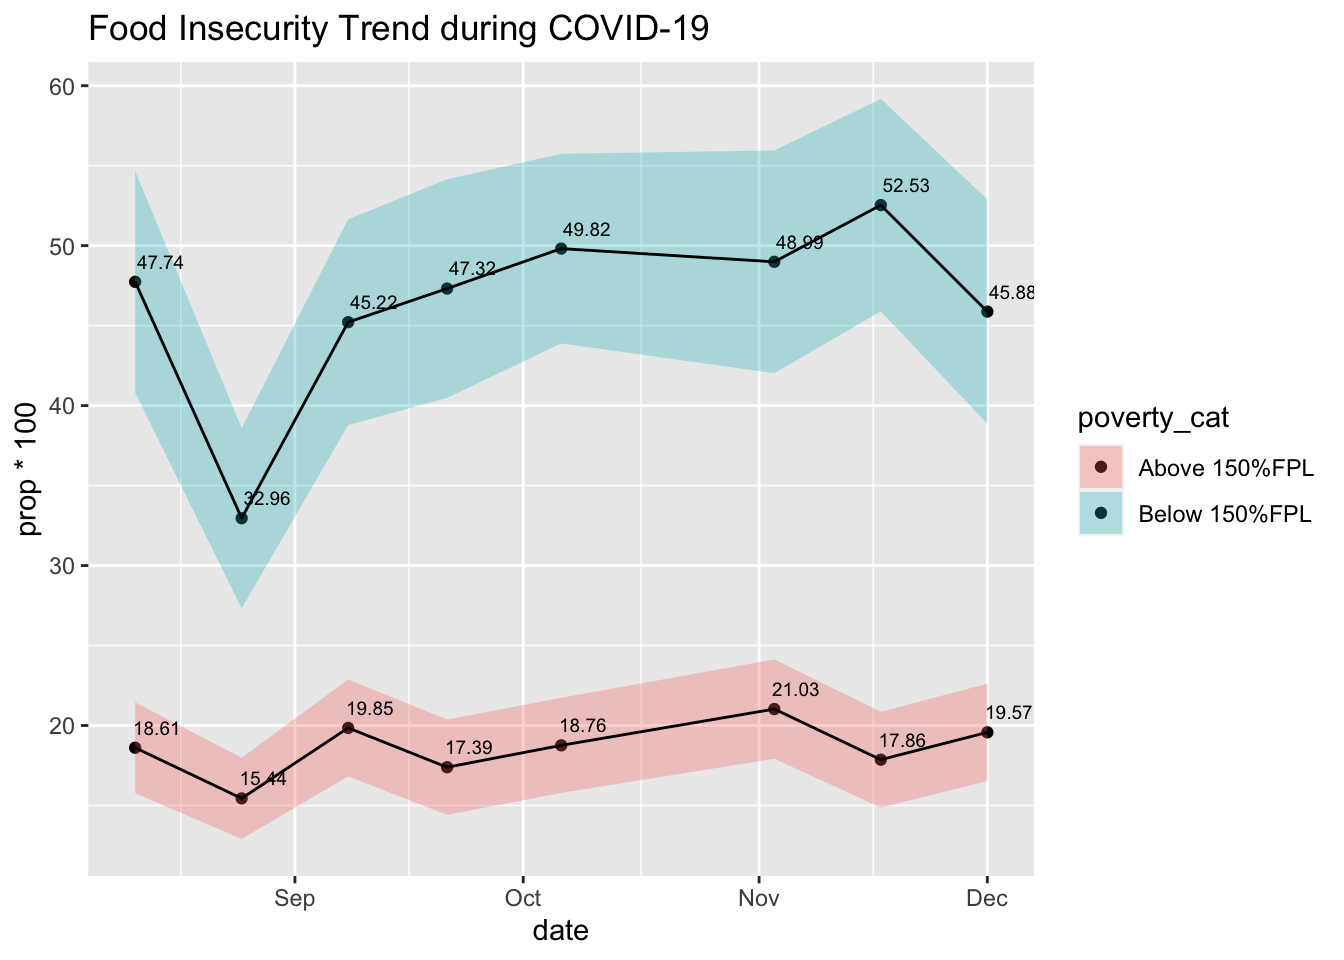
1.2 By poverty level
1.3 By Child Disability Status
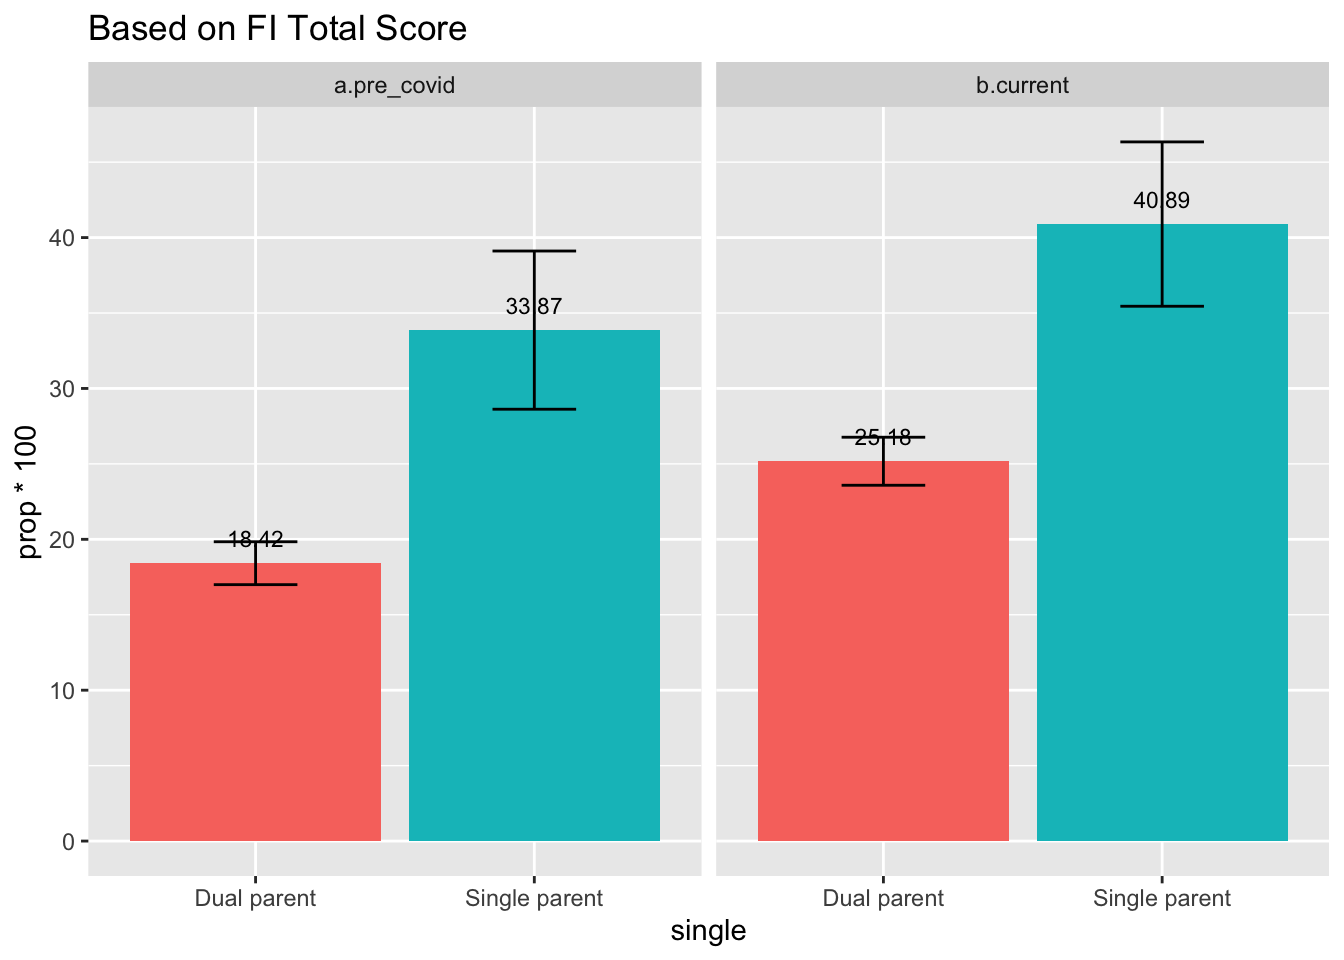
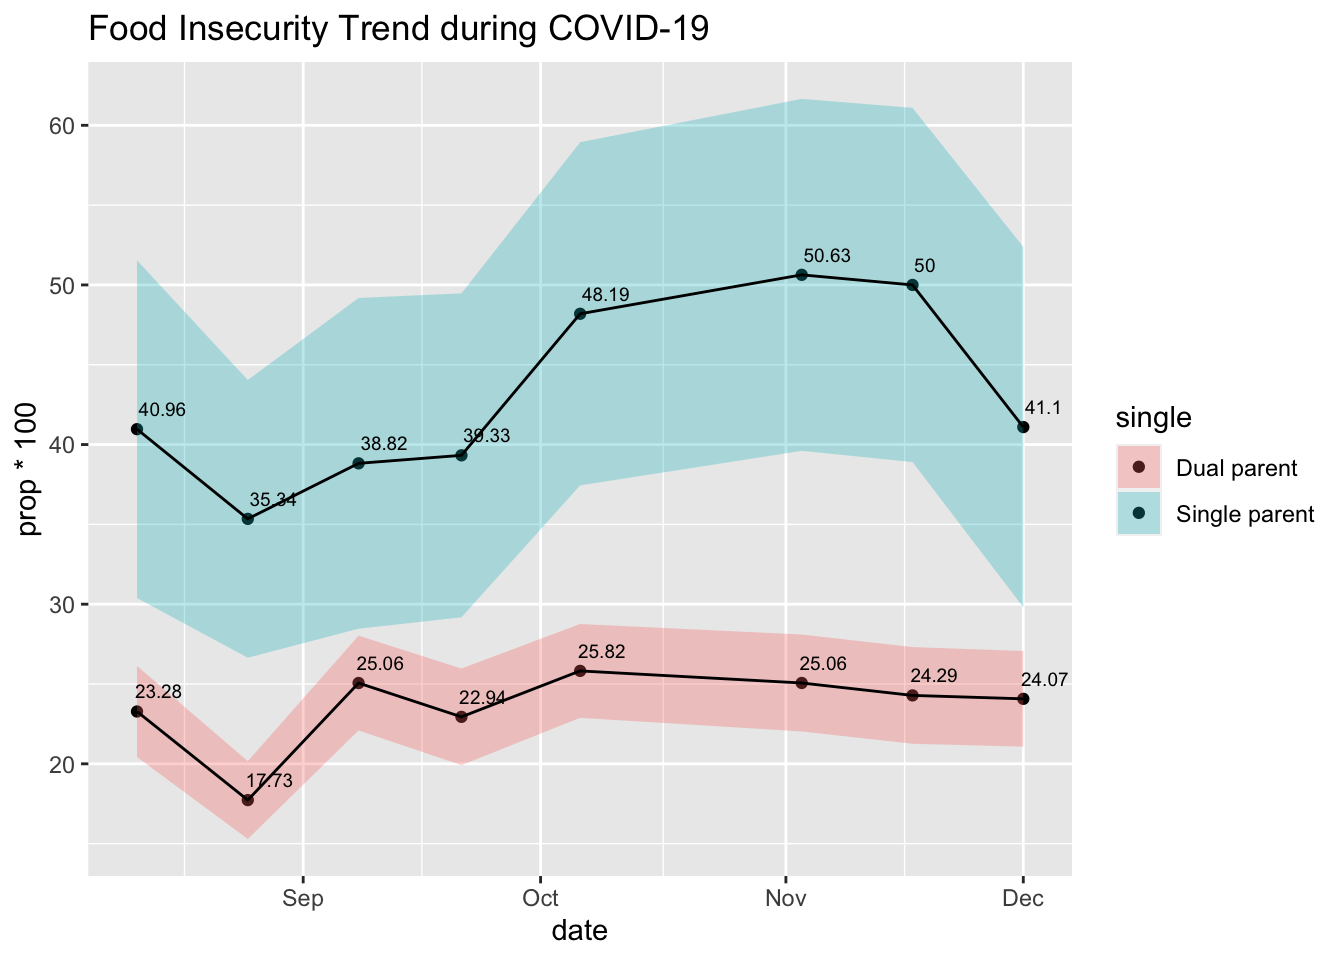
1.4 By Single Parent Status
2. Association Between Food Insecurity & Mental Health
2.1 Caregivers’ Mental Health
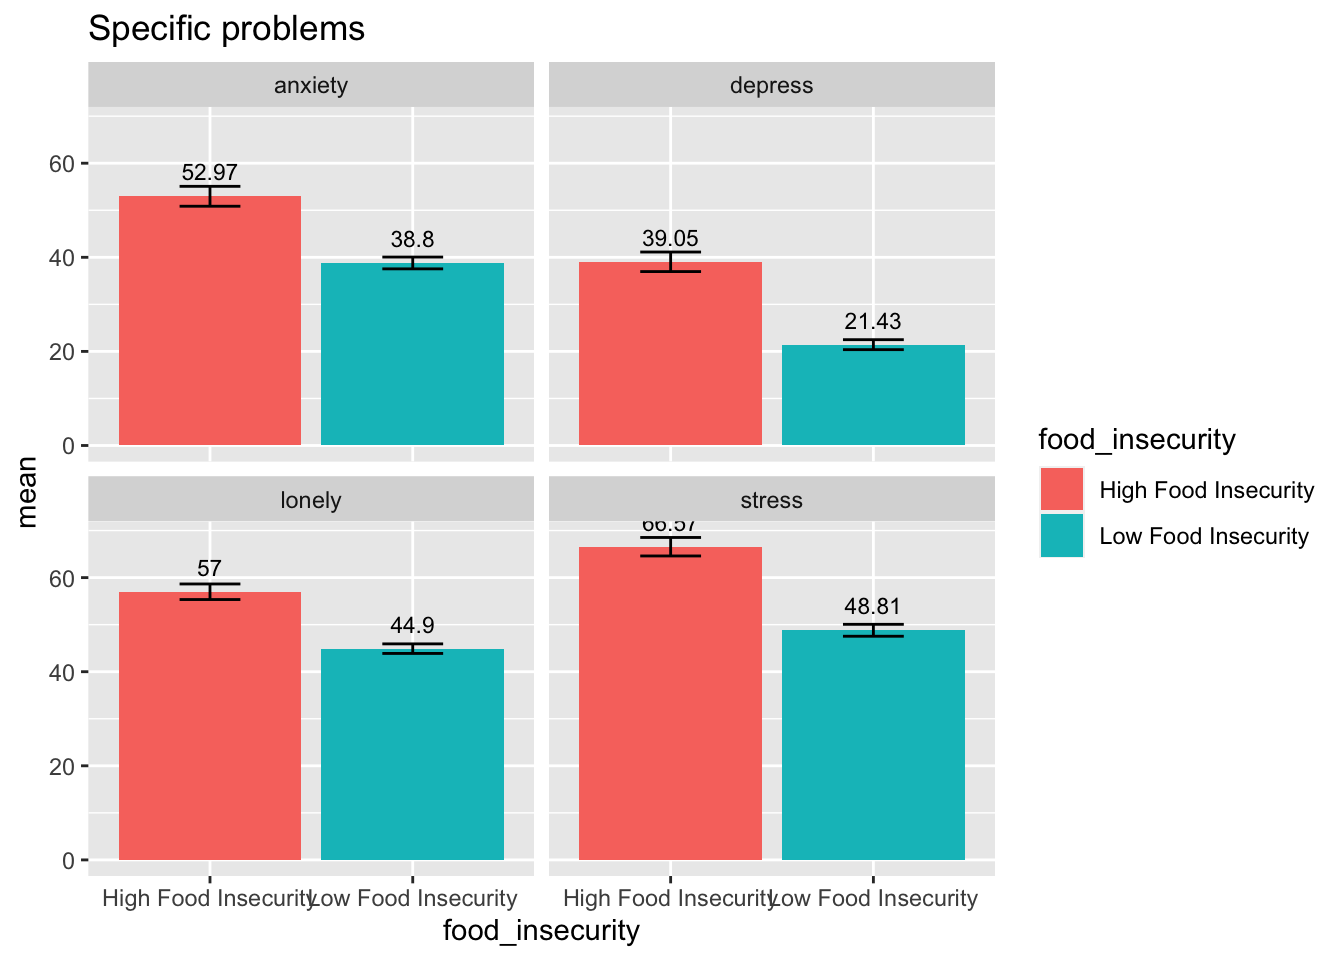
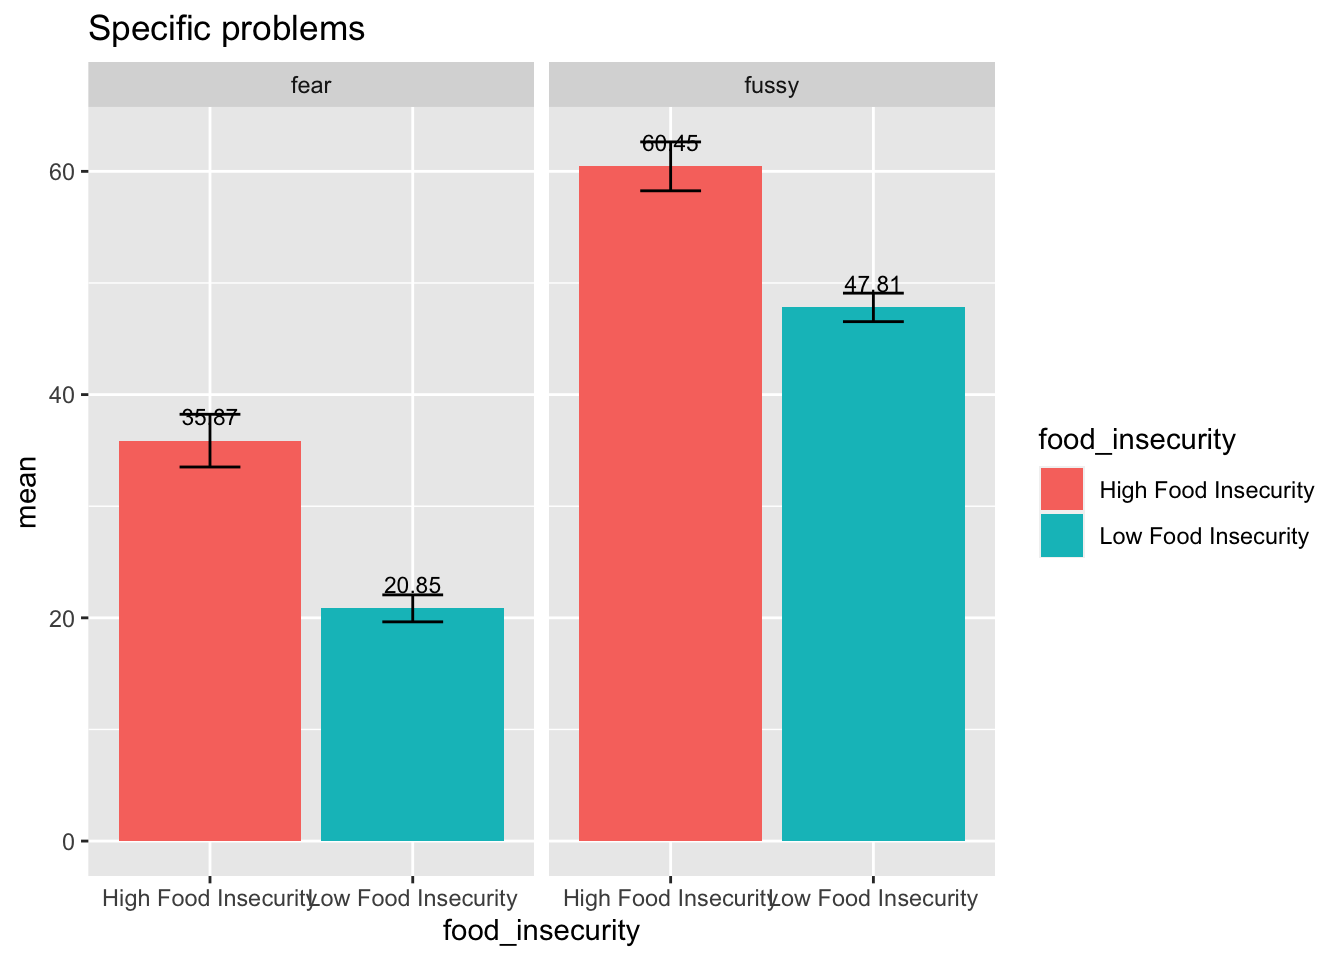
2.2 Child Mental Health

2.3 Chain of Hardship Effect
Mediation Analyses: Food Insecurity -> Caregivers’ Mental Health -> Children’s Mental Health
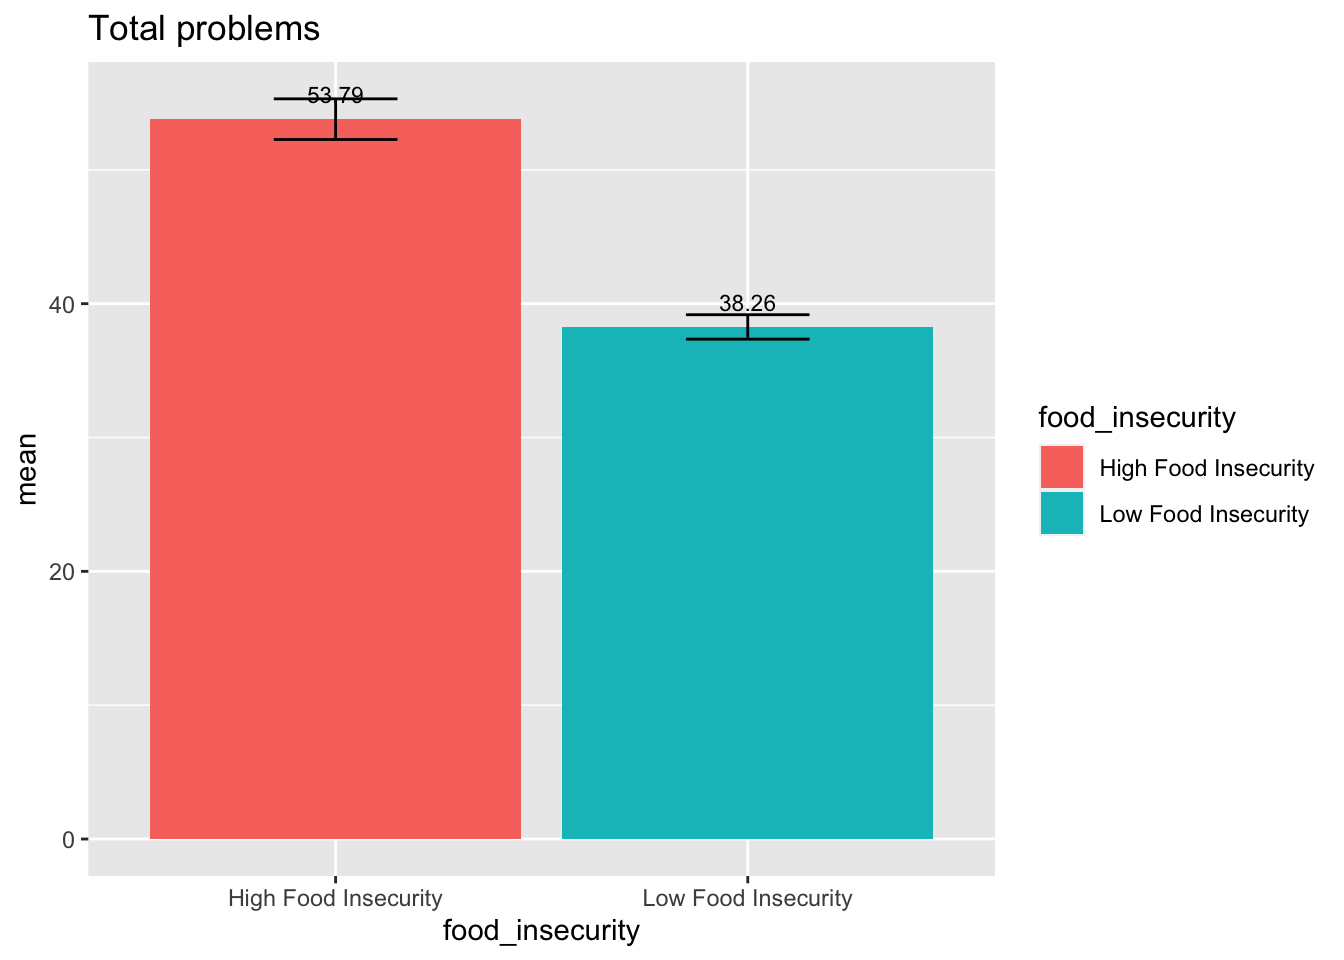
Path c (direct effect): food insecurity -> children’s mental health problems at second subsequent response
- Food insecurity significantly predicted increased total mental health problems among children during the second subsequent response(b = 1.36, p < .001), controlling for the current total mental health problems score (b = .62, p < .001)
##
## Call:
## lm(formula = ctotal_fl2 ~ fi_raw_crt + ctotal_crt, data = fi_pmh_cp)
##
## Residuals:
##     Min      1Q  Median      3Q     Max
## -74.610 -12.763  -3.225  12.237  81.487
##
## Coefficients:
##             Estimate Std. Error t value Pr(>|t|)
## (Intercept) 12.76273    0.49535  25.765   <2e-16 ***
## fi_raw_crt   1.43754    0.15736   9.135   <2e-16 ***
## ctotal_crt   0.61847    0.01104  56.044   <2e-16 ***
## ---
## Signif. codes:  0 '***' 0.001 '**' 0.01 '*' 0.05 '.' 0.1 ' ' 1
##
## Residual standard error: 21.1 on 5272 degrees of freedom
##   (1943 observations deleted due to missingness)
## Multiple R-squared:  0.4076, Adjusted R-squared:  0.4074
## F-statistic:  1814 on 2 and 5272 DF,  p-value: < 2.2e-16
Path a: food insecurity -> caregivers’s mental health problems at first subsequent response
- Food insecurity significantly predicted increased total mental health problems among children during the second subsequent response(b = .79, p < .001), controlling for the current total mental health problems score (b = .76, p < .001)
##
## Call:
## lm(formula = total_fl ~ fi_raw_crt + total_crt, data = fi_pmh_cp)
##
## Residuals:
##     Min      1Q  Median      3Q     Max
## -88.162  -8.929  -0.685   8.789  68.155
##
## Coefficients:
##             Estimate Std. Error t value Pr(>|t|)
## (Intercept) 8.928750   0.415147  21.507  < 2e-16 ***
## fi_raw_crt  0.856062   0.110919   7.718 1.41e-14 ***
## total_crt   0.749527   0.009266  80.887  < 2e-16 ***
## ---
## Signif. codes:  0 '***' 0.001 '**' 0.01 '*' 0.05 '.' 0.1 ' ' 1
##
## Residual standard error: 14.97 on 5226 degrees of freedom
##   (1989 observations deleted due to missingness)
## Multiple R-squared:  0.5918, Adjusted R-squared:  0.5916
## F-statistic:  3788 on 2 and 5226 DF,  p-value: < 2.2e-16
Path b: caregivers’ mental health problems at first subsequent response -> children’s mental health problems at second subsequent response
- Caregivers’ mental health problems at the first subsequent response significantly predicted increased total mental health problems among children during the second subsequent response(b = .15, p < .001), controlling for children’s total mental health problems score at the first subsequent response (b = .62, p < .001) and current food insecurity (path c’: b = .90, p < .001)
##
## Call:
## lm(formula = ctotal_fl2 ~ total_fl + ctotal_fl + fi_raw_crt,
##     data = fi_pmh_cp)
##
## Residuals:
##     Min      1Q  Median      3Q     Max
## -75.922 -11.983  -1.857  12.417  86.103
##
## Coefficients:
##             Estimate Std. Error t value Pr(>|t|)
## (Intercept)  7.65488    0.63321   12.09  < 2e-16 ***
## total_fl     0.15770    0.01469   10.74  < 2e-16 ***
## ctotal_fl    0.59725    0.01239   48.21  < 2e-16 ***
## fi_raw_crt   0.97279    0.16743    5.81 6.68e-09 ***
## ---
## Signif. codes:  0 '***' 0.001 '**' 0.01 '*' 0.05 '.' 0.1 ' ' 1
##
## Residual standard error: 20.27 on 4495 degrees of freedom
##   (2719 observations deleted due to missingness)
## Multiple R-squared:  0.4593, Adjusted R-squared:  0.4589
## F-statistic:  1273 on 3 and 4495 DF,  p-value: < 2.2e-16
Testing Indirect Effect using RMediation Method
- Indirect effect was statistically significant: a*b = .121, 95%CI[.08, .16], p <.001
## $`97.5% CI`
## [1] 0.08282282 0.16242593
##
## $Estimate
## [1] 0.1205091
##
## $SE
## [1] 0.02032857