0. Sample Disclaimer
- This set of analyses on material hardship is based on responses collected from 5,336 caregivers between the dates of April 6th 2020 and April 2nd 2021. These caregivers represent a range of voices: 6.55% are non-Latinx Black/African American, 14.59% are Latinx, and 27.91% live at or below 1.5 times the federal poverty line. Only data from follow-up surveys were included in the analyses. Proportions/percentages are calculated based on the item-level response rates, not out of the total sample size. The data for these analyses are not weighted.
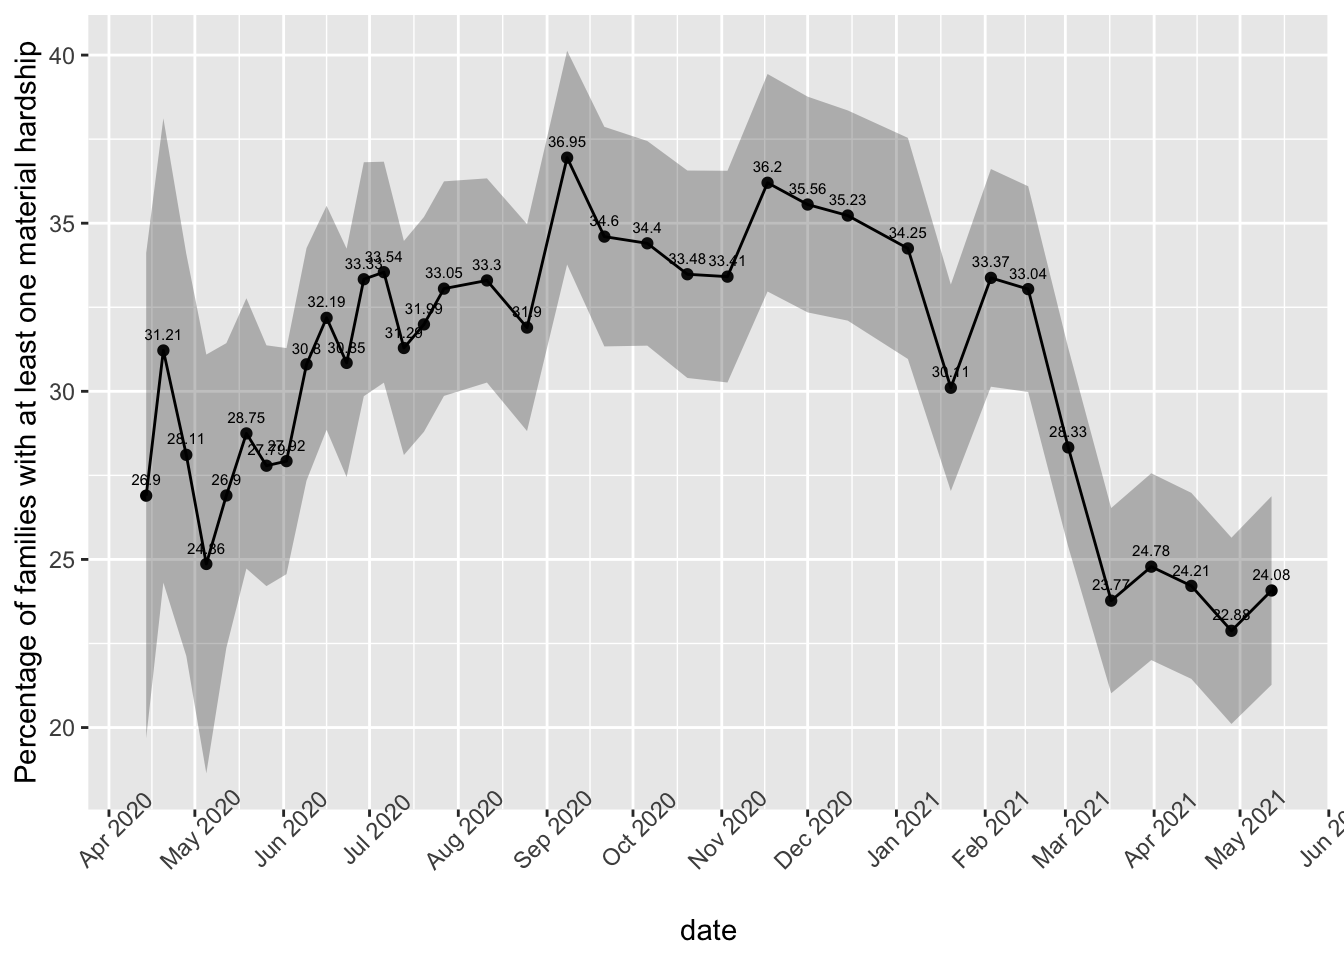
1 Percentage of Families Reporting 1+ Material Hardship
1.1 Overall
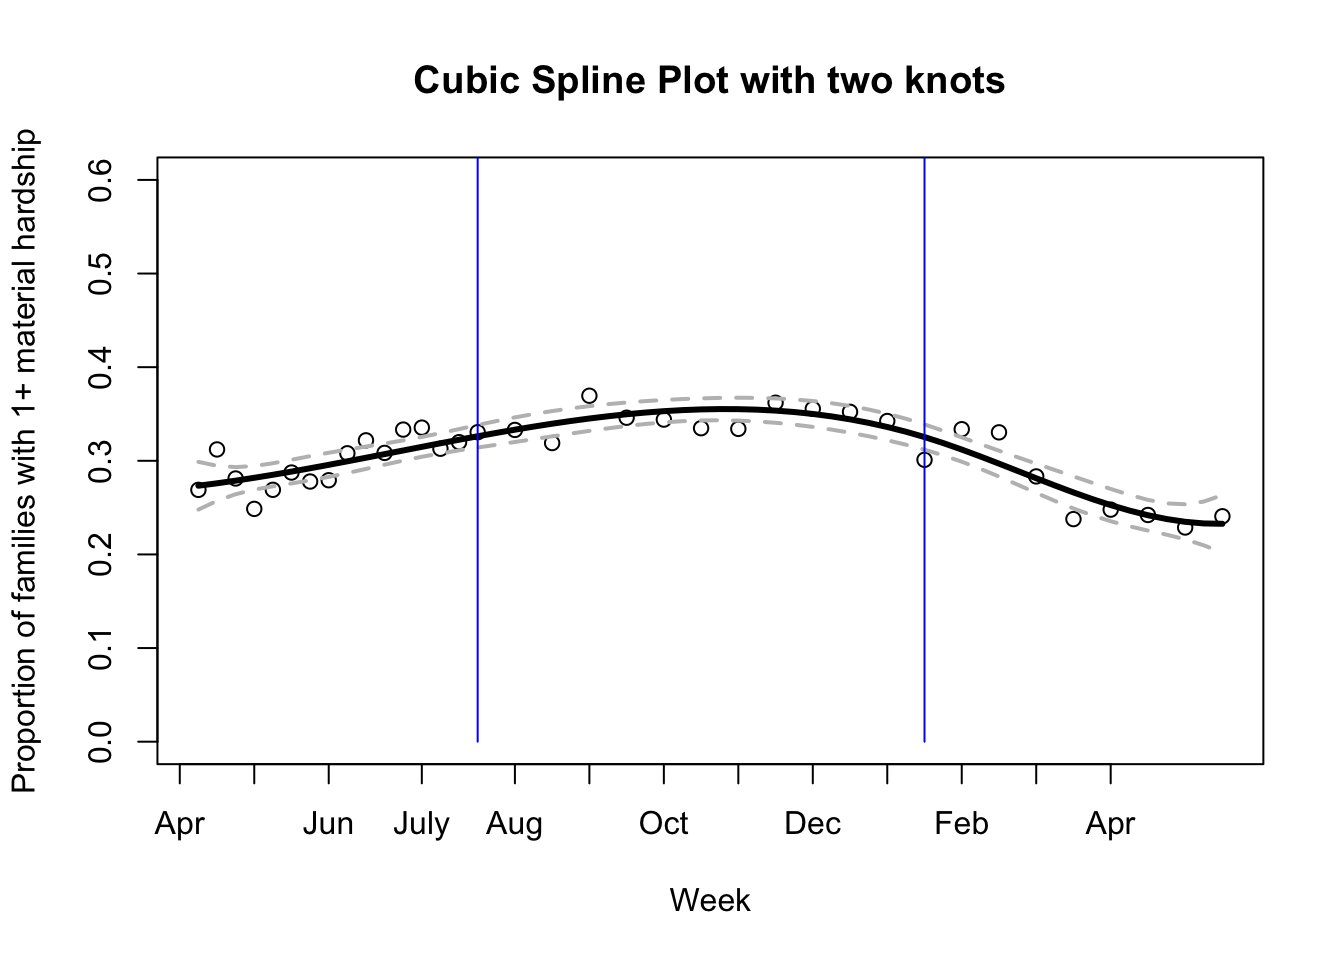
1.1.1 Overall spline model
- Fit cubic spline models with 2 spline at weeks 17 & 41
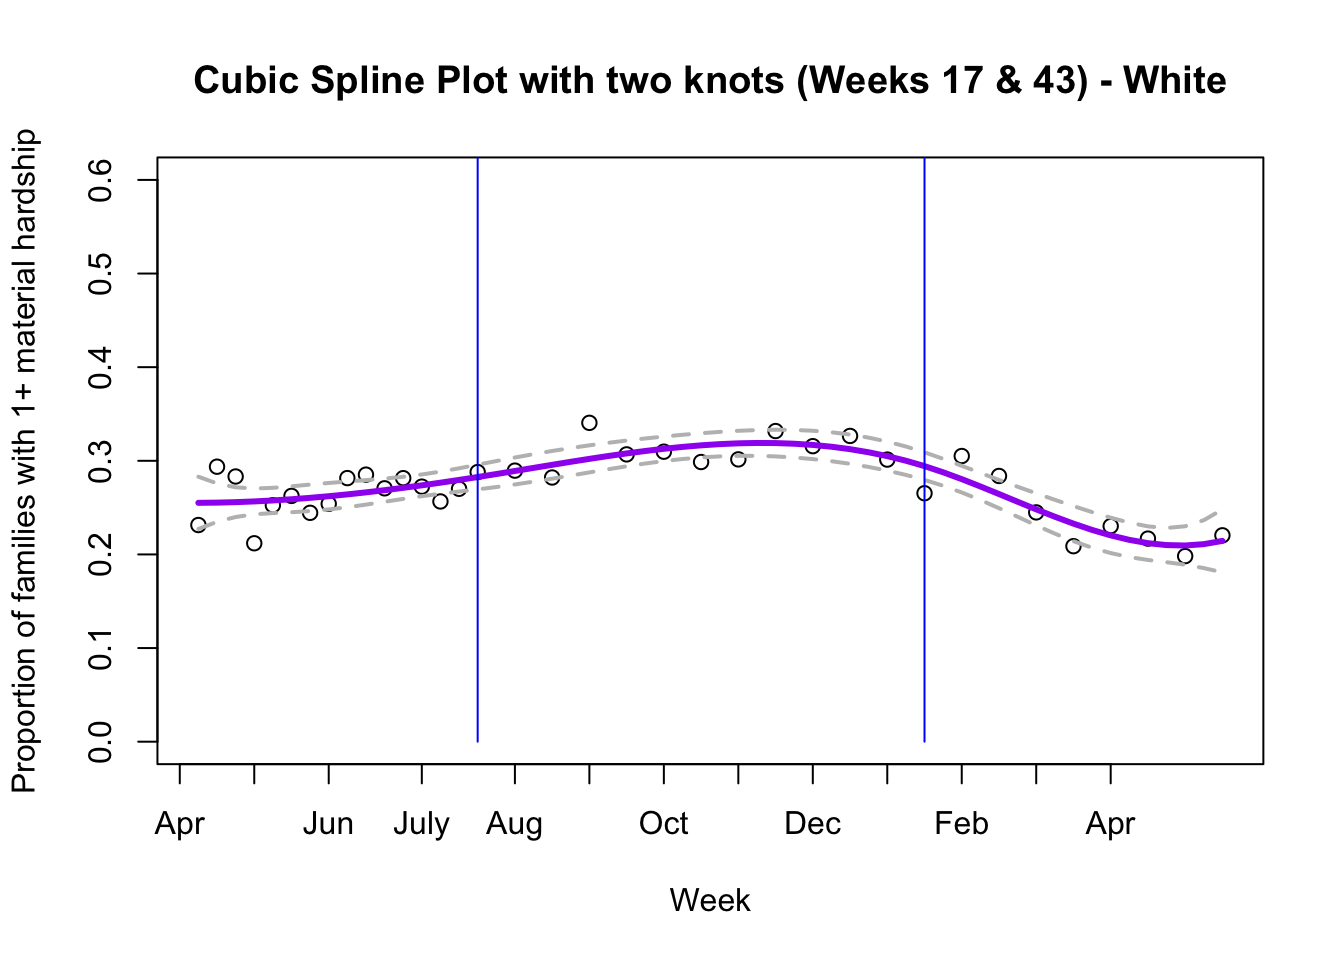
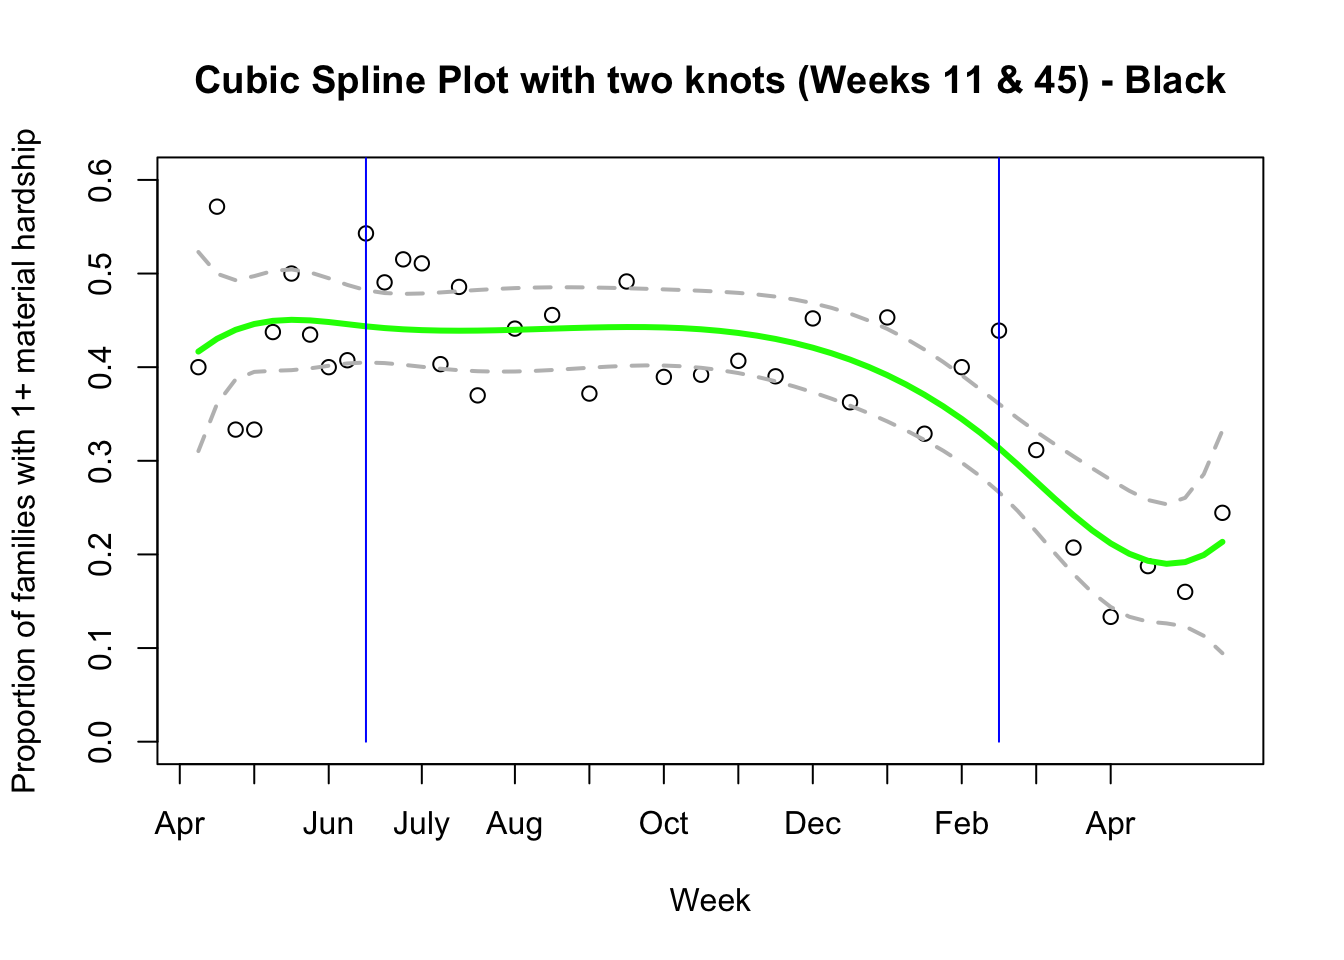
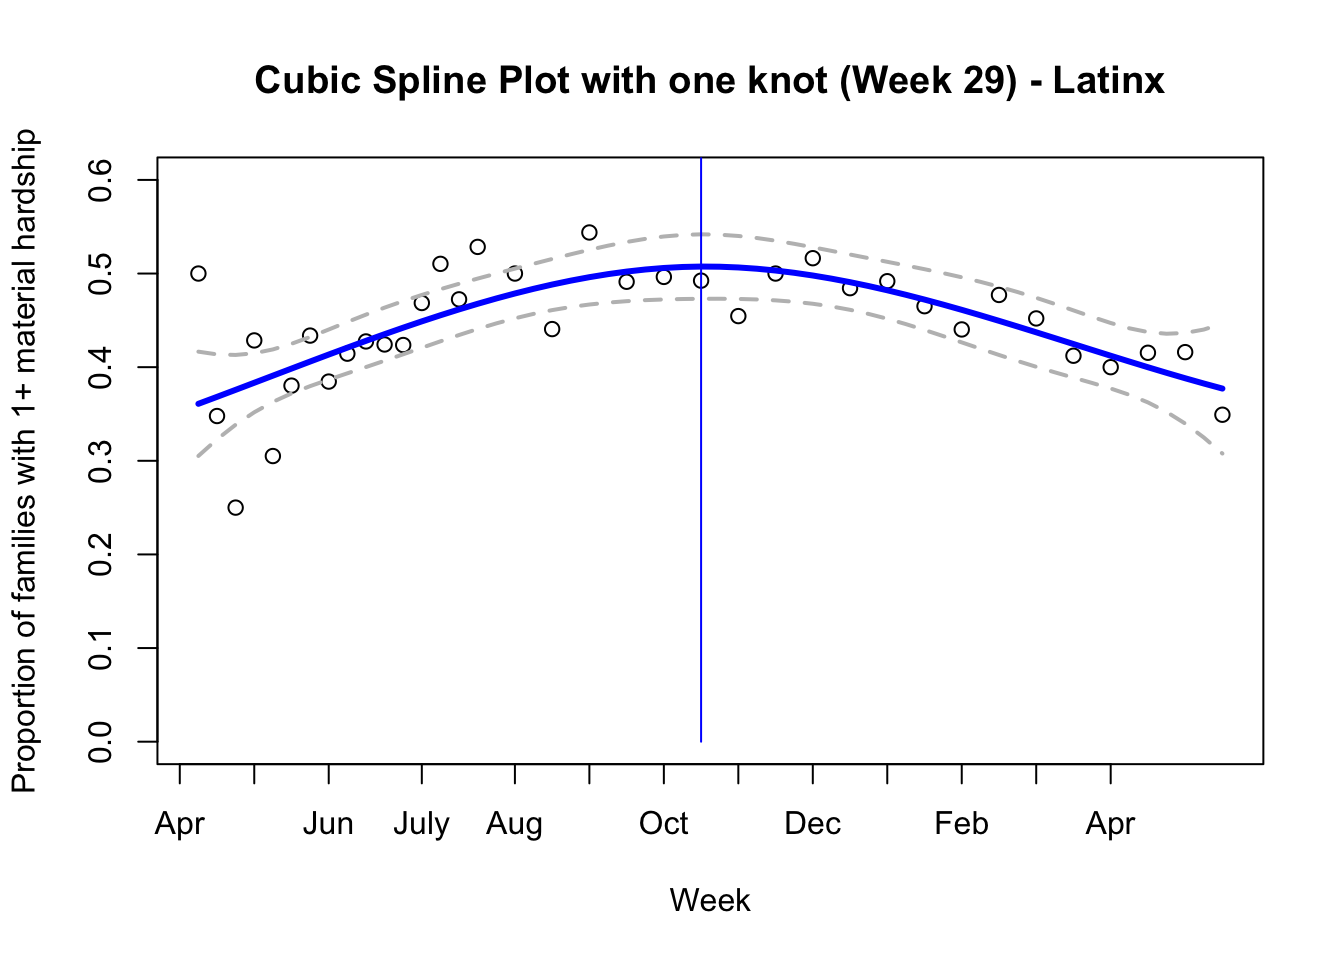
1.2 By race/ethnicity (with overall trend in same scale)
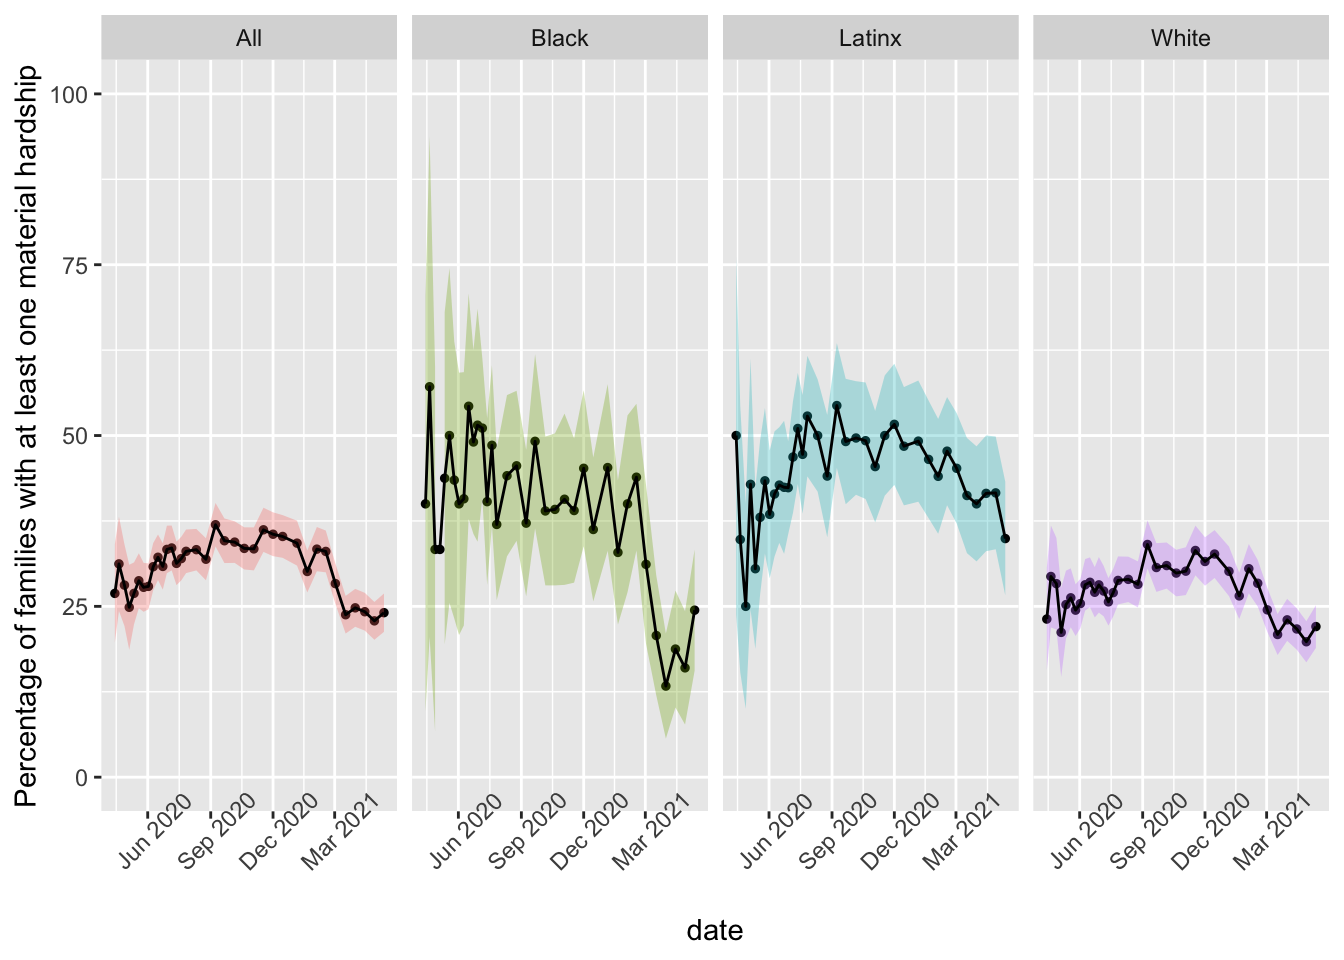
1.2.2 Spline models by race/ethnicity groups
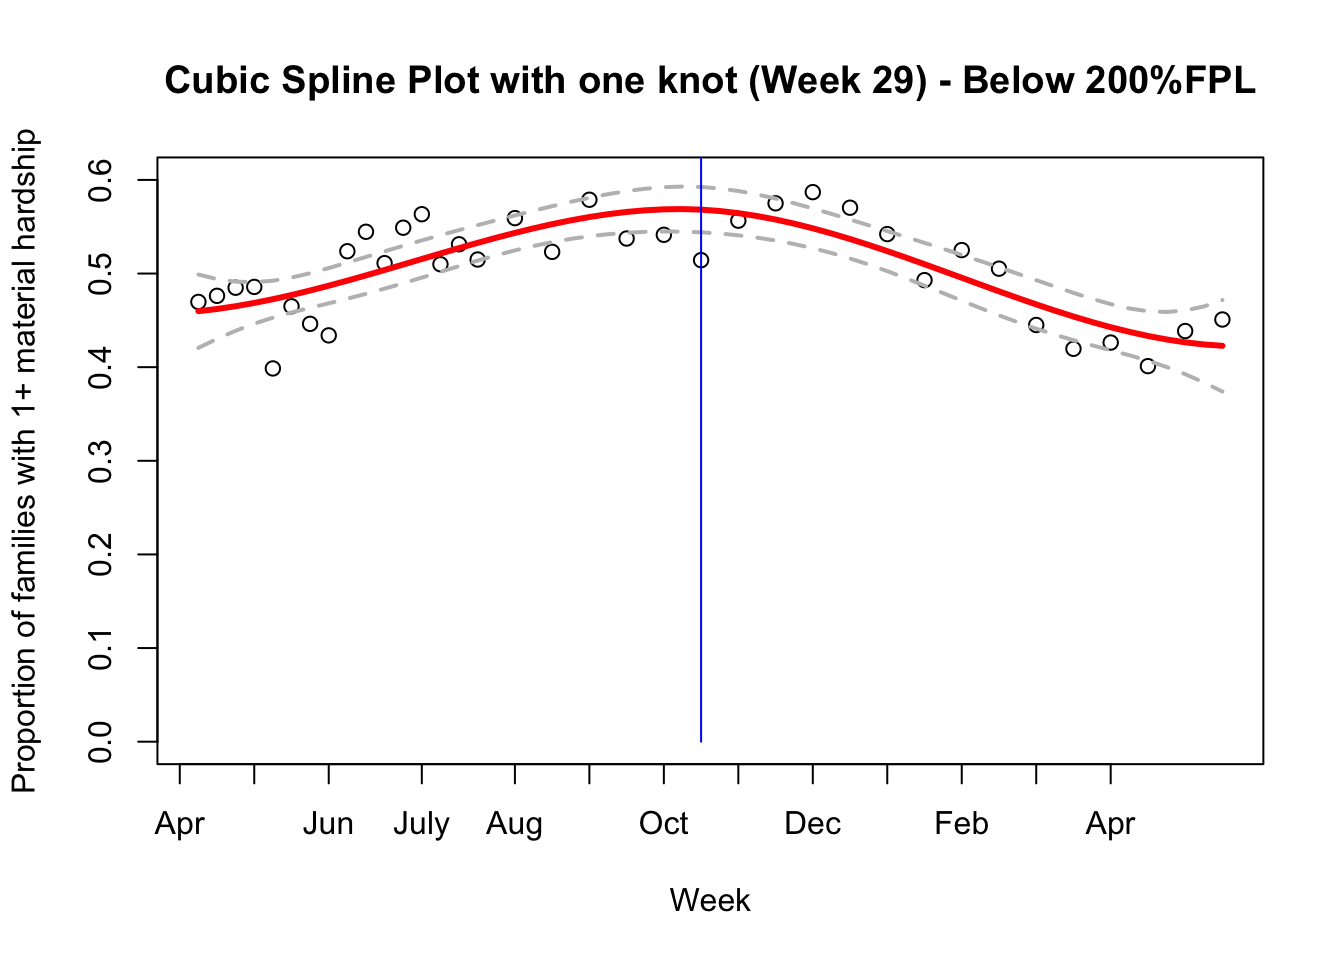
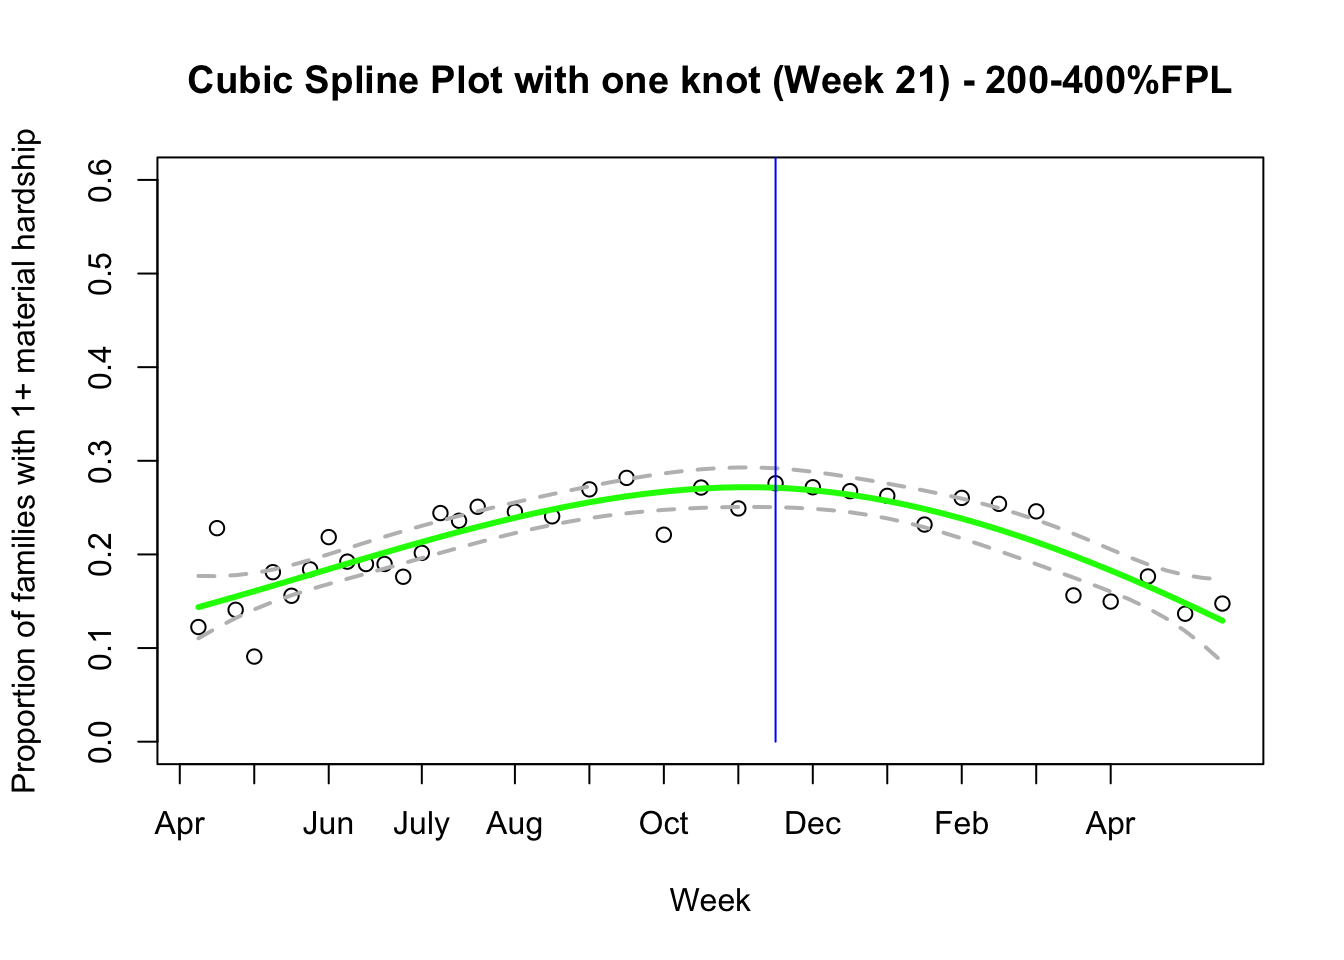
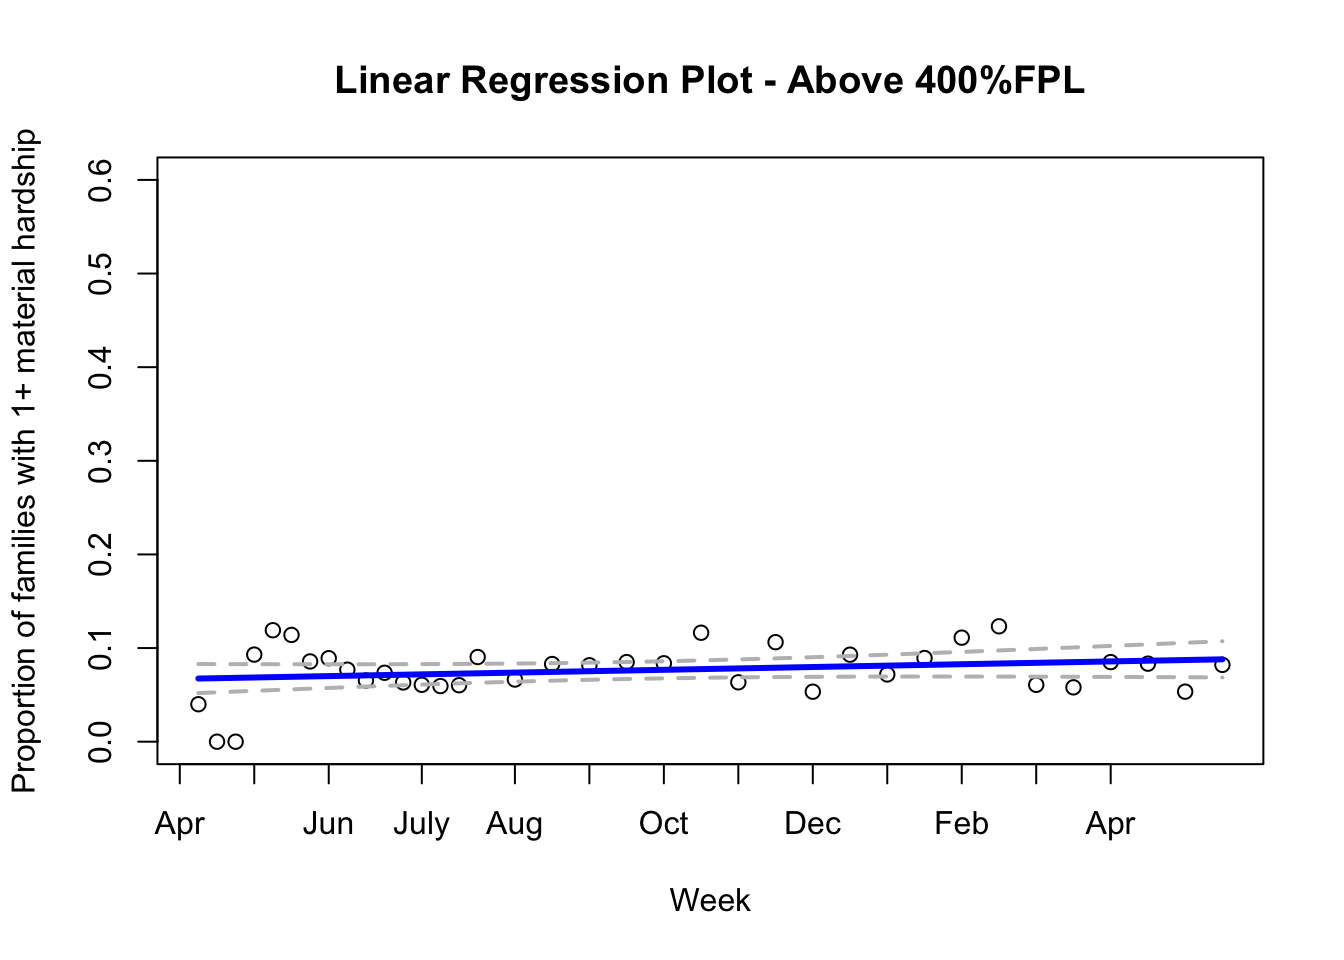
1.3 By poverty level
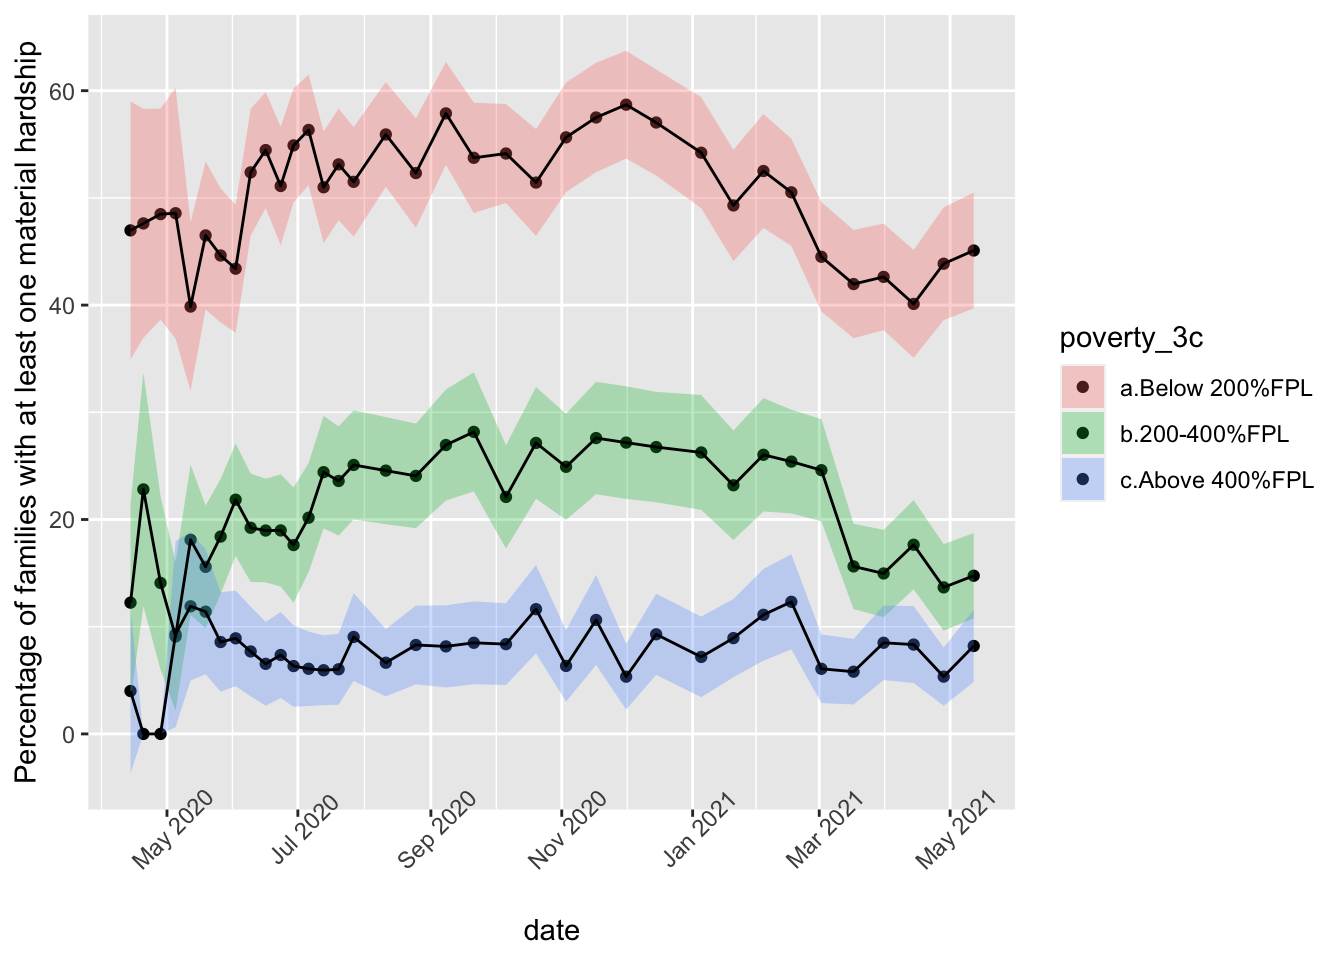
1.3.1 Spline models by poverty groups
- Note that the smoothing spline model suggests a linear trend of the above 400%FPL group
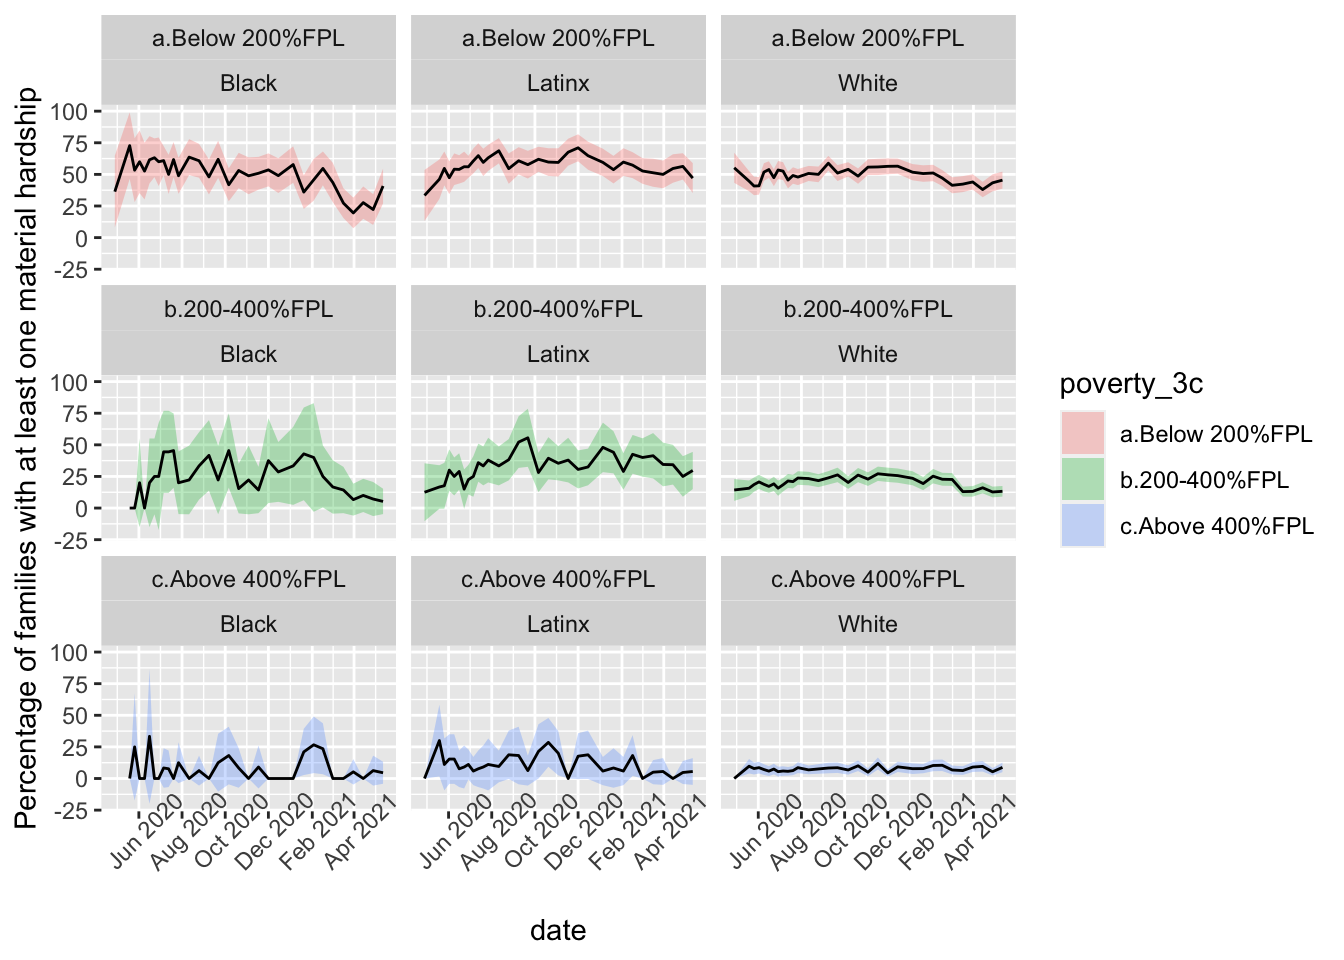
1.4 By poverty level & race/ethnicity
- Note that there were very few Black families in the above 400%FPL category, so some weeks had no data points (presented as 0% in the figure)
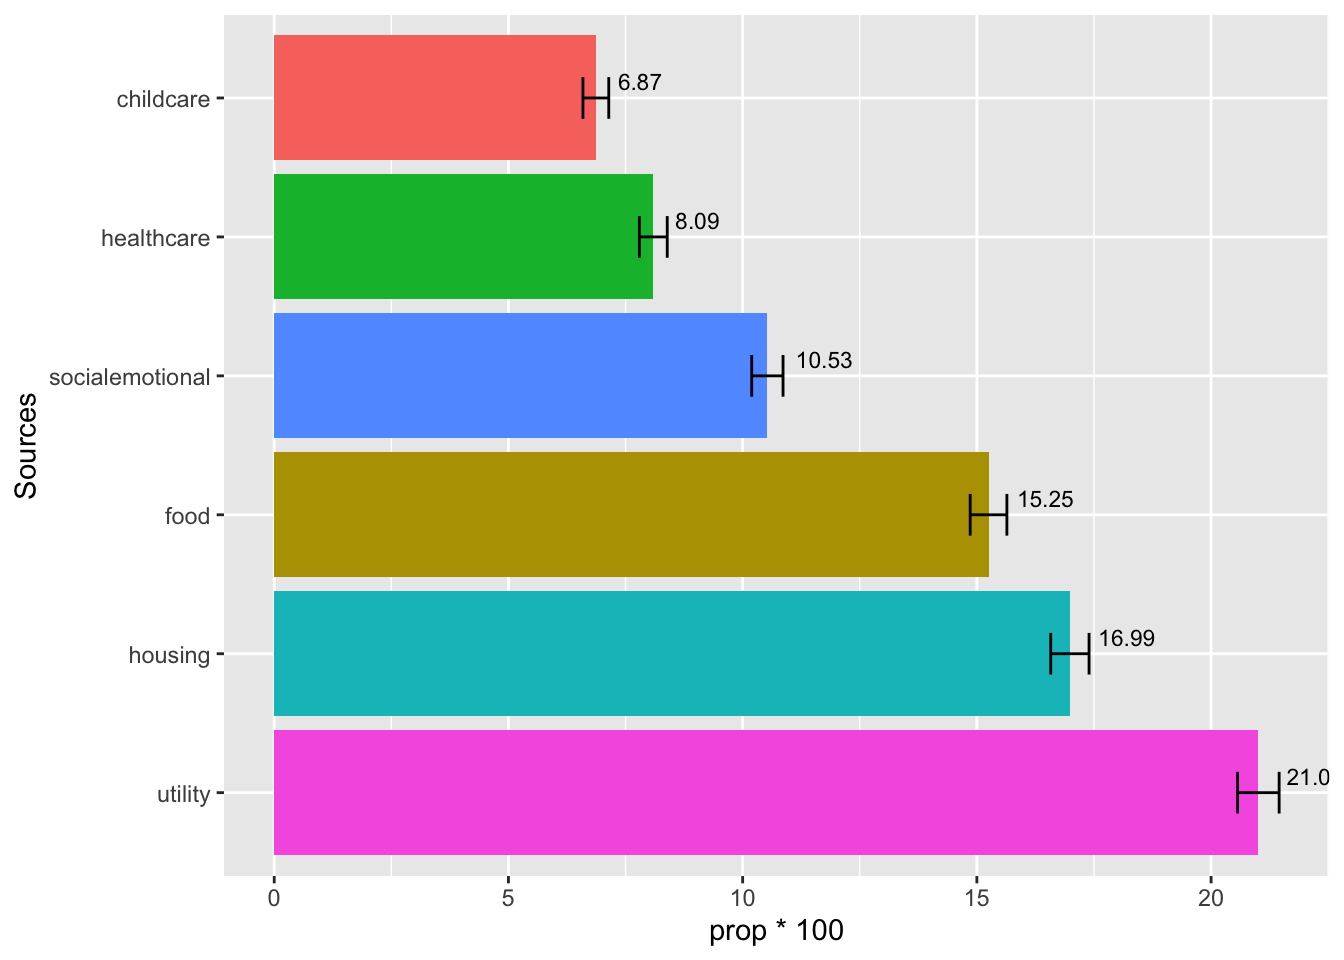
2. Sources of Hardship
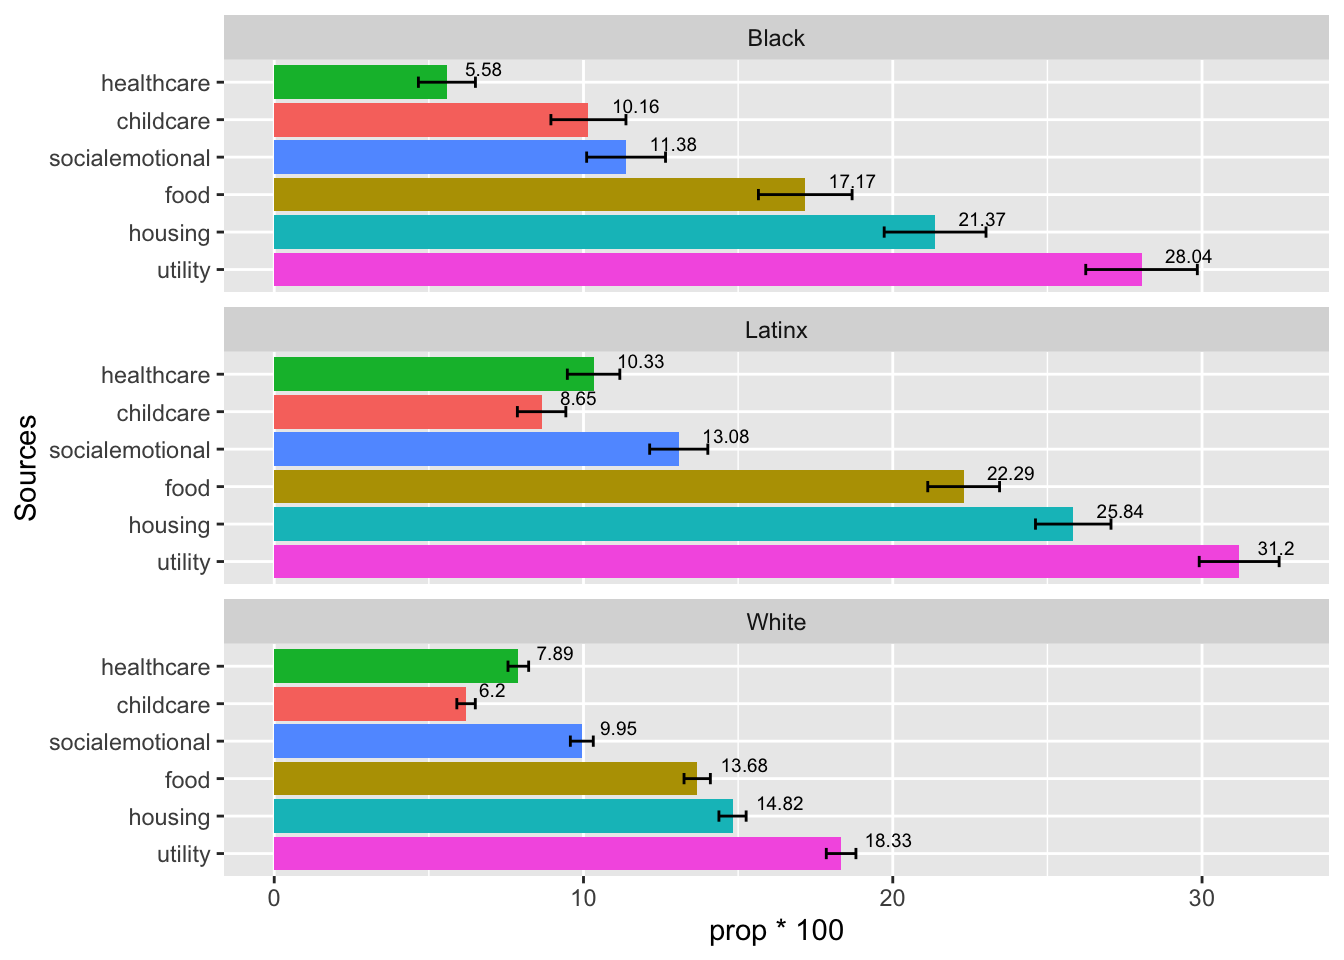
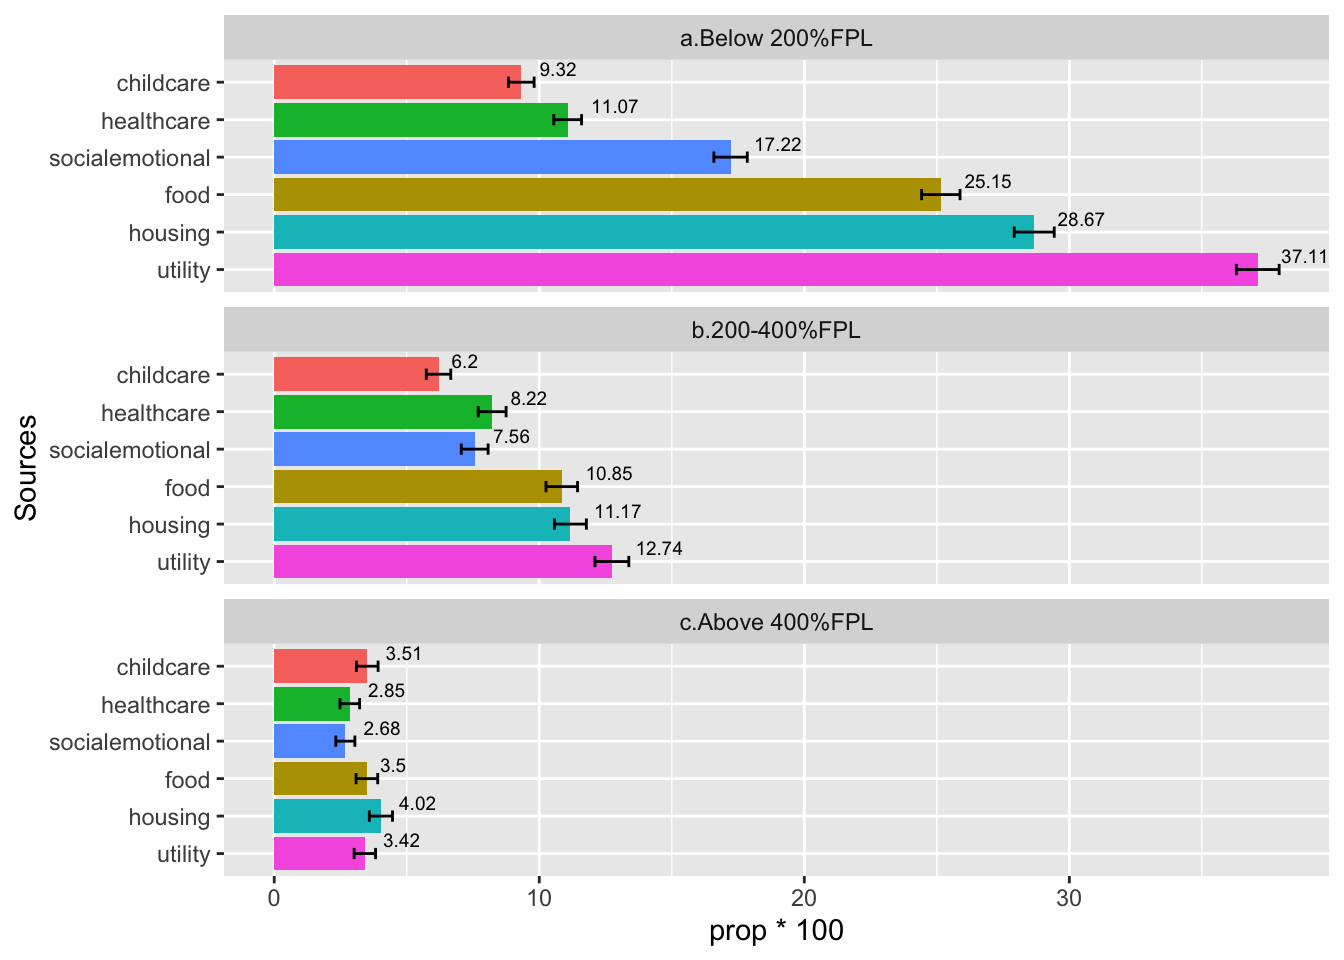
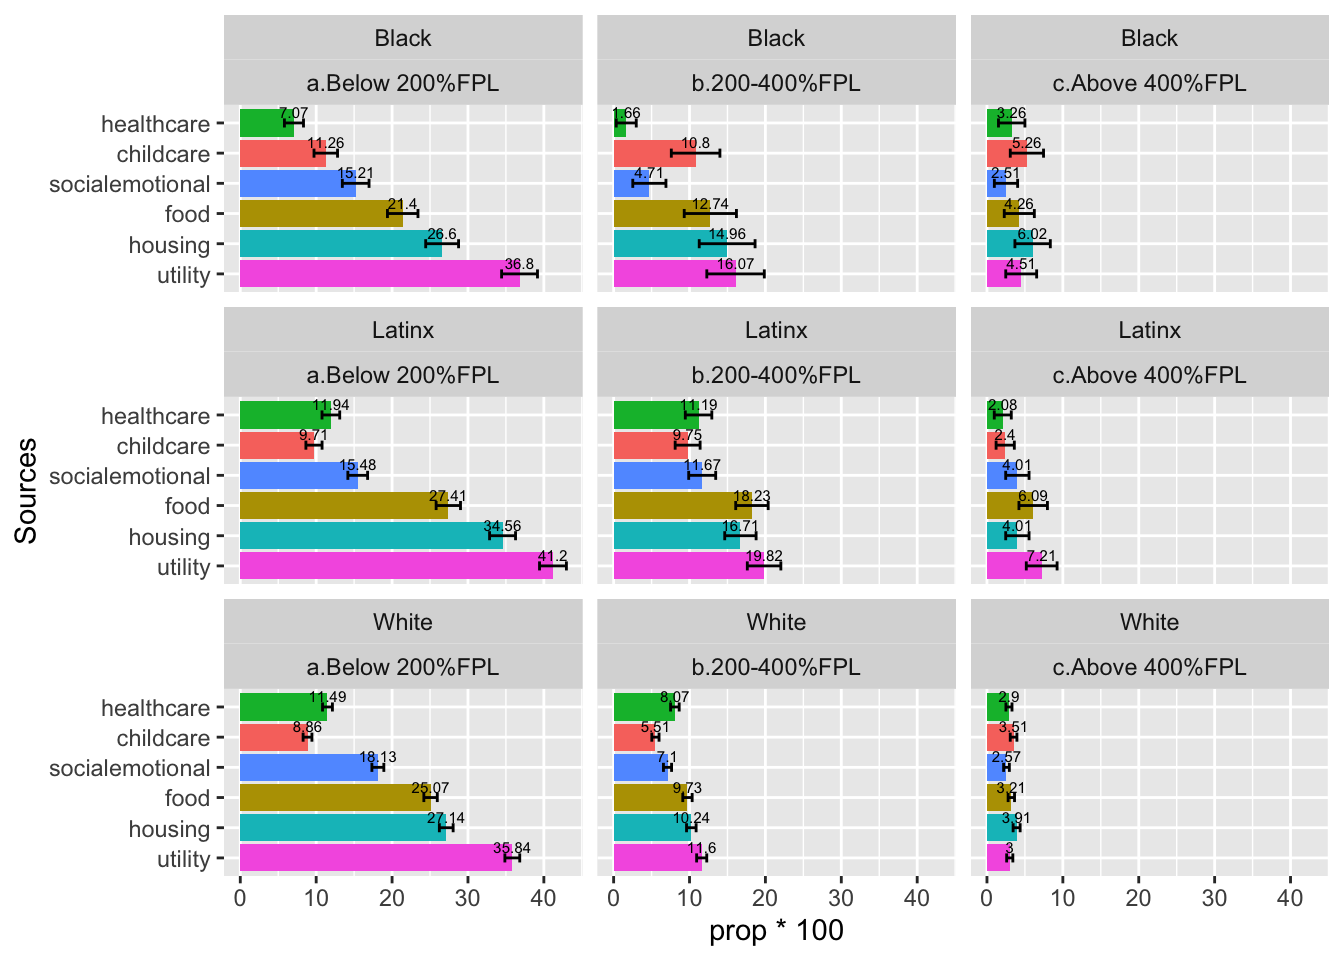
2.1 Most recent responses
2.1.1 By race/ethnicity
2.1.2 By poverty level
2.1.3 By race/ethnicity & poverty level
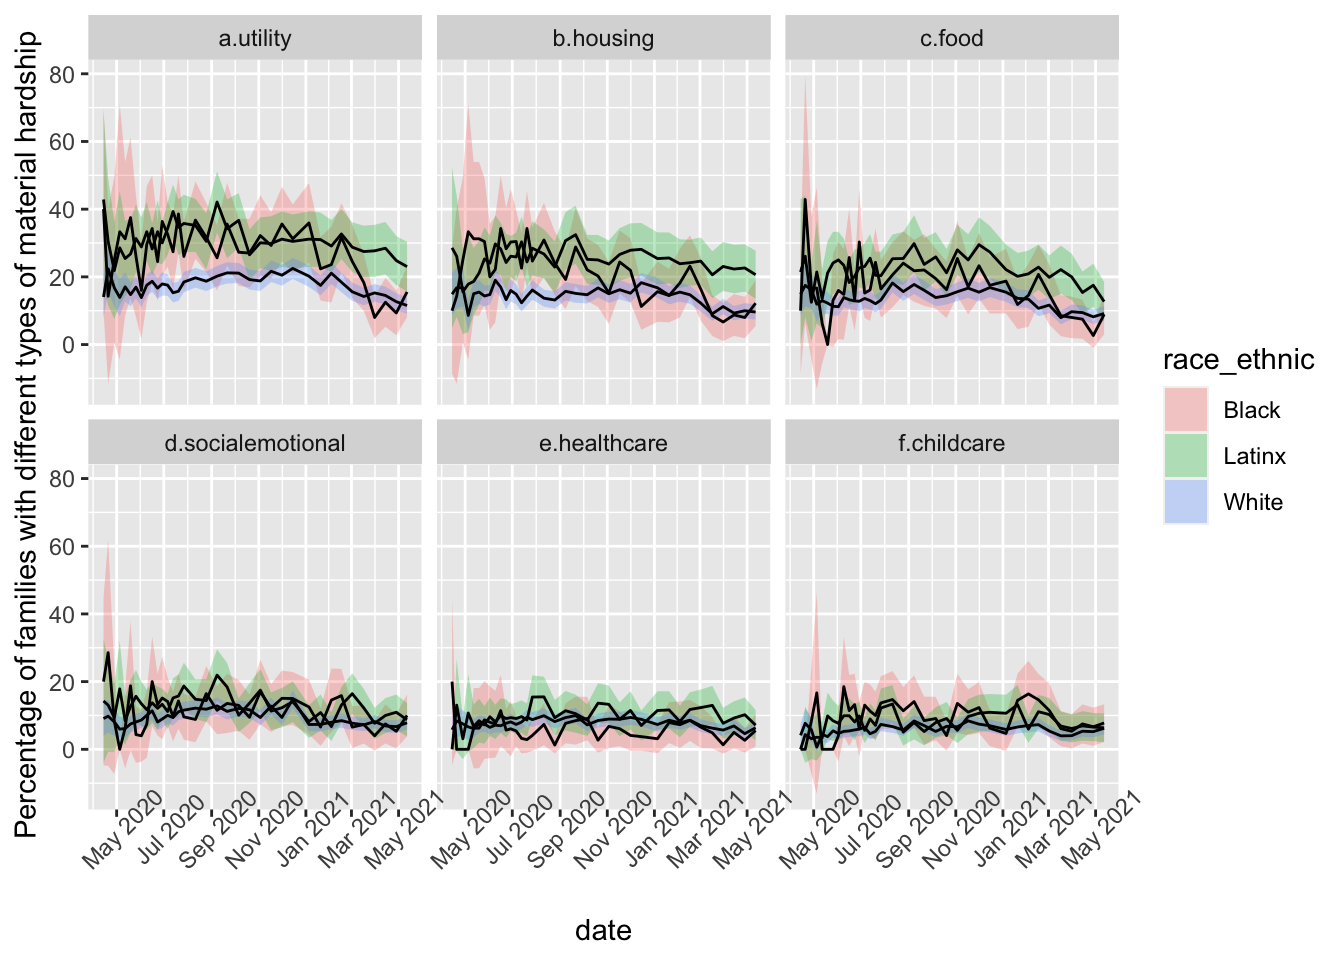
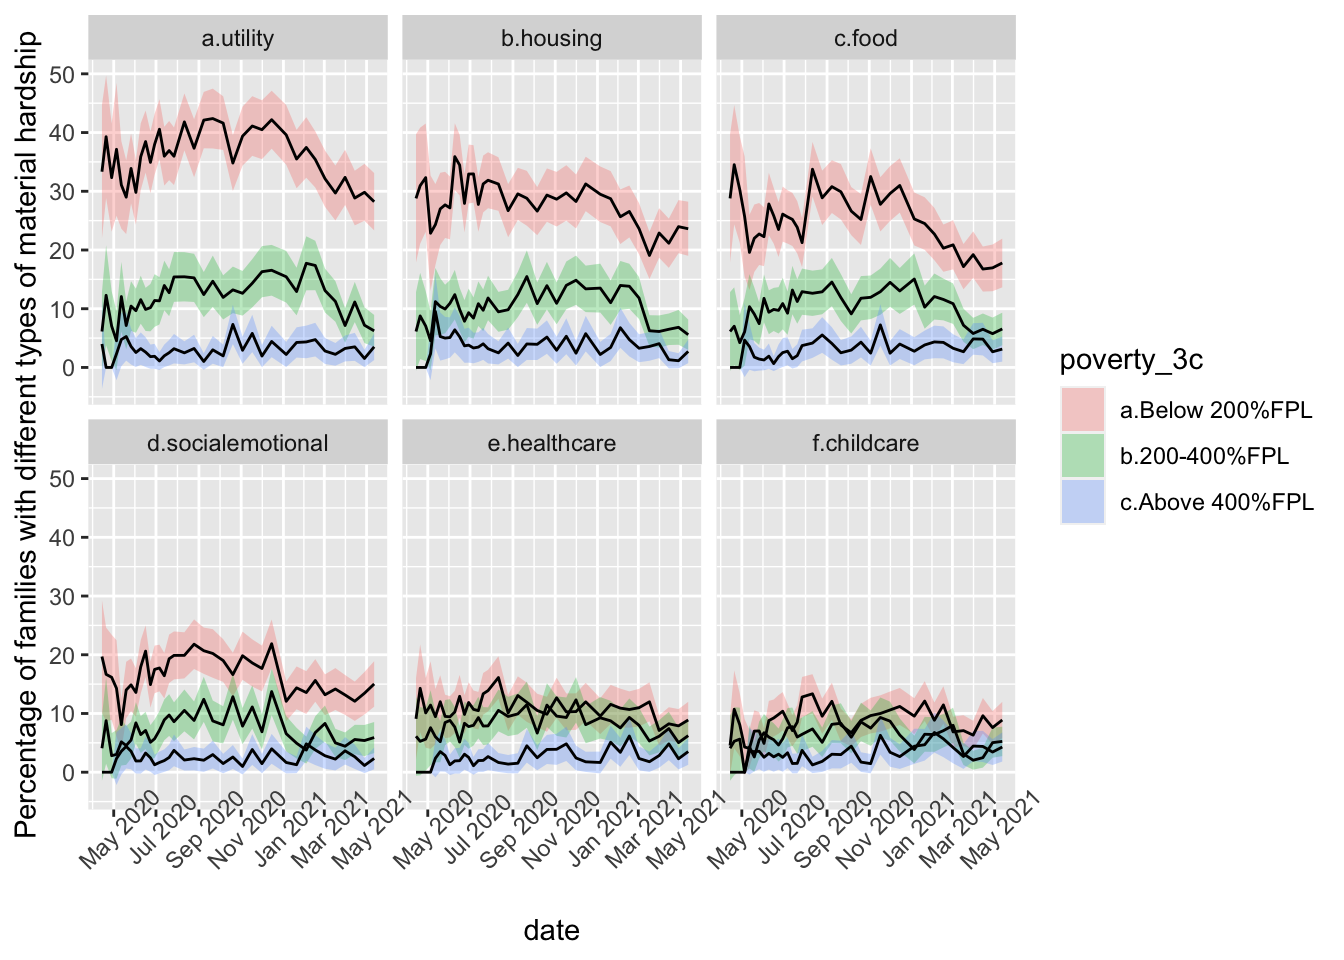
2.2 Trend of Source for Hardship
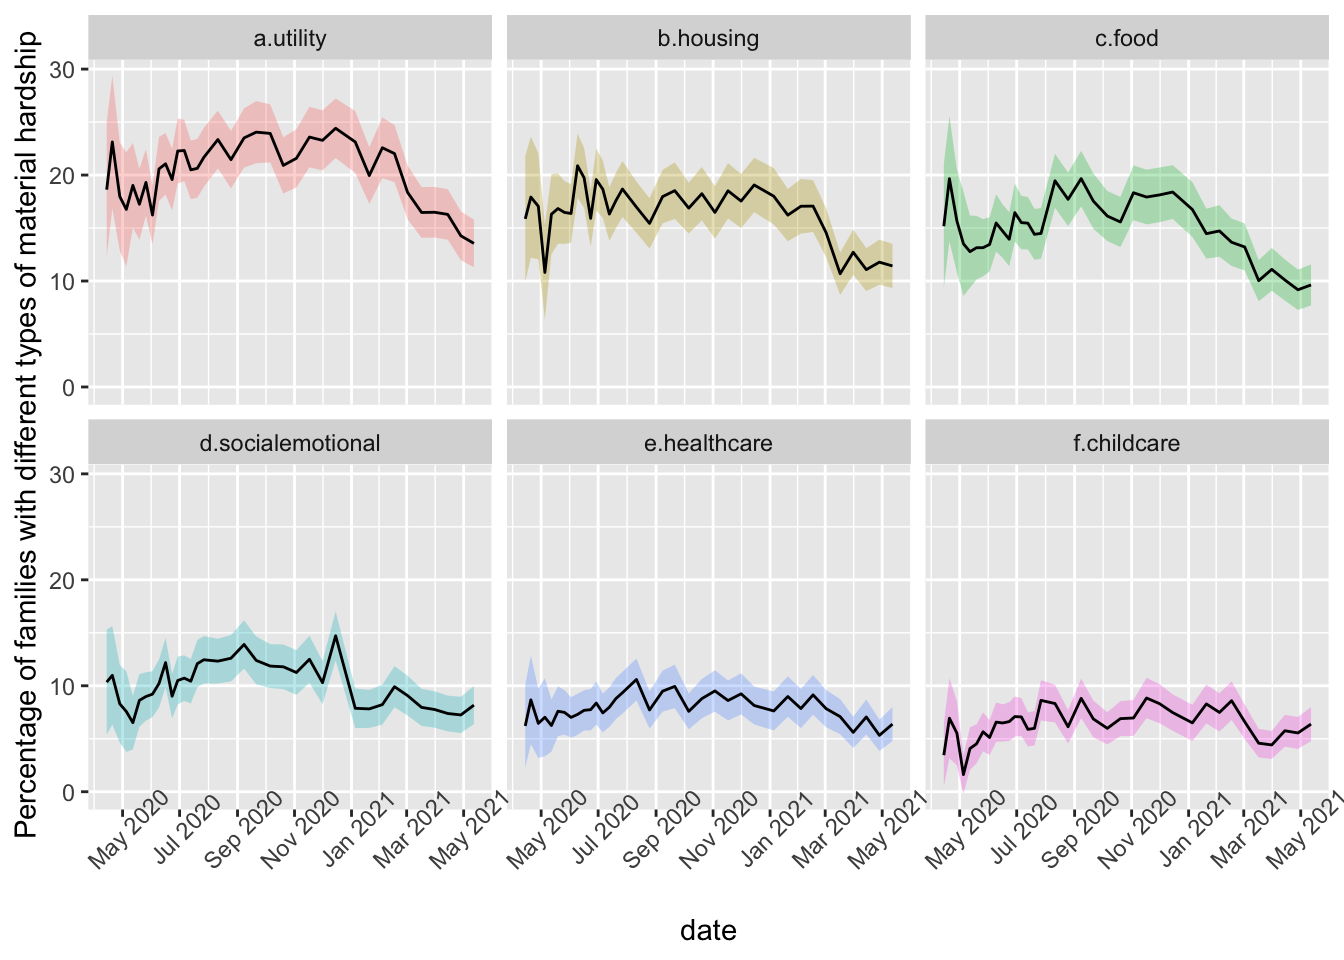
2.2.1 By race/ethnicity
2.2.2 By poverty level
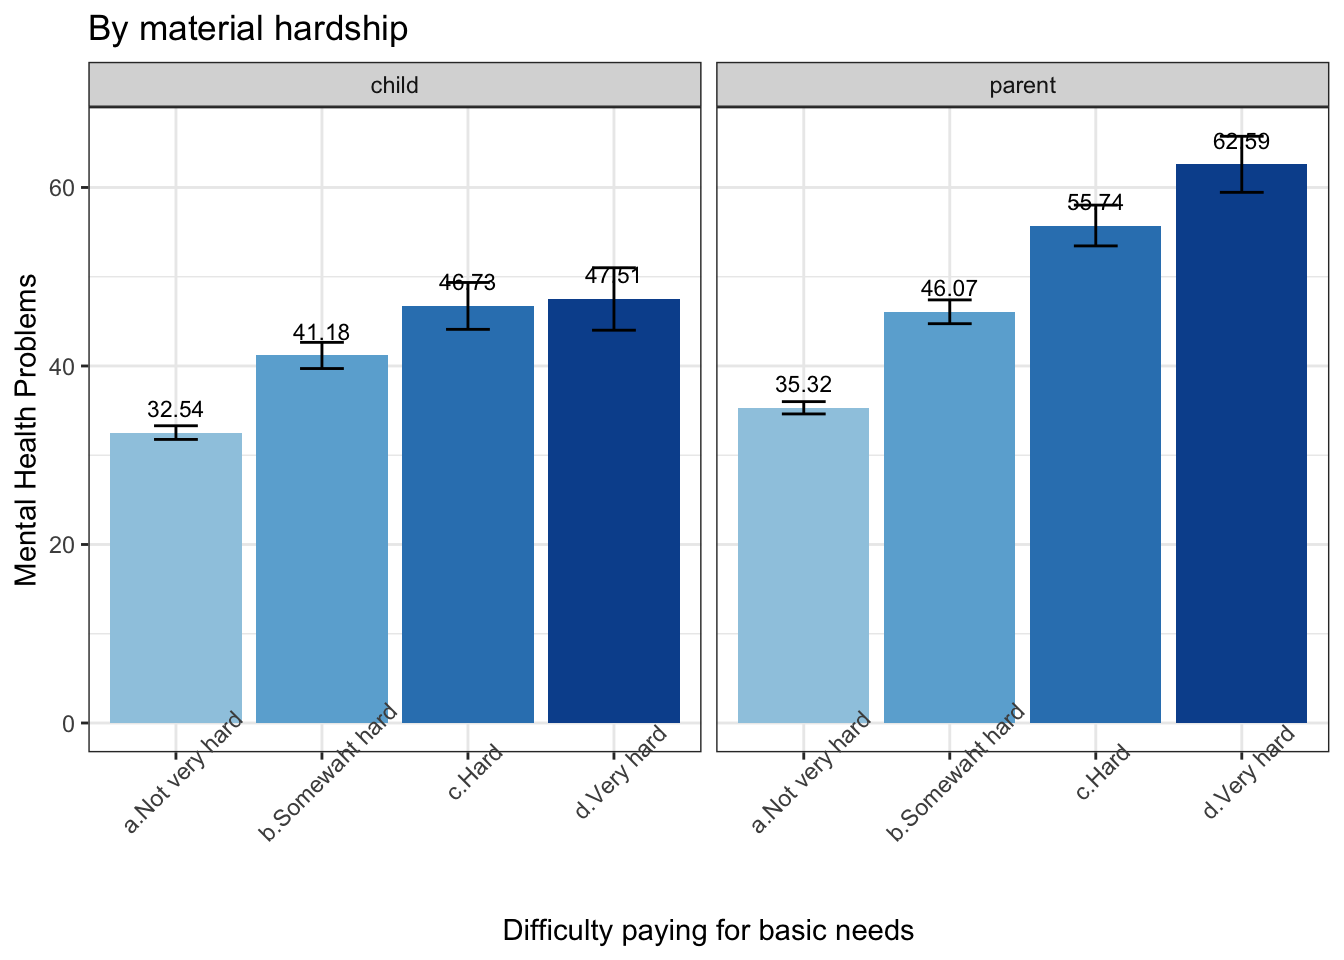
3. Associations with Mental Health
3.1 By material hardship - Overall difficulty
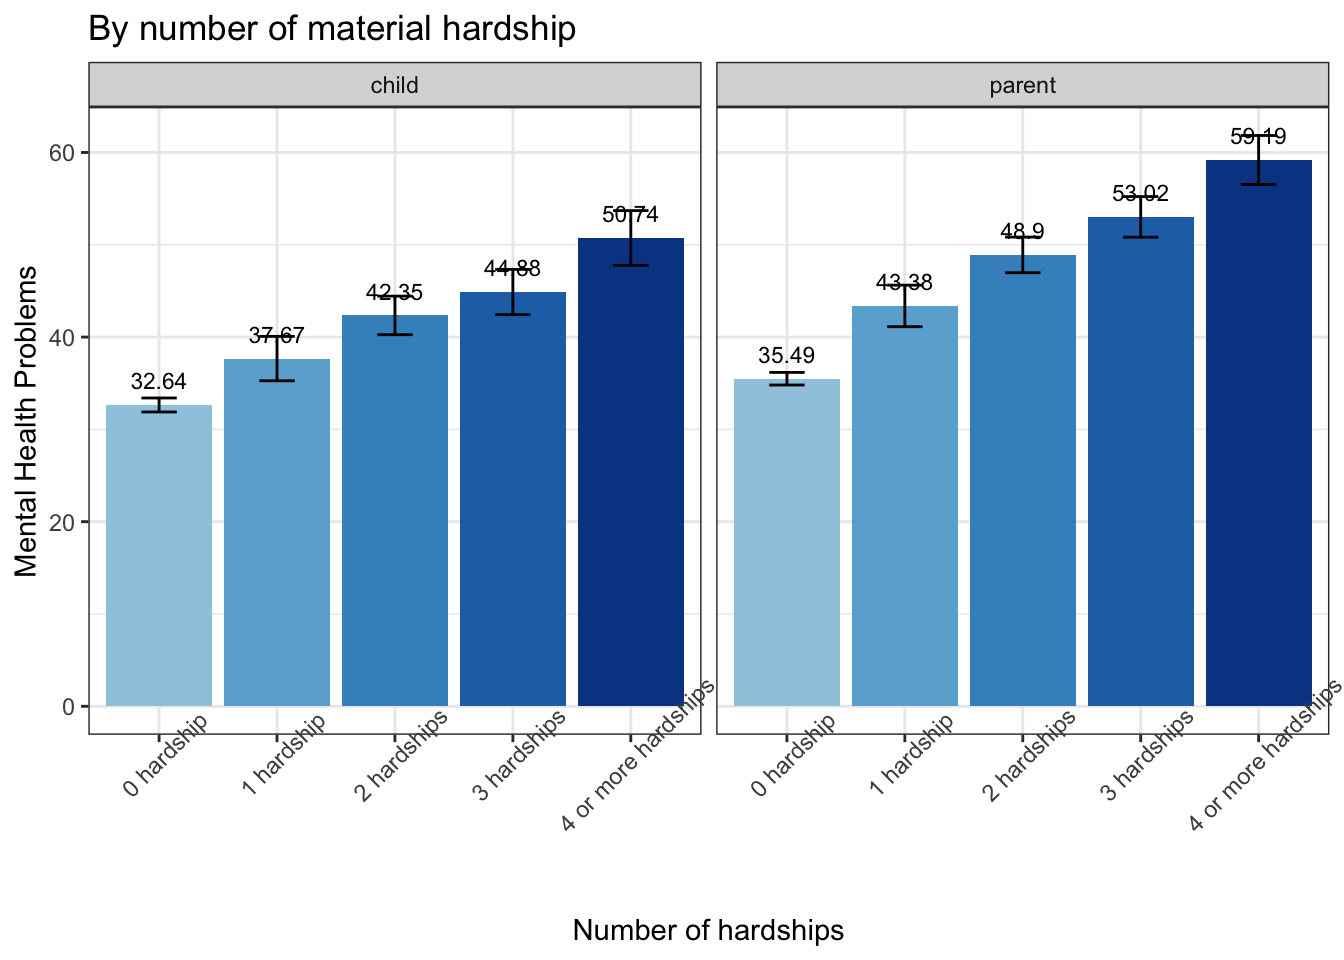
3.2 By Number of hardship
4. Changes of material hardship since Feb 3rd 2021
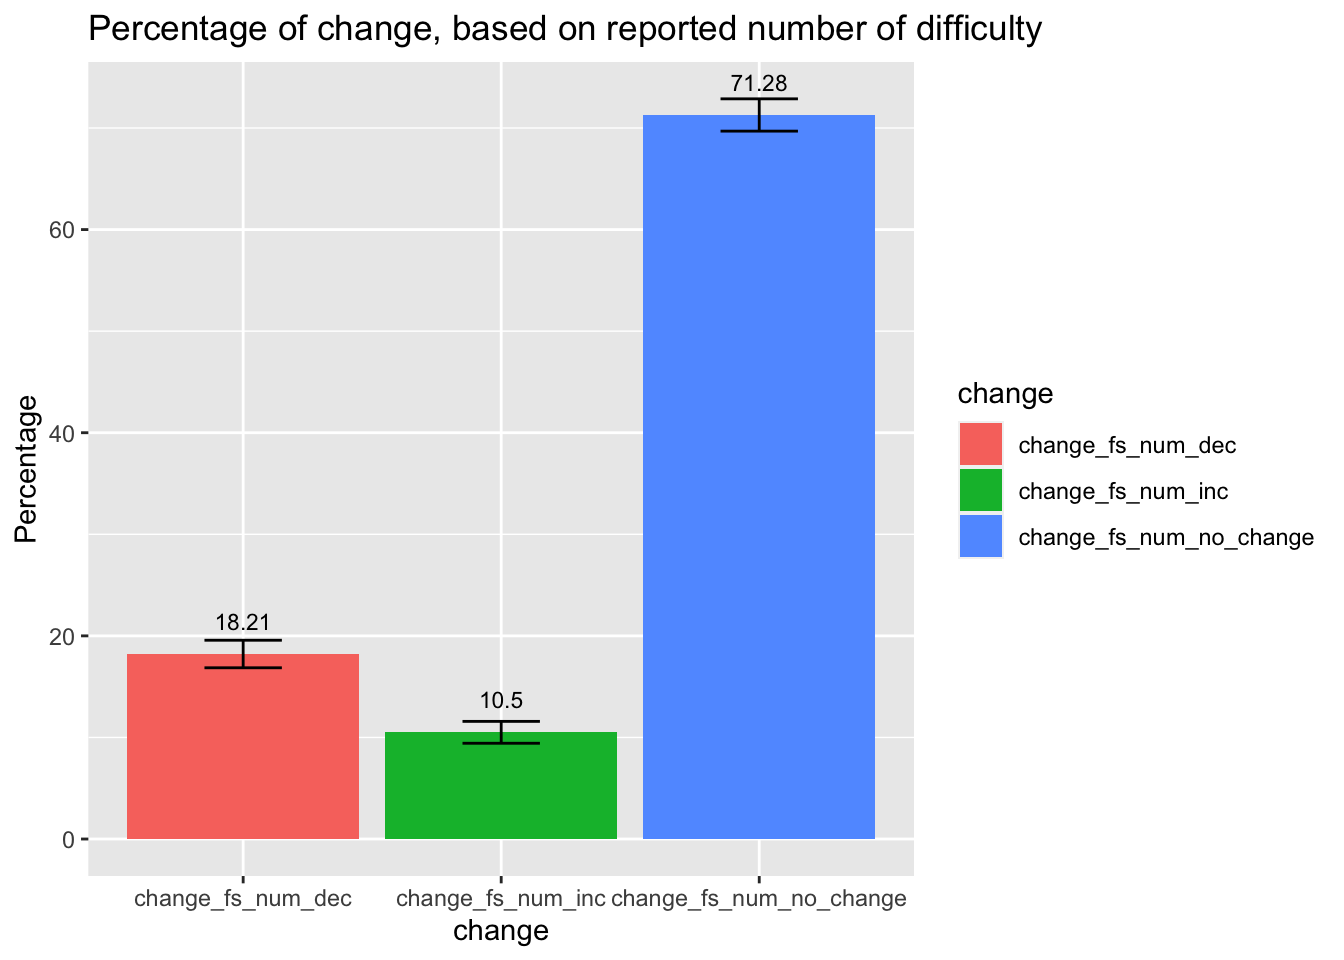
4.1 Percentage of families who showed changes in material hardship after Feb 16th 2021
- For this set of analyses, data were divided into two subsets - collected before Feb. 3rd 2021, and collected after Feb 3rd 2021. For each family, the change in the number of reported material hardship was calculated, and the percentages of families with increased/decreased/no change in number of hardships are presented below.
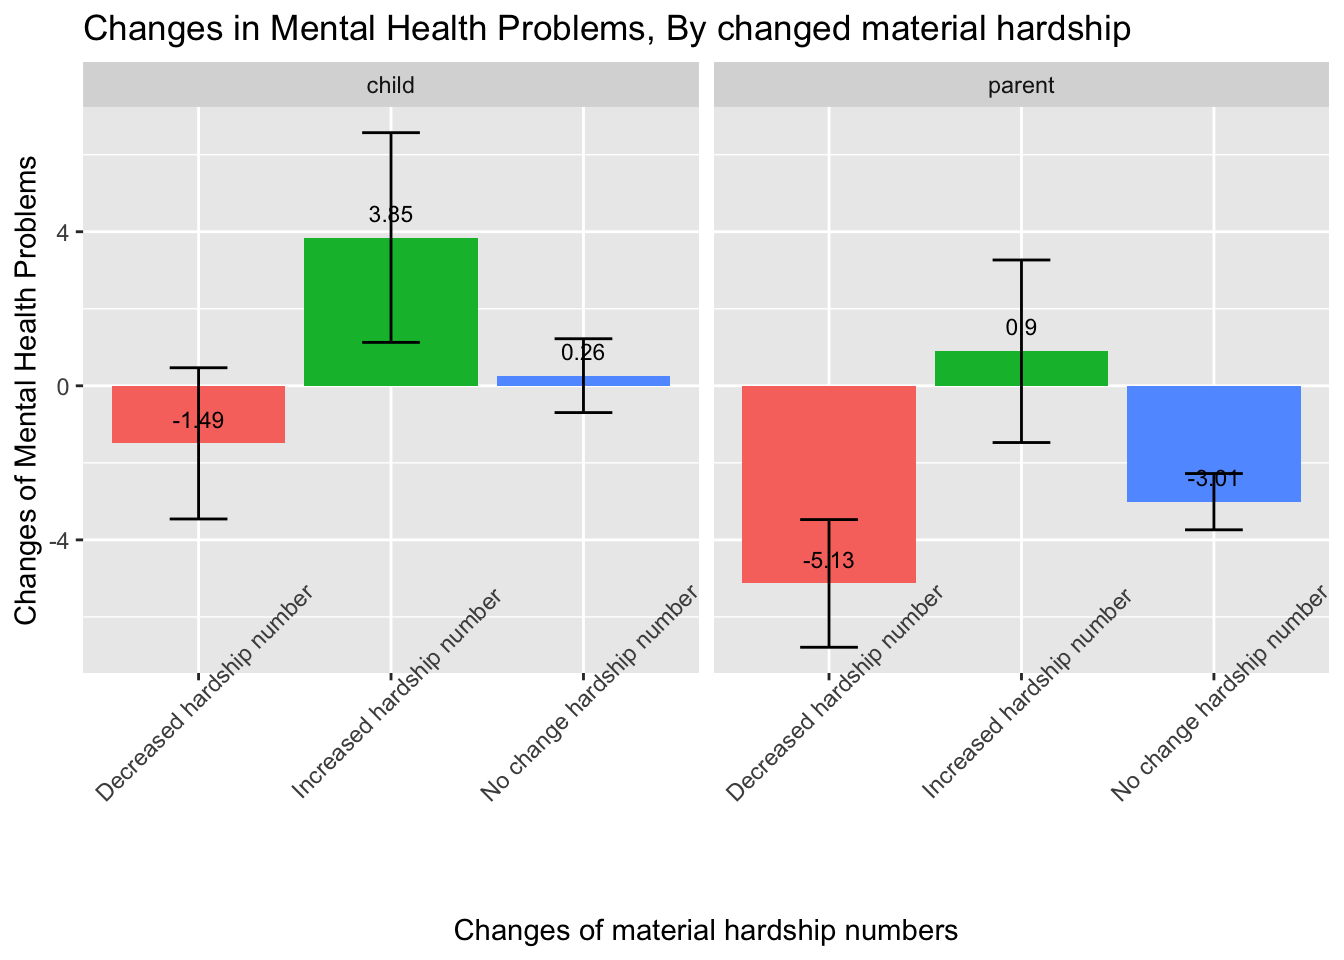
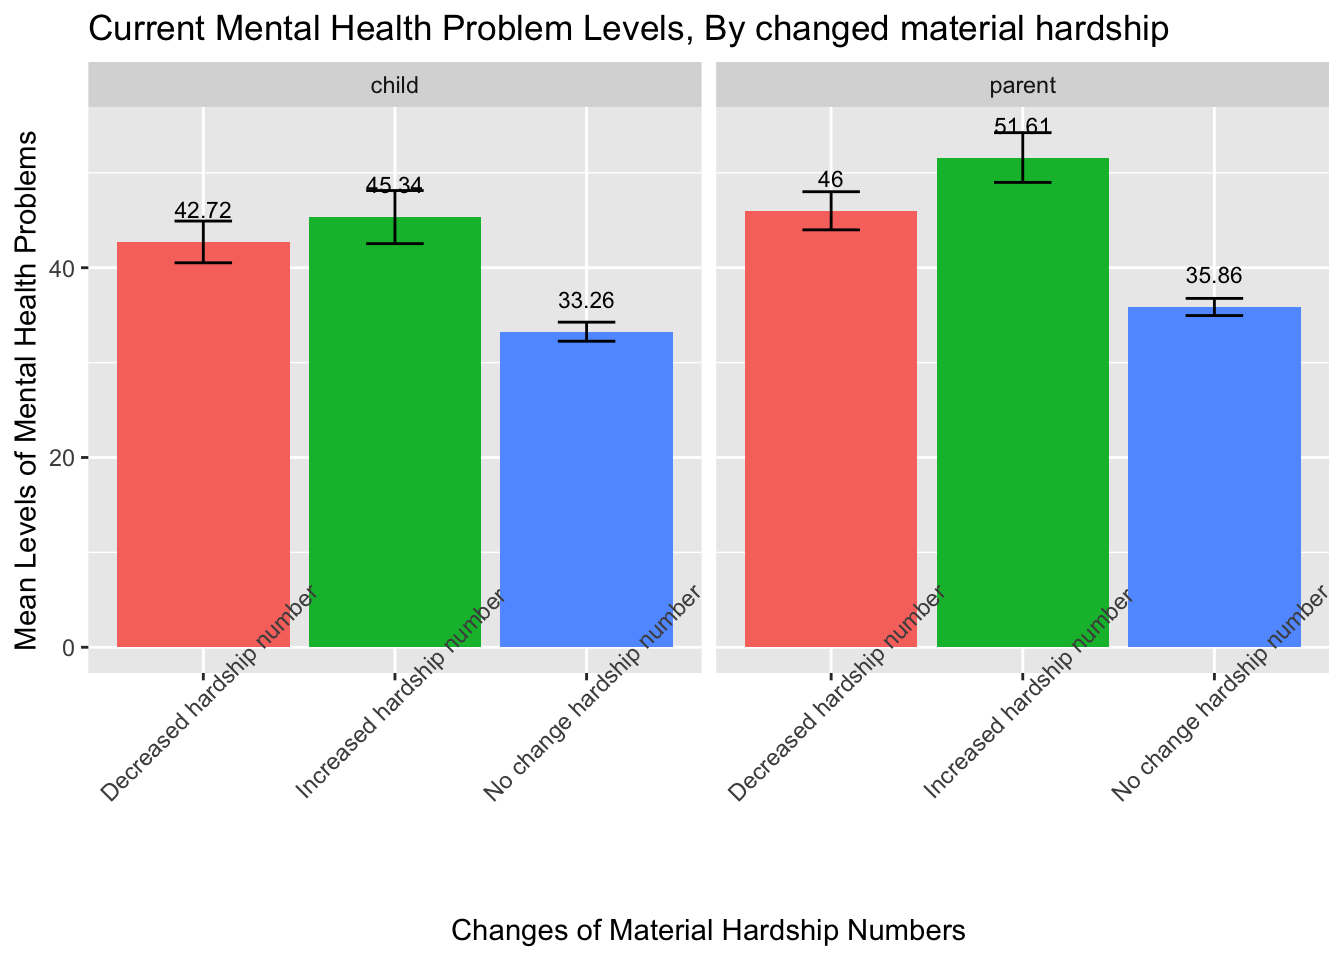
4.2 Association of Change with Mental Health Problems
- The figure below presented the mean mental health problems assessed AFTER Feb 3rd 2021 (week 43), grouped by whether families’ number of hardship increased, decreased, or did not change.
- The figure below presented the mean mental health problems CHANGES from before to after Feb 3rd 2021, grouped by whether families’ number of hardship increased, decreased, or did not change. Negative scores indicate decreased mental health problems