0. Sample Disclaimer
- This set of analyses on material hardship is based on responses collected from 5,336 caregivers between the dates of April 6th 2020 and March 20th 2021. These caregivers represent a range of voices: 6.60% are non-Latinx Black/African American, 14.75% are Latinx, and 27.96% live at or below 1.5 times the federal poverty line. Proportions/percentages are calculated based on the item-level response rates, not out of the total sample size. The data for these analyses are not weighted.
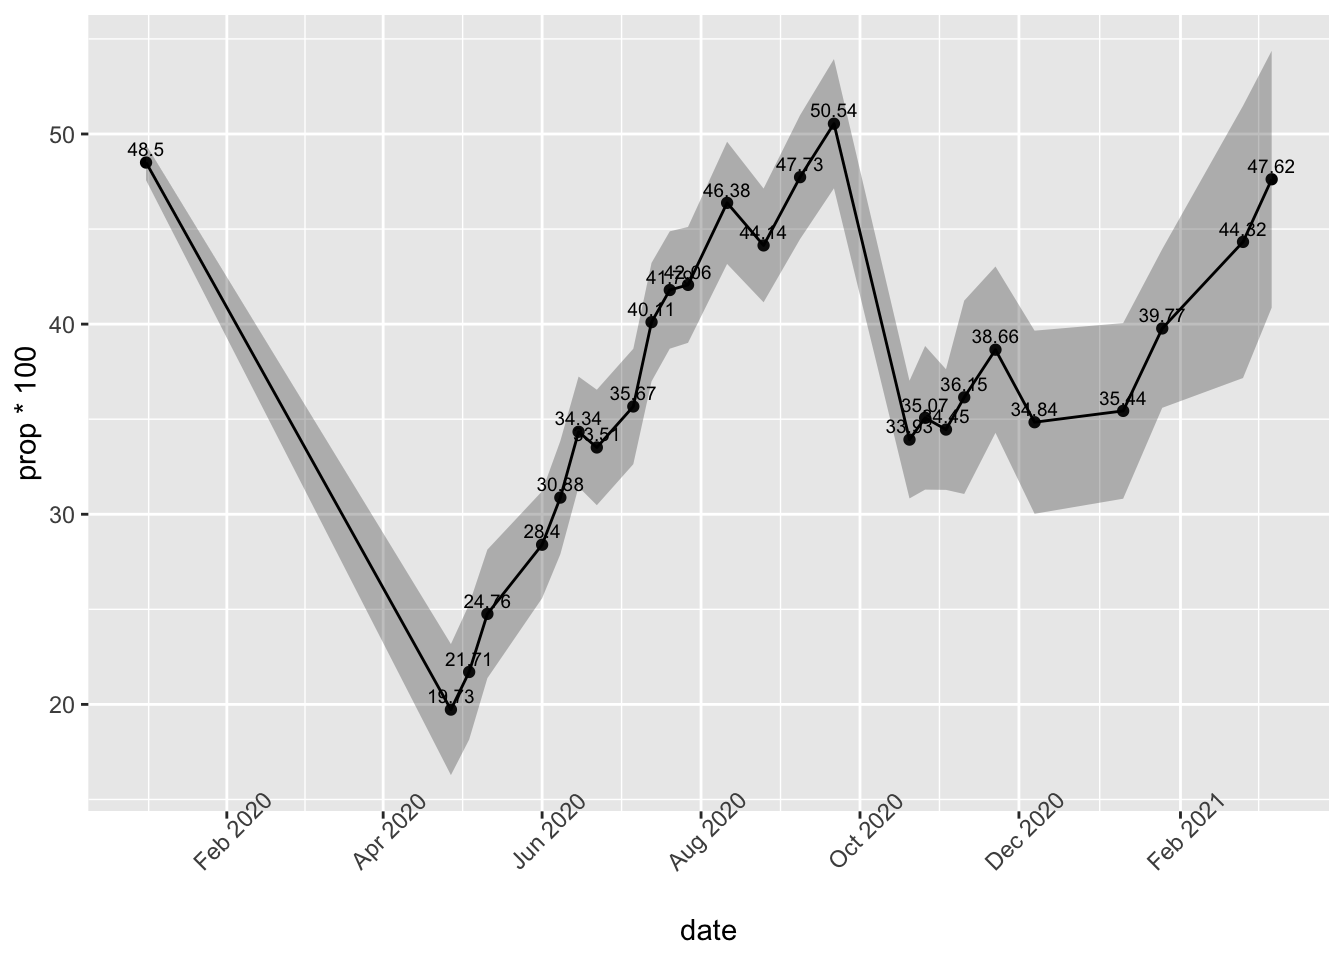
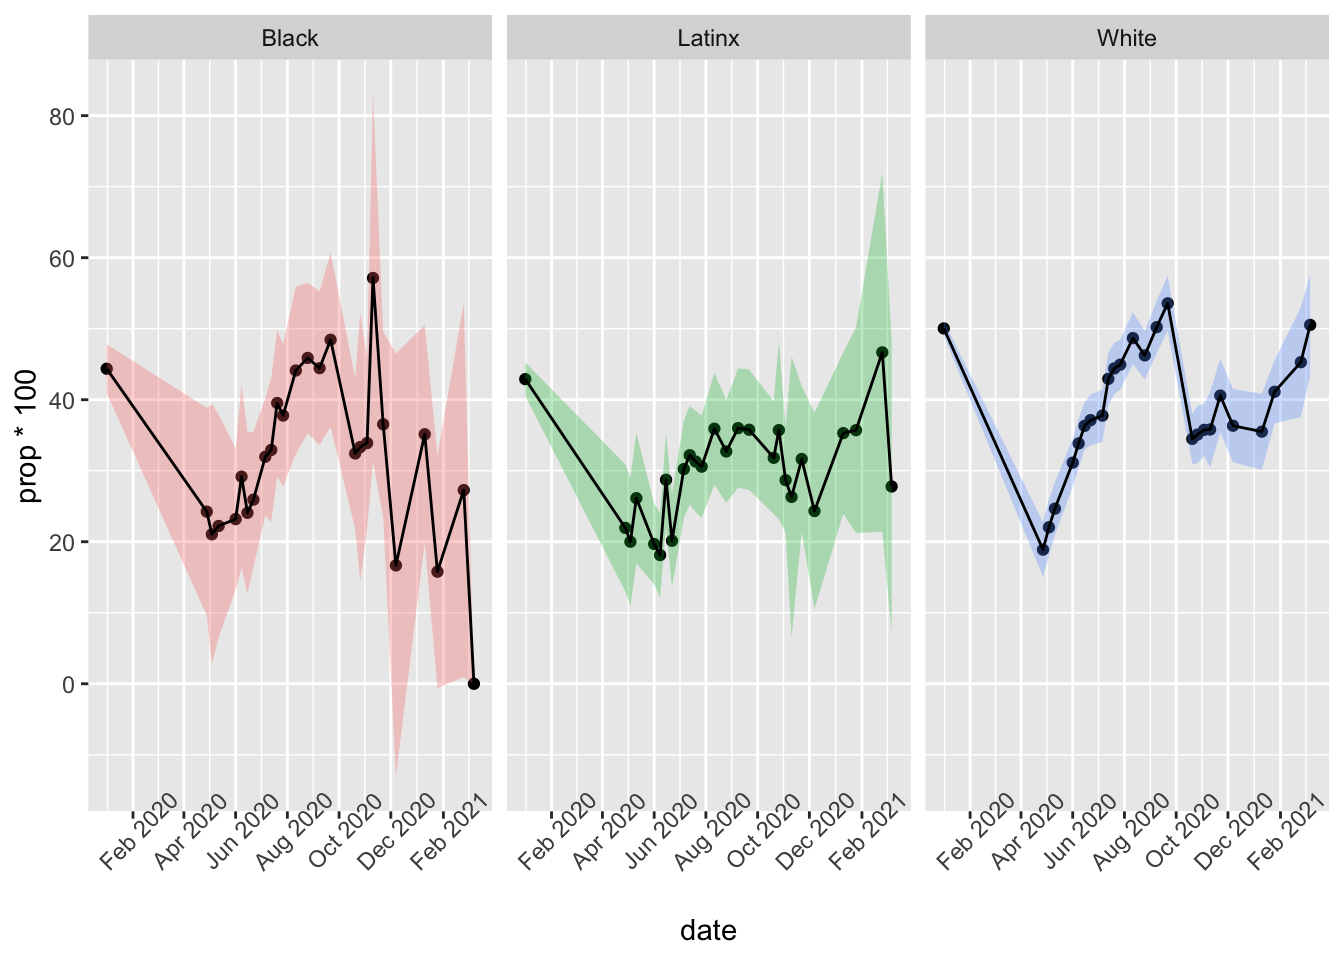
1. Overall Nonparental Childcare
1.1 By race/ethnicity
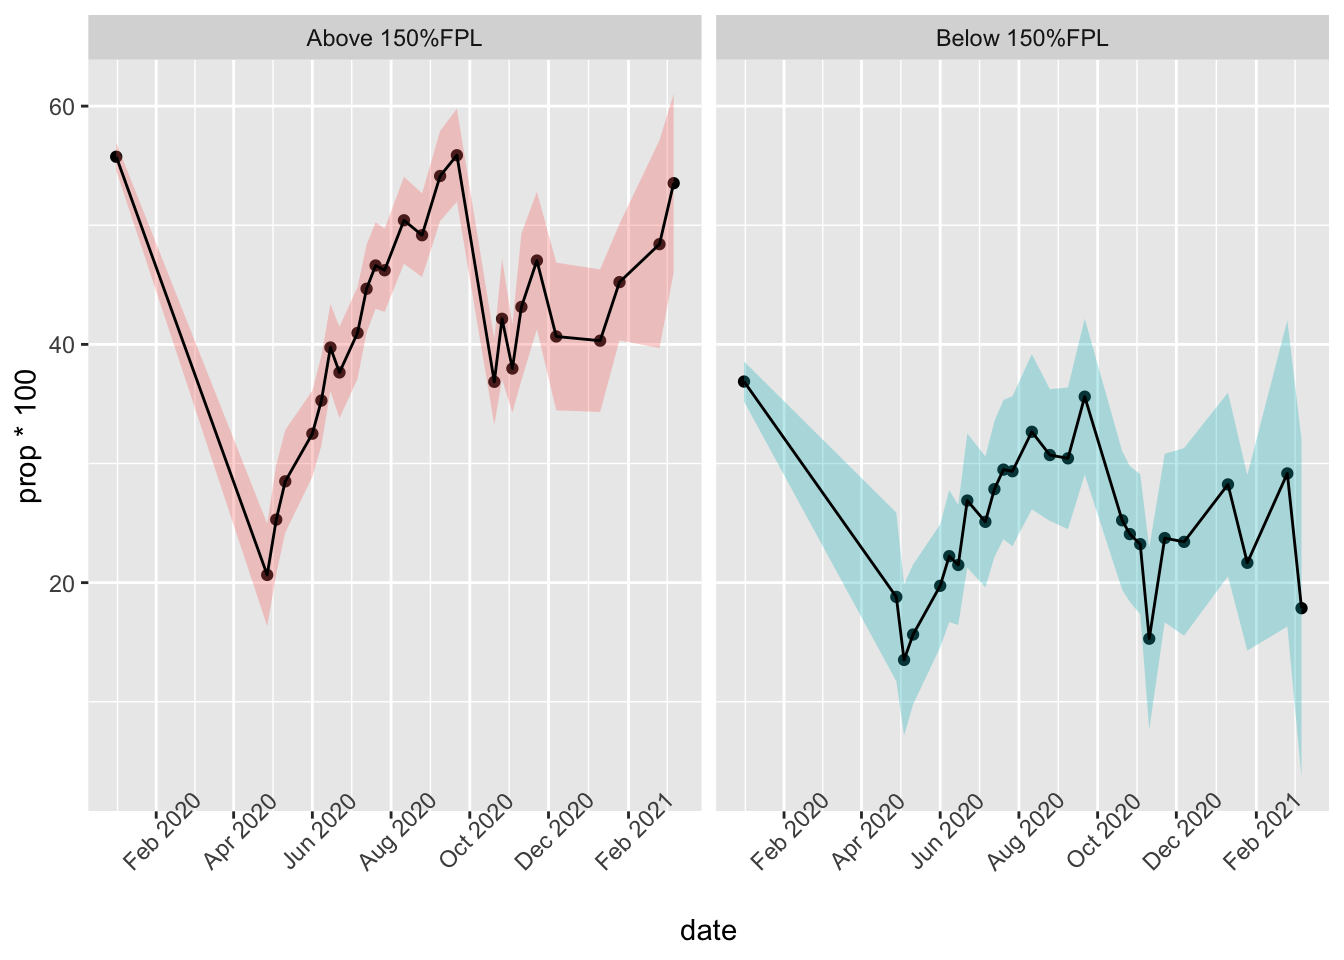
1.2 By poverty level
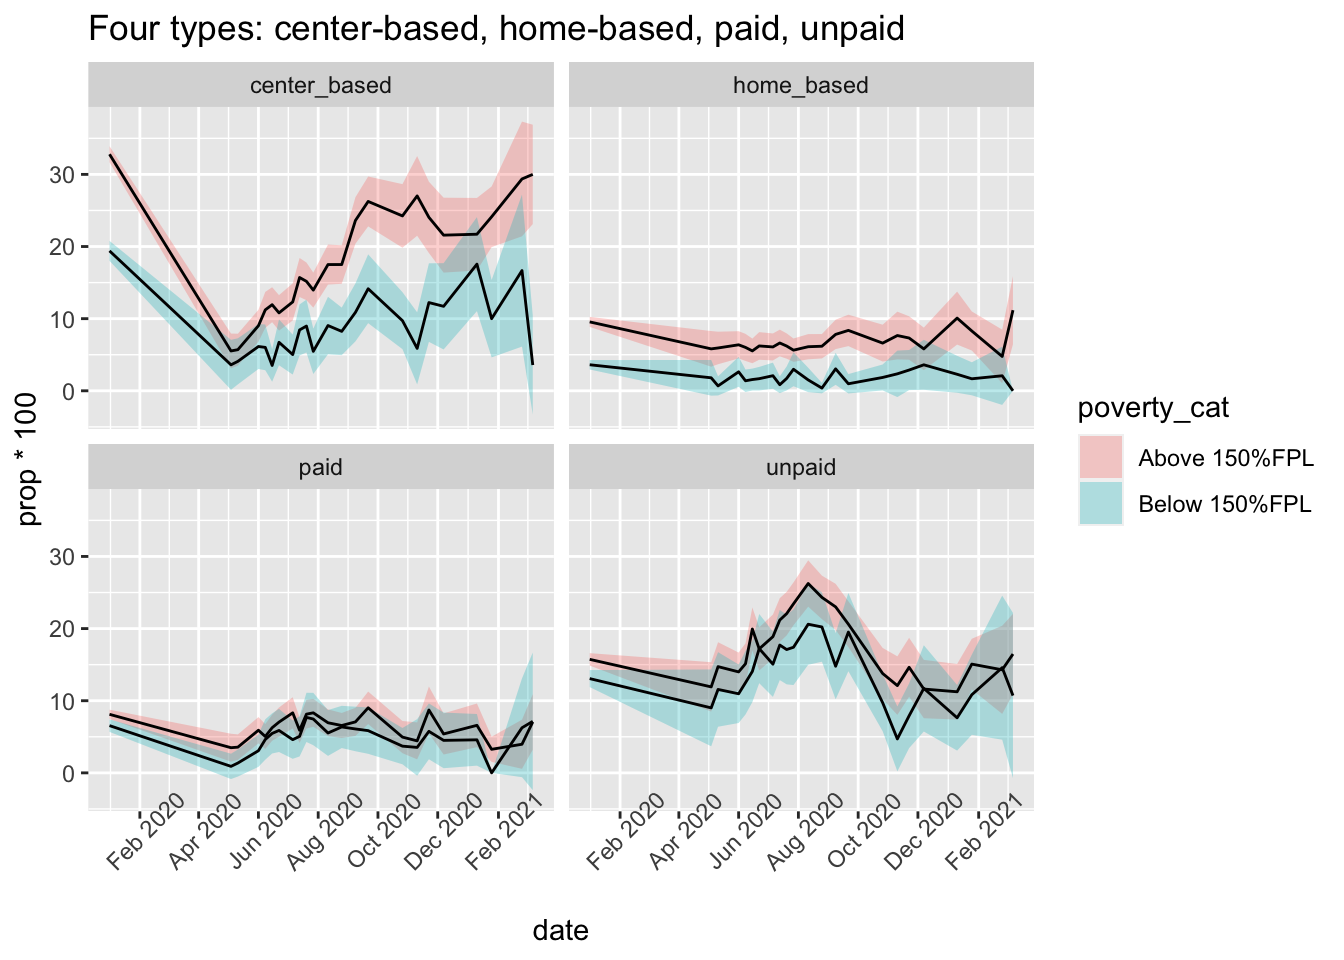
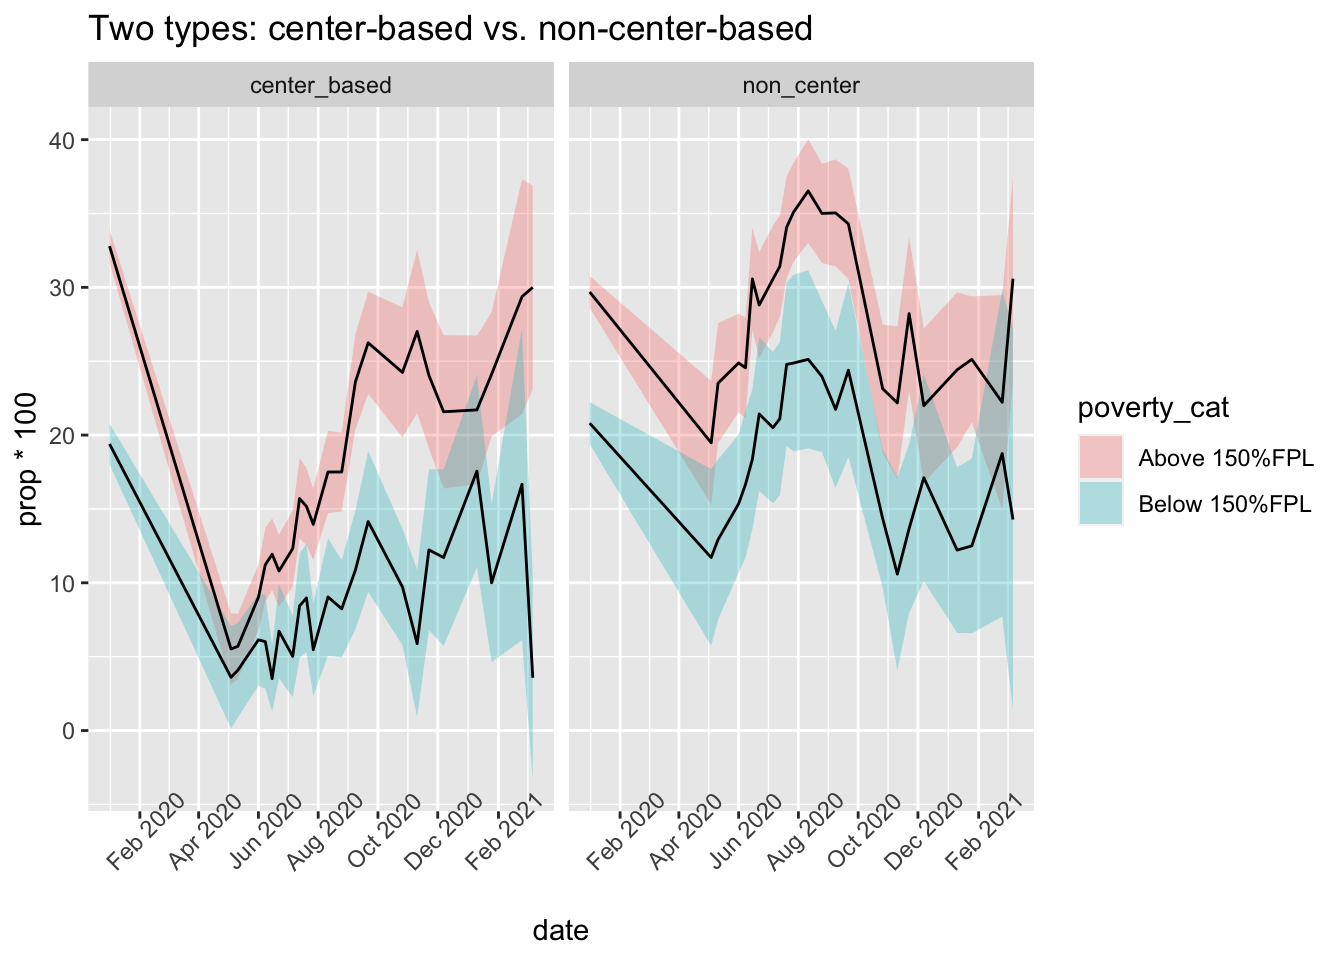
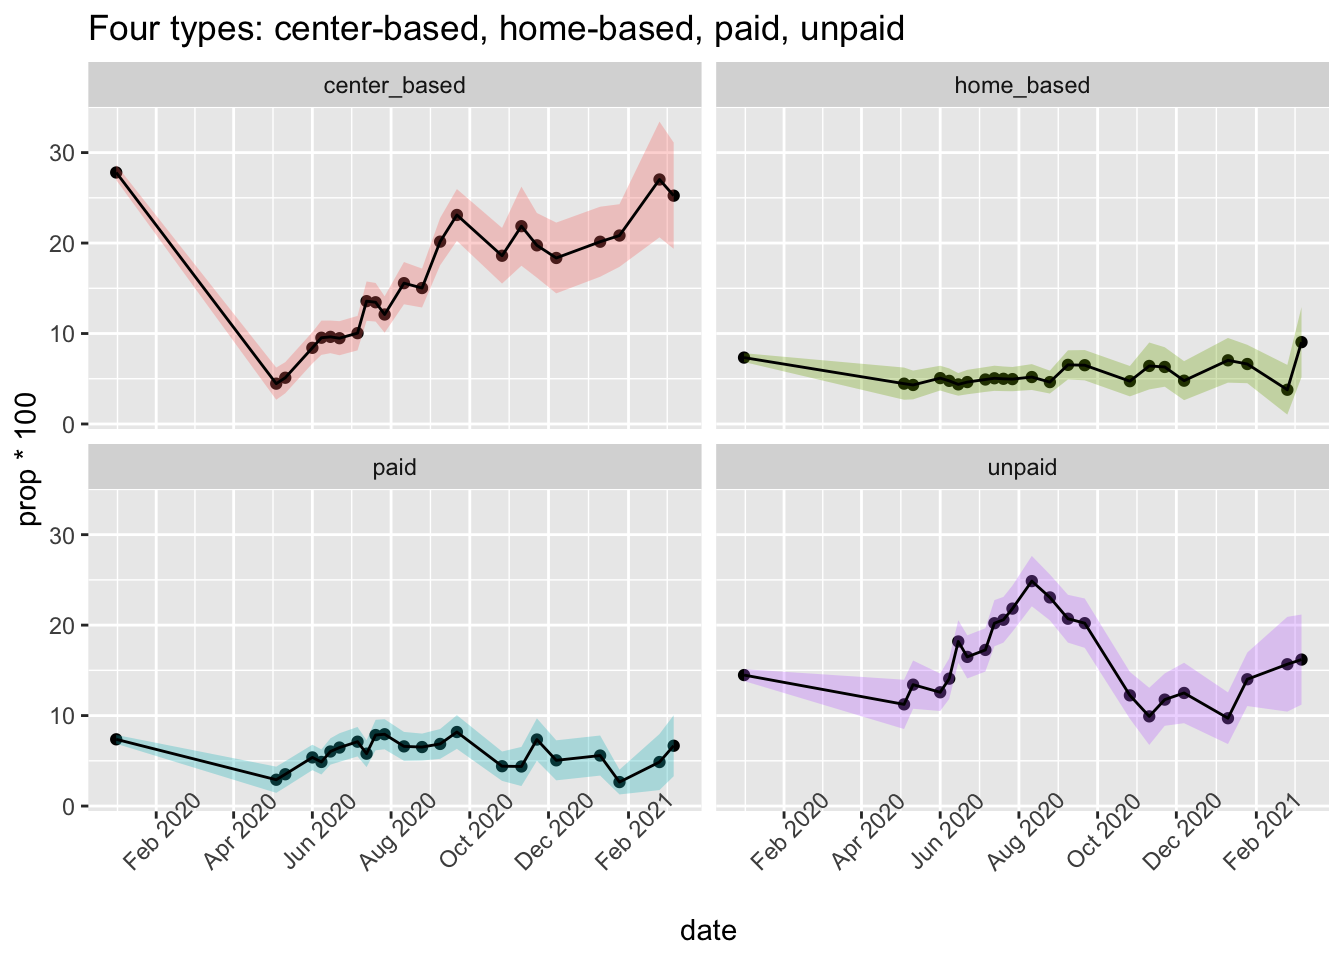
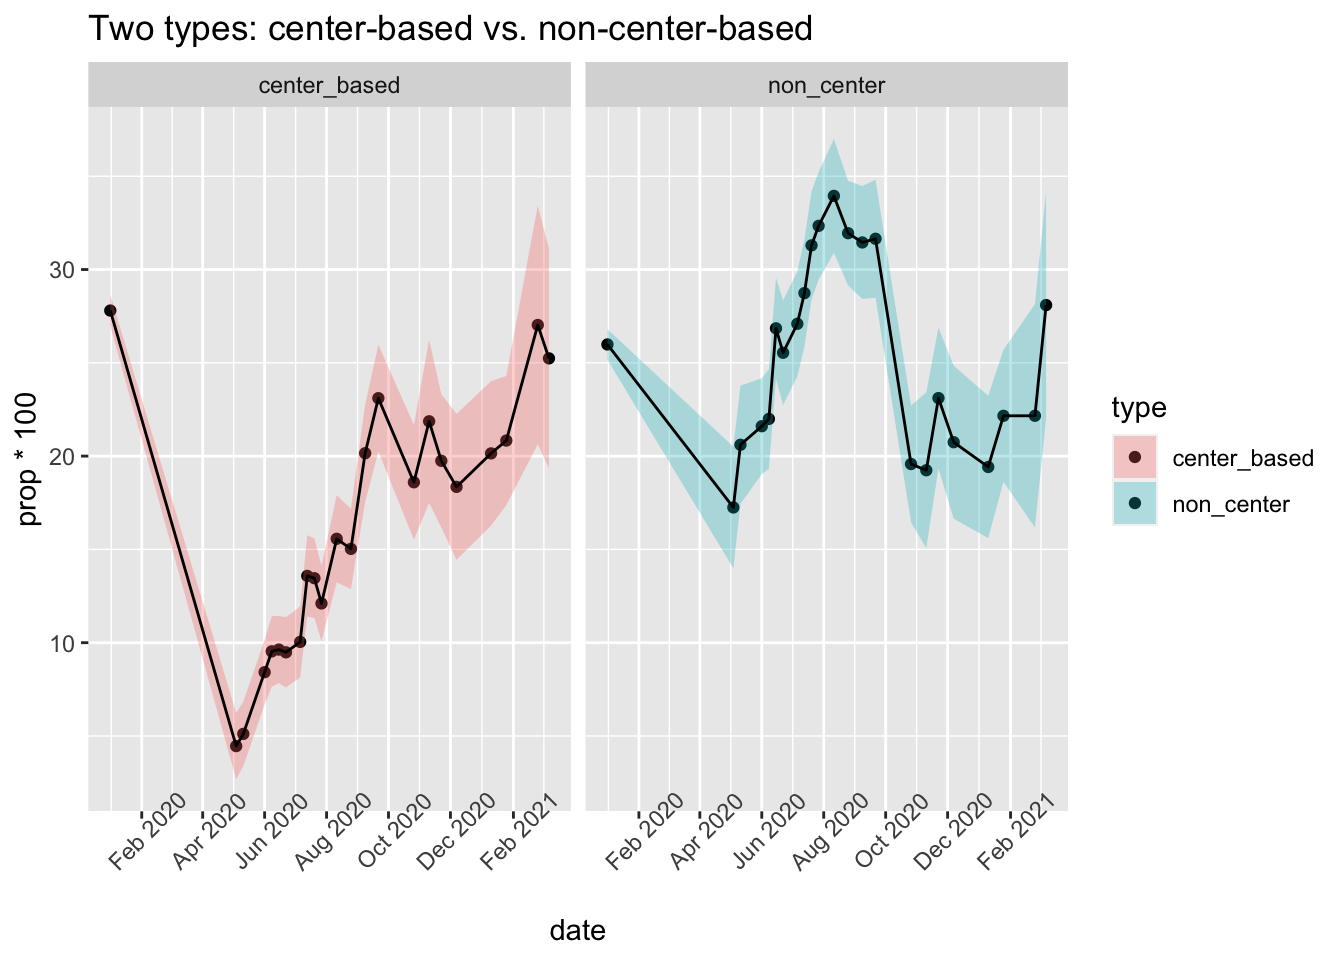
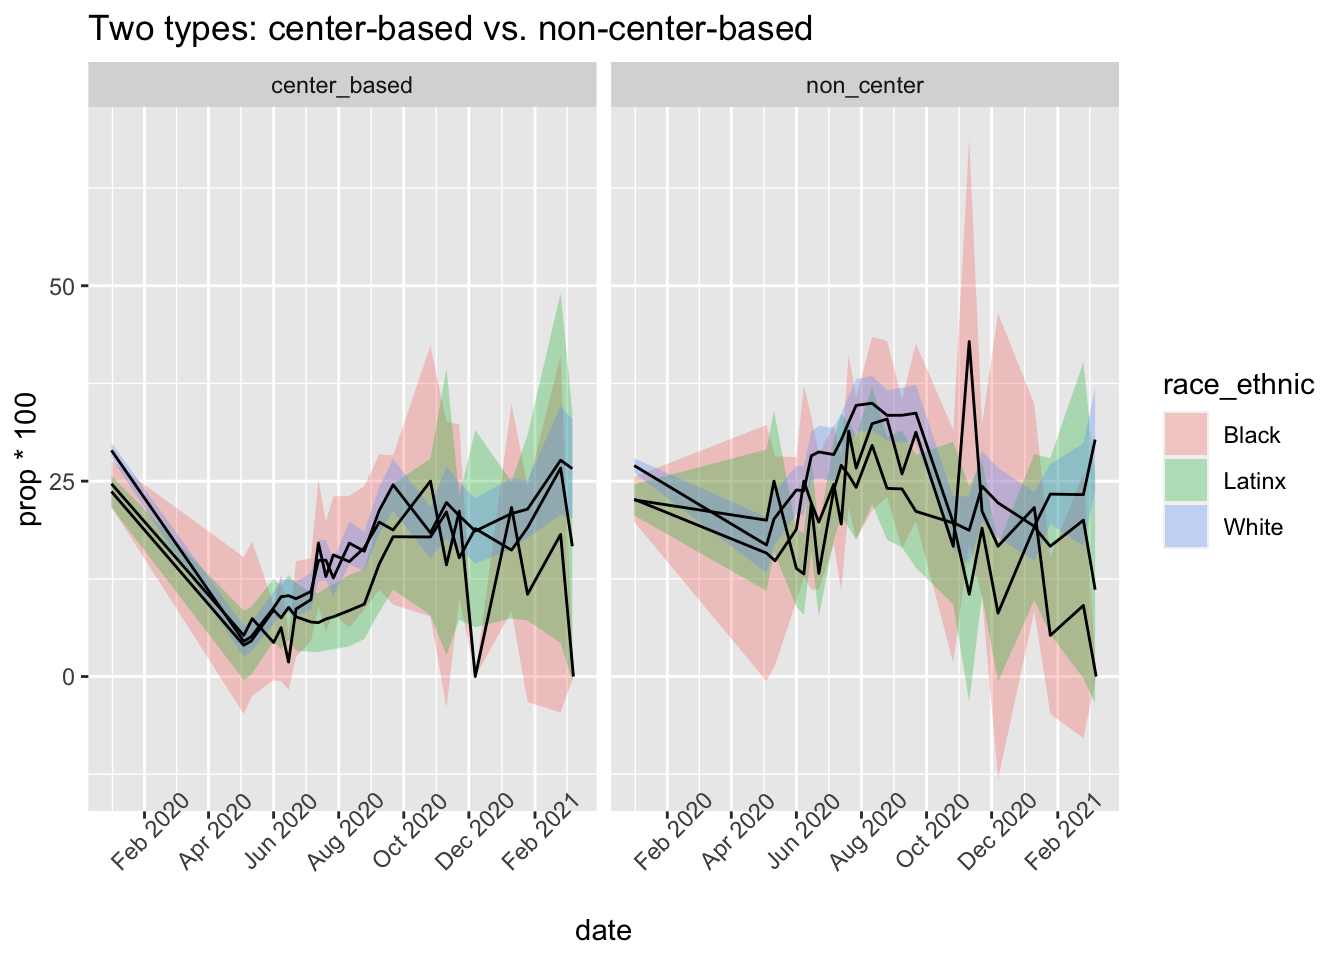
2. Different Types of Nonparental Childcare
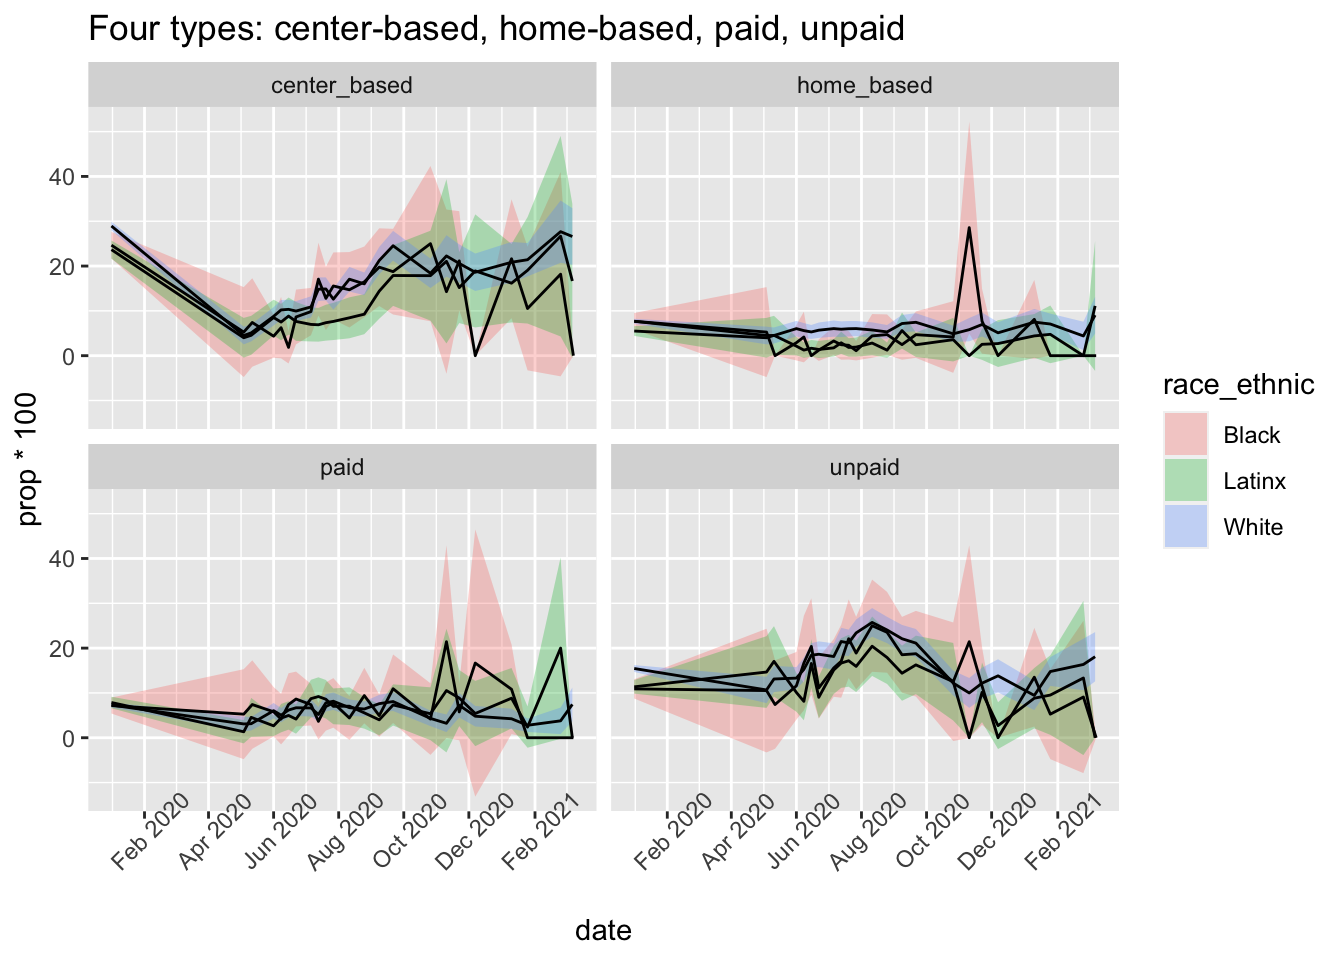
2.1 By race/ethnicity
2.2 By poverty level