I. Racism and COVID-19 limiting Black people’s health and wellbeing
Representativeness disclaimer
These analyses are based on responses collected from 8867 caregivers between the dates of April 06, 2020 and December 03, 2020. These caregivers represent a range of voices: 8.70% are Black/African American, 16.61% are LatinX, (0.00% report being both Black/African American and LatinX,) and 41.49% live at or below 1.5 times the federal poverty line. Proportions/percentages are calculated based on the item-level response rates, not out of the total sample size. The data for these analyses are not weighted.
More specifically, there were 774 Black caregivers who participated between the dates of April 06, 2020 and December 01, 2020.
Demographics
Demographics by income for Black respondents:
- Number of children
- Other household members
- Work and type of work – could use more specific information on this request. Which variable(s) in the dataset were you hoping to get descriptives for?
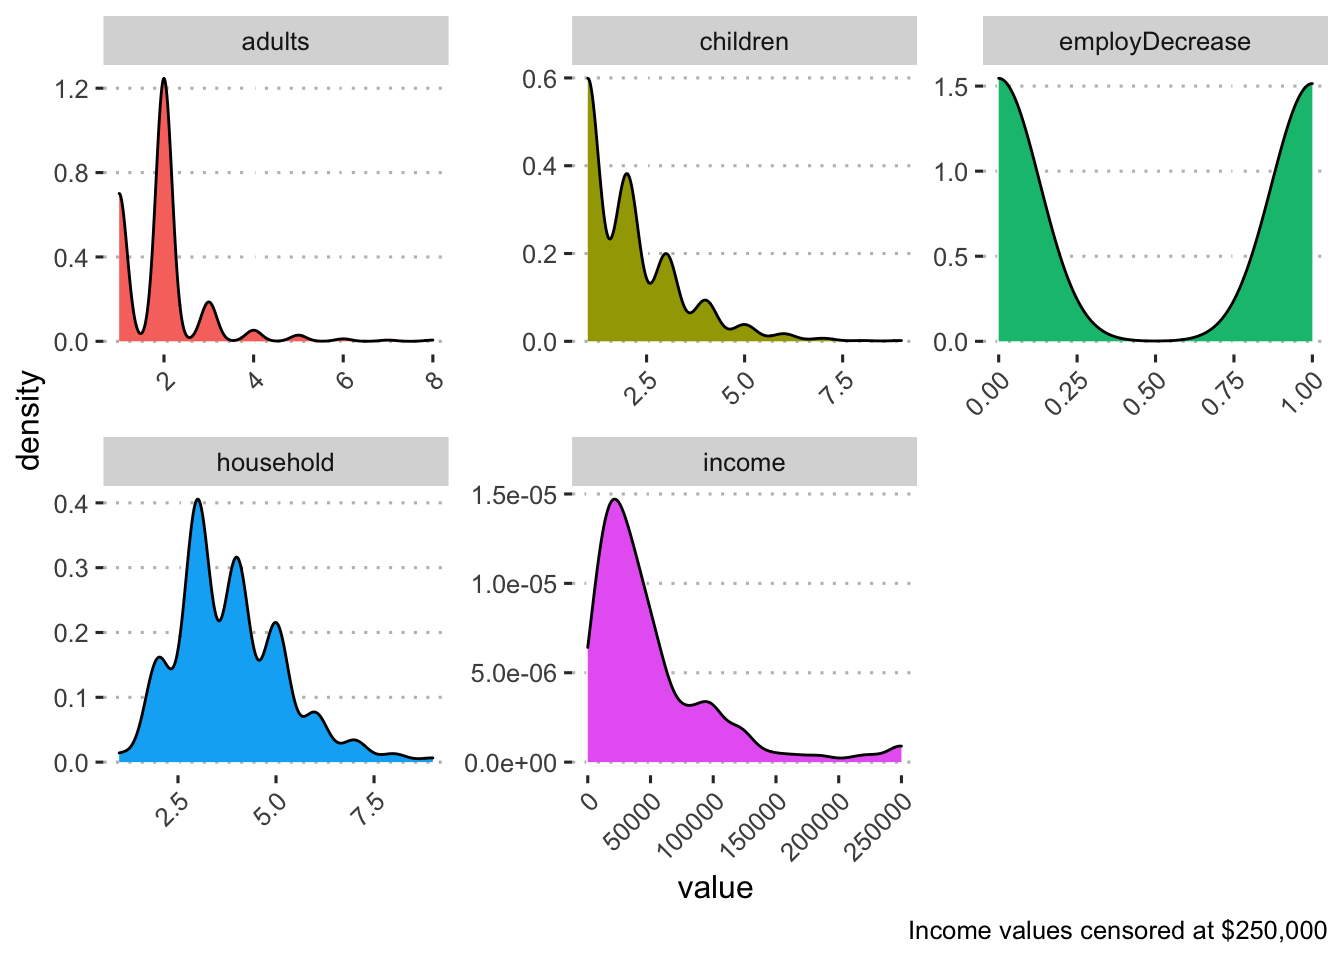
Black Caregivers
| variable | n | mean | sd | range |
|---|---|---|---|---|
| adults | 767 | 1.91 | 0.92 | 1.00 - 8.00 |
| children | 774 | 2.02 | 1.26 | 1.00 - 9.00 |
| employDecrease | 493 | 0.49 | 0.50 | 0.00 - 1.00 |
| household | 767 | 3.83 | 1.37 | 1.00 - 9.00 |
| income | 293 | 62,292.33 | 150,043.91 | 0.00 - 2,109,120.00 |
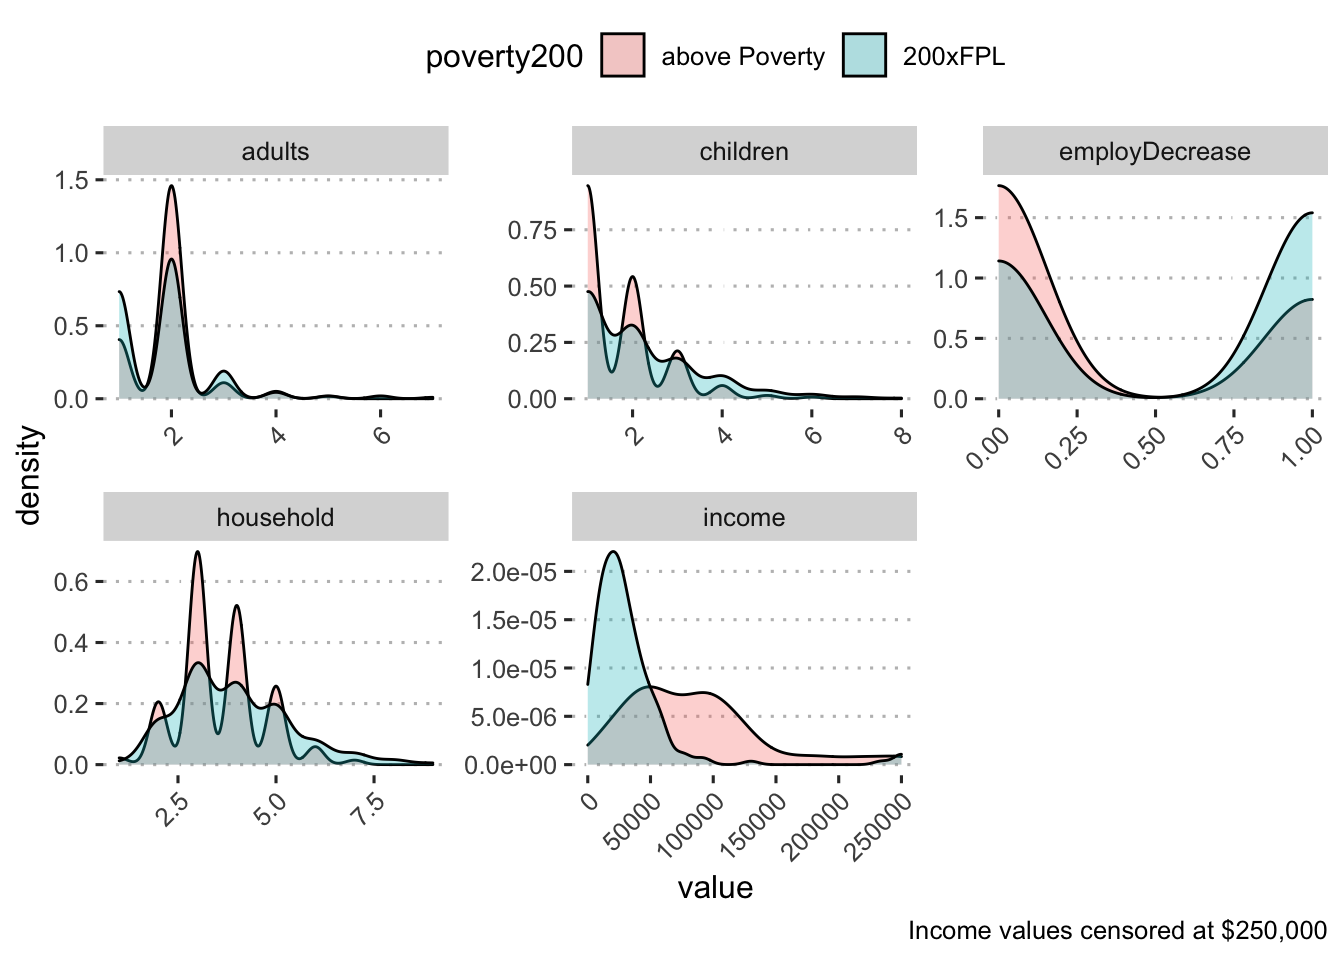
Black x federal poverty level (FPL)
| variable | n | mean | sd | range |
|---|---|---|---|---|
| above Poverty | ||||
| adults | 242 | 1.93 | 0.65 | 1.00 - 5.00 |
| children | 243 | 1.70 | 0.91 | 1.00 - 6.00 |
| employDecrease | 151 | 0.32 | 0.47 | 0.00 - 1.00 |
| household | 242 | 3.57 | 1.07 | 1.00 - 7.00 |
| income | 106 | 95,387.69 | 131,399.01 | 60.00 - 1,300,000.00 |
| 200xFPL | ||||
| adults | 406 | 1.86 | 0.95 | 1.00 - 7.00 |
| children | 410 | 2.12 | 1.32 | 1.00 - 8.00 |
| employDecrease | 242 | 0.57 | 0.50 | 0.00 - 1.00 |
| household | 406 | 3.91 | 1.43 | 1.00 - 9.00 |
| income | 184 | 43,278.03 | 157,904.31 | 0.00 - 2,109,120.00 |
Sought care
Black vs Non-Black
Race/ethnicity
Black by income
Care over time
Black vs Non-Black
Race/ethnicty
Black x income
Sought other resources
Black vs Non-Black
Race/ethnicity
Black by income
Other resources over time
Black vs Non-Black
Race/ethnicty
Black x income
Delay healthcare
Black vs non-Black
Race/ethnicity
Black by income
Reason delay healthcare
Black vs non-Black
Race/ethnicity
Black x income
Paying for basic needs
Black vs non-Black
Race/ethnicity
Black by income
Mental health
Caregiver
Child
Childcare
- Pre-pandemic: retrospective report
- Spring: through May 31
- Summer: through August 31
- Fall: through current survey (Nov 5)